| Param | Original file | Final file |
|---|---|---|
| Filename | modeM0/AS1T01_218T01_9000001852cztM0_level2.fits | modeM0/AS1T01_218T01_9000001852cztM0_level2_quad_clean.evt |
| Size (bytes) | 694,788,480 | 678,801,600 |
| Size | 662.6 MB | 647.4 MB |
| Events in quadrant A | 4,192,502 | 4,038,230 |
| Events in quadrant B | 4,080,440 | 4,054,695 |
| Events in quadrant C | 4,172,536 | 3,883,900 |
| Events in quadrant D | 3,546,776 | 3,532,646 |
| Mode M0 | |||
|---|---|---|---|
| Quadrant | BADHDUFLAG | Total packets | Discarded packets |
| A | 0 | 157884 | 0 |
| B | 0 | 166326 | 0 |
| C | 0 | 151858 | 0 |
| D | 0 | 181387 | 0 |
| Mode SS | |||
|---|---|---|---|
| Quadrant | BADHDUFLAG | Total packets | Discarded packets |
| A | 0 | 1502 | 0 |
| B | 0 | 1502 | 0 |
| C | 0 | 1502 | 0 |
| D | 0 | 1502 | 0 |
| Mode M9 | |||
|---|---|---|---|
| Quadrant | BADHDUFLAG | Total packets | Discarded packets |
| A | 0 | 117 | 0 |
| B | 0 | 117 | 0 |
| C | 0 | 117 | 0 |
| D | 0 | 117 | 0 |
| Quadrant | Total seconds | Saturated seconds | Saturation percentage |
|---|---|---|---|
| A | 73610 | 1091 | 1.482136% |
| B | 73610 | 1978 | 2.687135% |
| C | 73610 | 706 | 0.959109% |
| D | 73610 | 2237 | 3.038989% |
Noise dominated data is calculated using 1-second bins in cleaned event files. If a bin has >2000 counts, and if more than 50% of those come from <1% of pixels, then it is considered to be noise-dominated and hence unusable.
| Quadrant | # 1 sec bins | Bins with >0 counts | Bins with >2000 counts | High rate bins dominated by noise | Noise dominated (total time) | Noise dominated (detector-on time) | Marked lightcurve |
|---|---|---|---|---|---|---|---|
| A | 85505 | 73608 | 0 | 0 | 0.00% | 0.00% |  |
| B | 85505 | 73608 | 0 | 0 | 0.00% | 0.00% |  |
| C | 85505 | 73606 | 0 | 0 | 0.00% | 0.00% |  |
| D | 85505 | 73599 | 0 | 0 | 0.00% | 0.00% |  |
Top three noisy pixels from each quadrant. If the there are fewer than three noisy pixels in the level2.evt file, extra rows are filled as -1
| Pixel properties | Quadrant properties | ||||||
|---|---|---|---|---|---|---|---|
| Quadrant | DetID | PixID | Counts | Sigma | Mean | Median | Sigma |
| A | 0 | 29 | 4023 | 10.82 | 1092 | 1019 | 277.5 |
| A | 7 | 110 | 3361 | 8.44 | 1092 | 1019 | 277.5 |
| A | 0 | 30 | 3141 | 7.65 | 1092 | 1019 | 277.5 |
| B | 2 | 9 | 3465 | 11.4 | 1075 | 1023 | 214.1 |
| B | 12 | 226 | 2750 | 8.06 | 1075 | 1023 | 214.1 |
| B | 3 | 17 | 2731 | 7.98 | 1075 | 1023 | 214.1 |
| C | 1 | 81 | 3103 | 7.34 | 1101 | 1022 | 283.5 |
| C | 1 | 80 | 3067 | 7.21 | 1101 | 1022 | 283.5 |
| C | 12 | 241 | 3002 | 6.98 | 1101 | 1022 | 283.5 |
| D | 7 | 5 | 2561 | 6.07 | 1013 | 918 | 270.8 |
| D | 7 | 3 | 2550 | 6.03 | 1013 | 918 | 270.8 |
| D | 6 | 231 | 2504 | 5.86 | 1013 | 918 | 270.8 |
Histogram calculated using DETX and DETY for each event in the final _common_clean file
| Quadrant A | 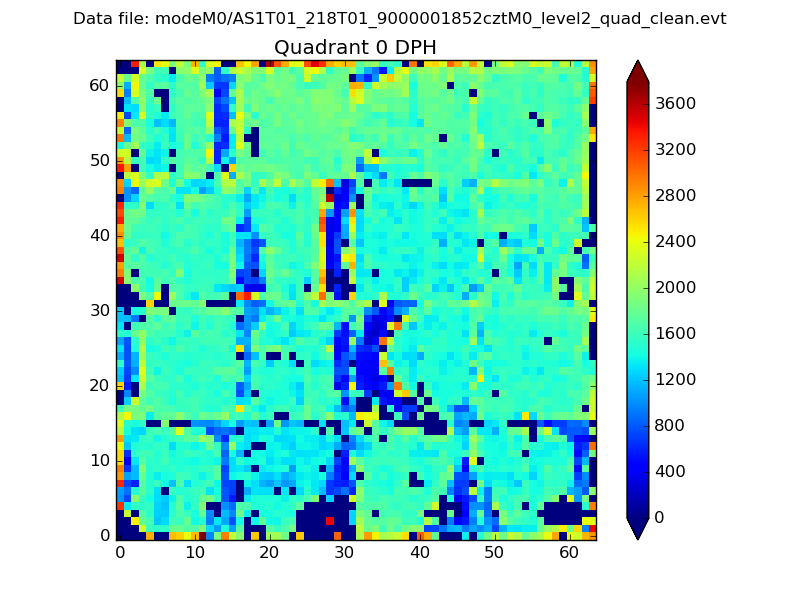 |
 |
Quadrant B |
|---|---|---|---|
| Quadrant D |  |
 |
Quadrant C |
| Plot type | Count rate plots | Images |
|---|---|---|
| Comparison with Poisson distribution Blue bars denote a histogram of data divided into 1 sec bins. Red curve is a Poisson curve with rate = median count rate of data. |
 |
 |
| Quadrant-wise count rates Data is divided into 100 sec bins |
 |
|
| Module-wise count rates for Quadrant A Data is divided into 100 sec bins |
 |
 |
| Module-wise count rates for Quadrant B Data is divided into 100 sec bins |
 |
 |
| Module-wise count rates for Quadrant C Data is divided into 100 sec bins |
 |
 |
| Module-wise count rates for Quadrant D Data is divided into 100 sec bins |
 |
 |
| Parameter | Plot |
|---|---|
| CZT HV Monitor |  |
| D_VDD |  |
| Temperature 1 |  |
| Veto HV Monitor |  |
| Veto LLD |  |
| Alpha Counter |  |
| _CPM_Rate |  |
| CZT Counter |  |
| +2.5 Volts monitor |  |
| +5 Volts monitor |  |
| _ROLL_ROT |  |
| _Roll_DEC |  |
| _Roll_RA |  |
| Veto Counter |  |