| Param | Original file | Final file |
|---|---|---|
| Filename | modeM0/AS1T01_218T01_9000001852_12505cztM0_level2.evt | modeM0/AS1T01_218T01_9000001852_12505cztM0_level2_quad_clean.evt |
| Size (bytes) | 250,191,360 | 36,302,400 |
| Size | 238.6 MB | 34.6 MB |
| Events in quadrant A | 1,865,005 | 222,114 |
| Events in quadrant B | 2,023,718 | 228,894 |
| Events in quadrant C | 1,562,264 | 220,821 |
| Events in quadrant D | 1,913,907 | 206,308 |
| Mode M0 | |||
|---|---|---|---|
| Quadrant | BADHDUFLAG | Total packets | Discarded packets |
| A | 0 | 7613 | 2 |
| B | 0 | 7969 | 1 |
| C | 0 | 6565 | 1 |
| D | 0 | 7750 | 1 |
| Mode SS | |||
|---|---|---|---|
| Quadrant | BADHDUFLAG | Total packets | Discarded packets |
| A | 0 | 62 | 0 |
| B | 0 | 62 | 0 |
| C | 0 | 62 | 0 |
| D | 0 | 62 | 0 |
| Mode M9 | |||
|---|---|---|---|
| Quadrant | BADHDUFLAG | Total packets | Discarded packets |
| A | 0 | 14 | 0 |
| B | 0 | 14 | 0 |
| C | 0 | 14 | 0 |
| D | 0 | 14 | 0 |
| Quadrant | Total seconds | Saturated seconds | Saturation percentage |
|---|---|---|---|
| A | 3107 | 57 | 1.834567% |
| B | 3107 | 184 | 5.922111% |
| C | 3107 | 21 | 0.675893% |
| D | 3107 | 74 | 2.381719% |
Noise dominated data is calculated using 1-second bins in cleaned event files. If a bin has >2000 counts, and if more than 50% of those come from <1% of pixels, then it is considered to be noise-dominated and hence unusable.
| Quadrant | # 1 sec bins | Bins with >0 counts | Bins with >2000 counts | High rate bins dominated by noise | Noise dominated (total time) | Noise dominated (detector-on time) | Marked lightcurve |
|---|---|---|---|---|---|---|---|
| A | 4448 | 3109 | 1 | 1 | 0.02% | 0.03% |  |
| B | 4448 | 3109 | 99 | 99 | 2.23% | 3.18% | 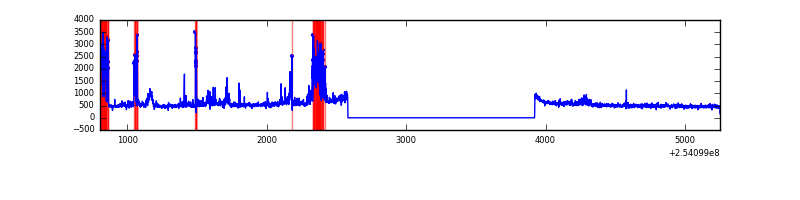 |
| C | 4448 | 3109 | 0 | 0 | 0.00% | 0.00% | 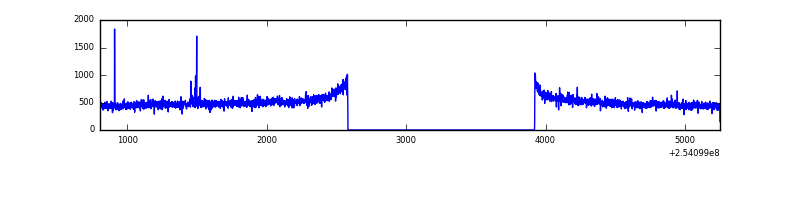 |
| D | 4448 | 3109 | 59 | 59 | 1.33% | 1.90% | 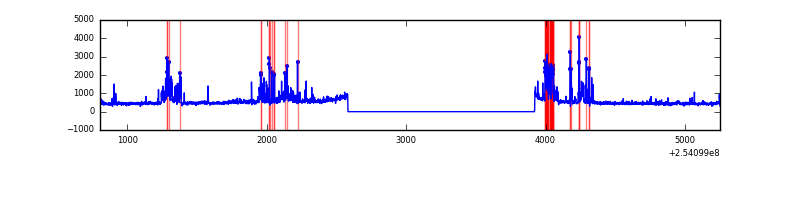 |
Top three noisy pixels from each quadrant. If the there are fewer than three noisy pixels in the level2.evt file, extra rows are filled as -1
| Pixel properties | Quadrant properties | ||||||
|---|---|---|---|---|---|---|---|
| Quadrant | DetID | PixID | Counts | Sigma | Mean | Median | Sigma |
| A | 1 | 162 | 104886 | 1261.42 | 407 | 400 | 82.8 |
| A | 1 | 178 | 63046 | 756.3 | 407 | 400 | 82.8 |
| A | 1 | 161 | 53430 | 640.21 | 407 | 400 | 82.8 |
| B | 4 | 239 | 207117 | 2659.05 | 405 | 395 | 77.7 |
| B | 3 | 64 | 170795 | 2191.84 | 405 | 395 | 77.7 |
| B | 11 | 51 | 36439 | 463.63 | 405 | 395 | 77.7 |
| C | 14 | 234 | 10352 | 107.16 | 397 | 400 | 92.9 |
| C | 13 | 61 | 2845 | 26.33 | 397 | 400 | 92.9 |
| C | 14 | 67 | 1846 | 15.57 | 397 | 400 | 92.9 |
| D | 1 | 52 | 227124 | 2440.32 | 388 | 377 | 92.9 |
| D | 10 | 157 | 116780 | 1252.77 | 388 | 377 | 92.9 |
| D | 8 | 195 | 34416 | 366.34 | 388 | 377 | 92.9 |
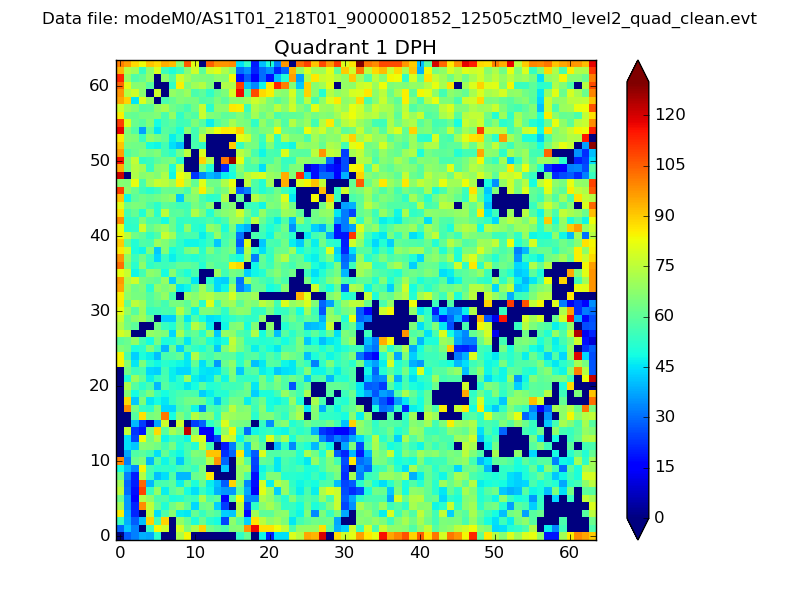
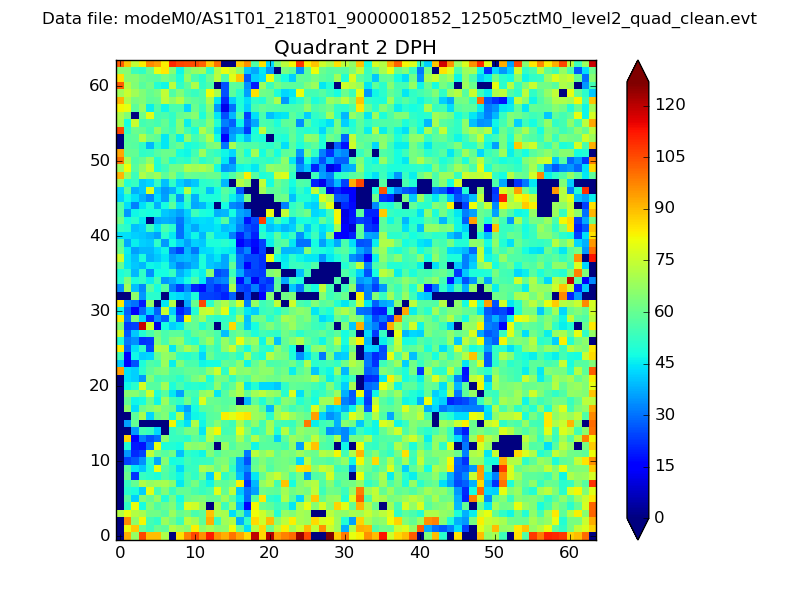
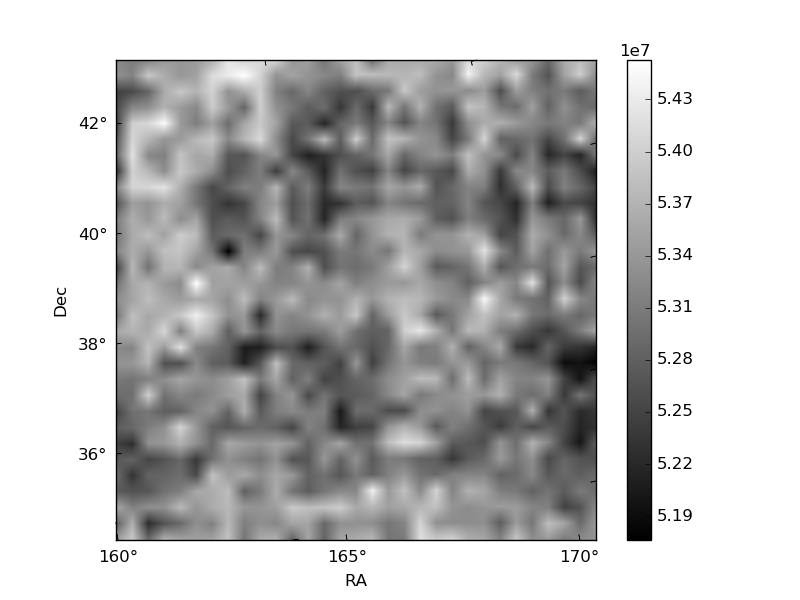
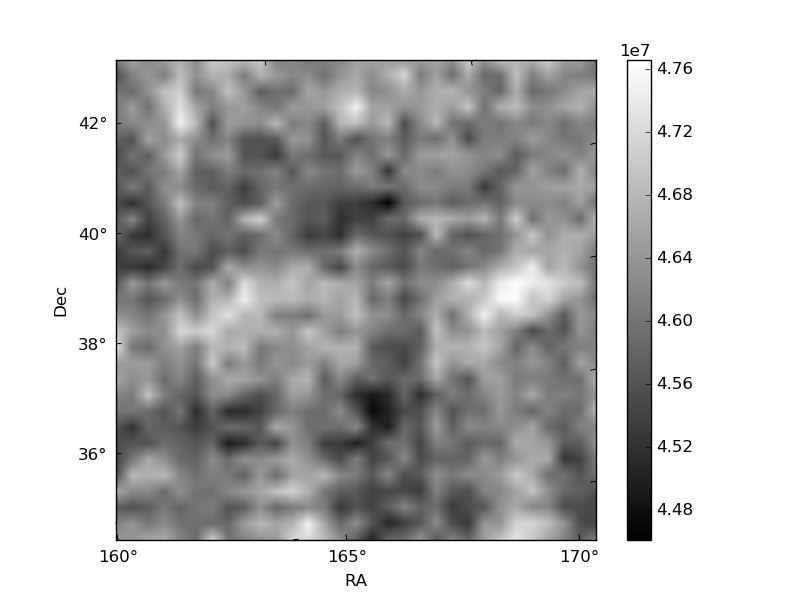
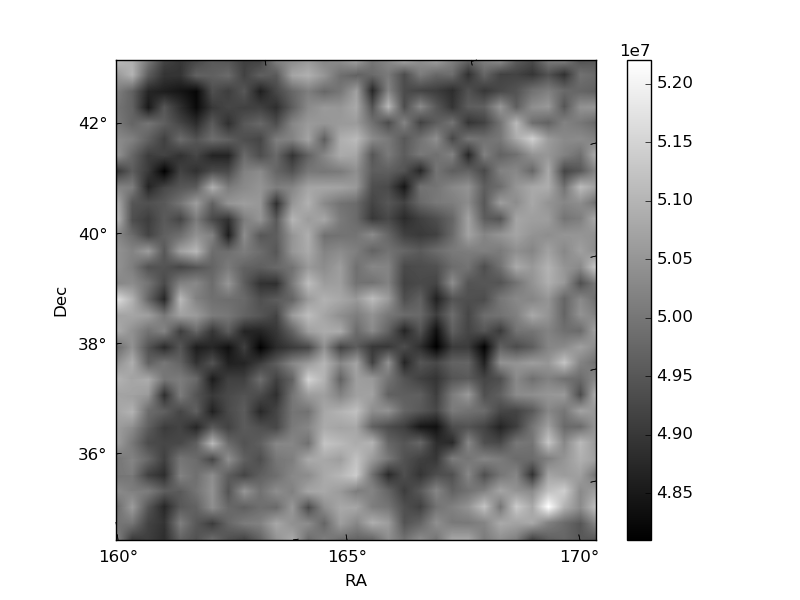
Histogram calculated using DETX and DETY for each event in the final _common_clean file
| Quadrant A |  |
 |
Quadrant B |
|---|---|---|---|
| Quadrant D | 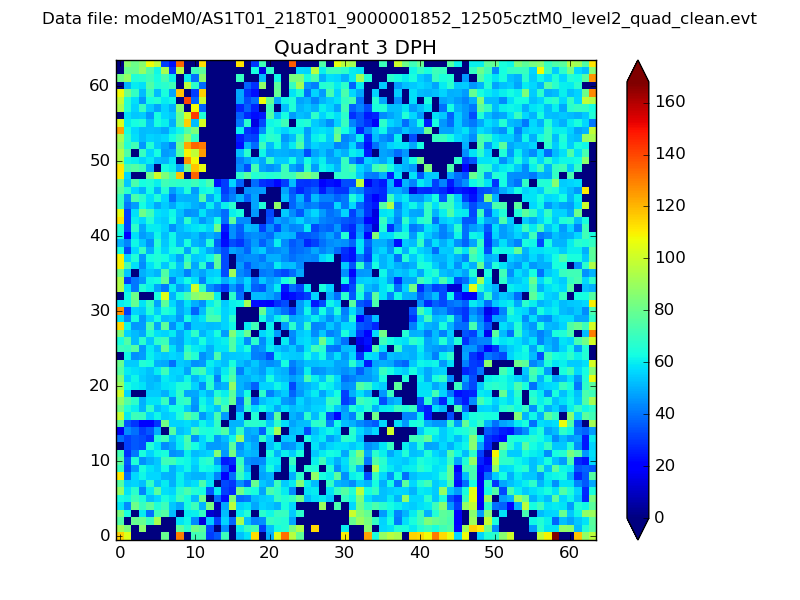 |
 |
Quadrant C |
| Plot type | Count rate plots | Images |
|---|---|---|
| Comparison with Poisson distribution Blue bars denote a histogram of data divided into 1 sec bins. Red curve is a Poisson curve with rate = median count rate of data. |
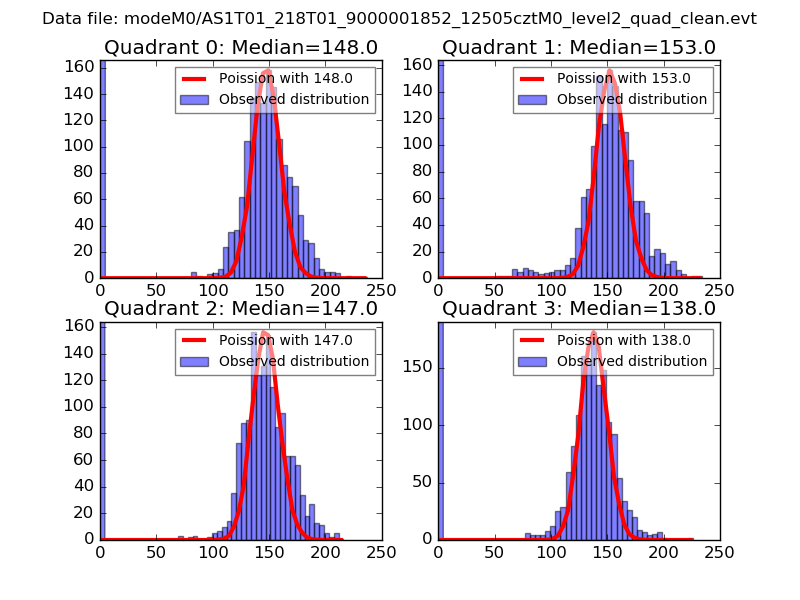 |
 |
| Quadrant-wise count rates Data is divided into 100 sec bins |
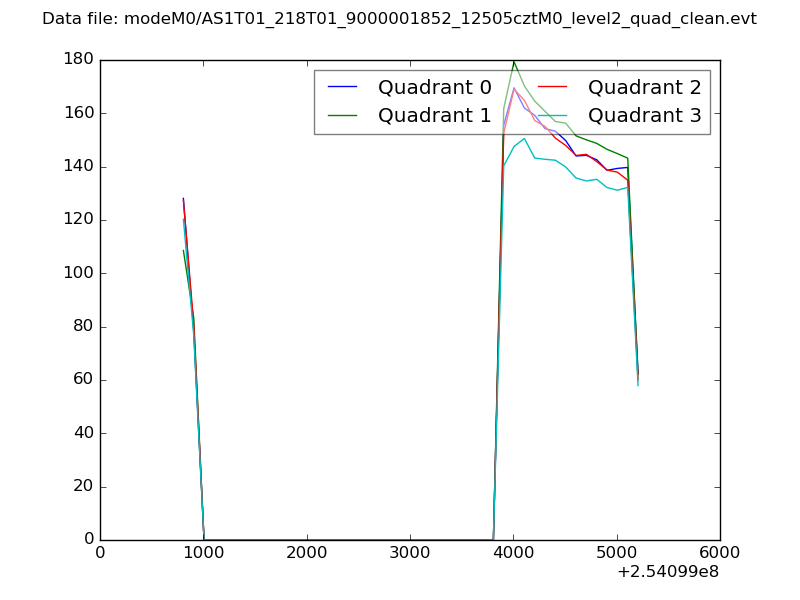 |
|
| Module-wise count rates for Quadrant A Data is divided into 100 sec bins |
 |
 |
| Module-wise count rates for Quadrant B Data is divided into 100 sec bins |
 |
 |
| Module-wise count rates for Quadrant C Data is divided into 100 sec bins |
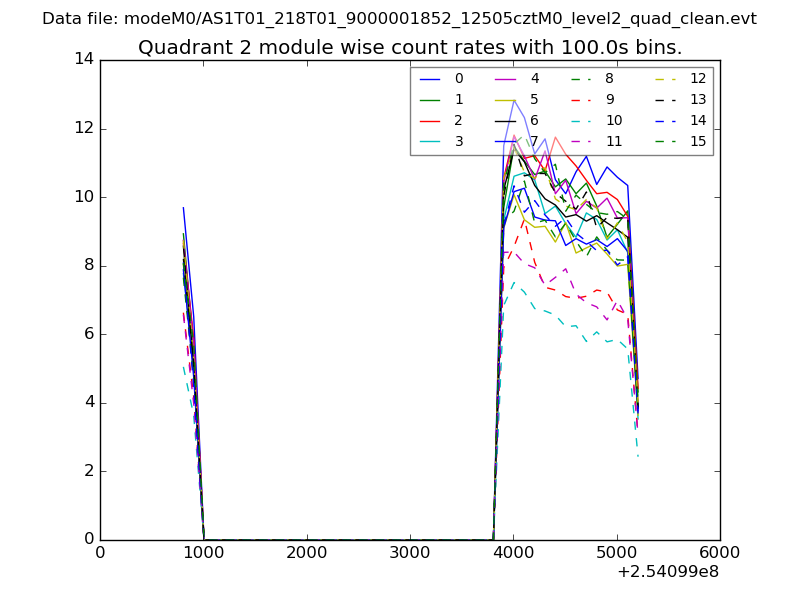 |
 |
| Module-wise count rates for Quadrant D Data is divided into 100 sec bins |
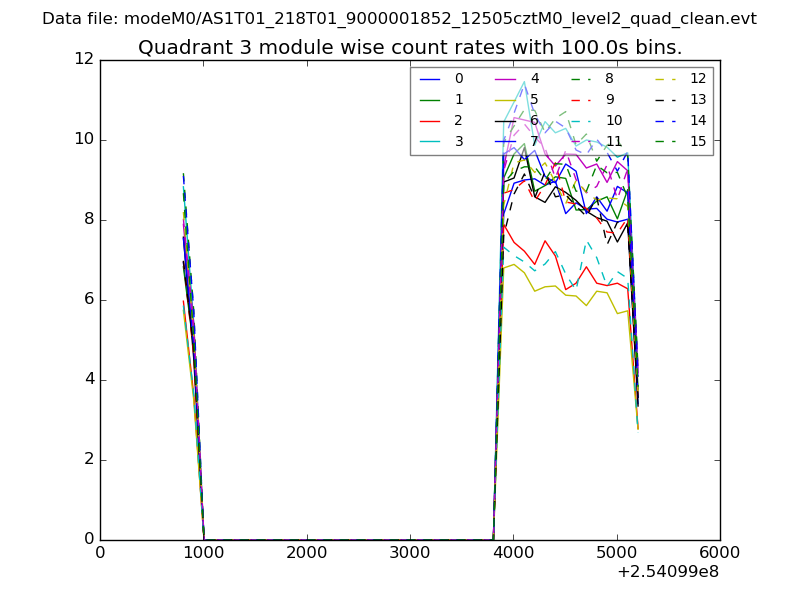 |
 |
| Parameter | Plot |
|---|---|
| CZT HV Monitor | 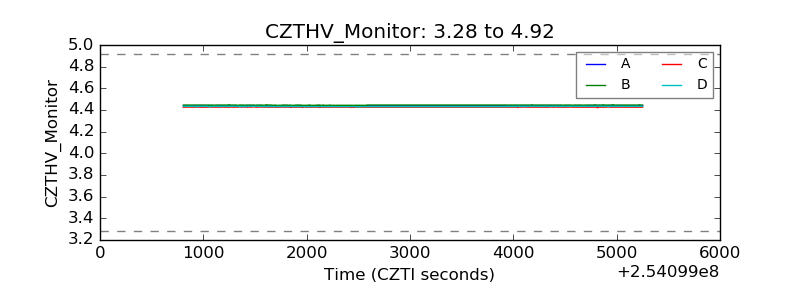 |
| D_VDD | 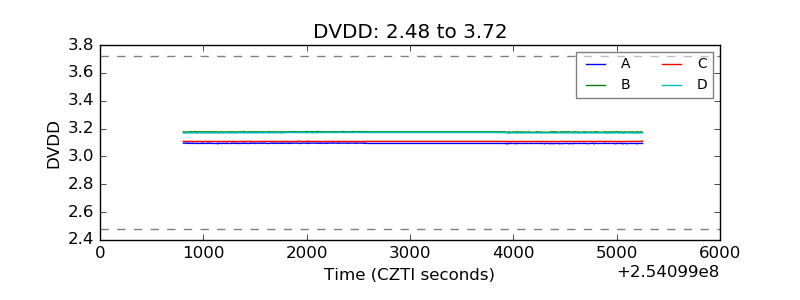 |
| Temperature 1 | 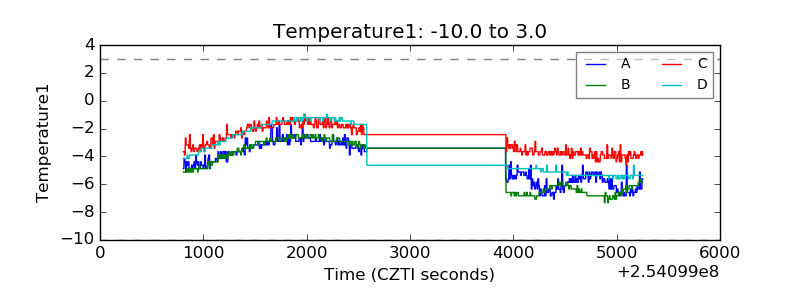 |
| Veto HV Monitor | 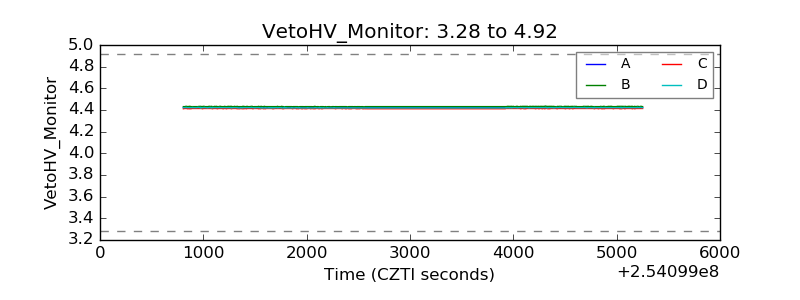 |
| Veto LLD | 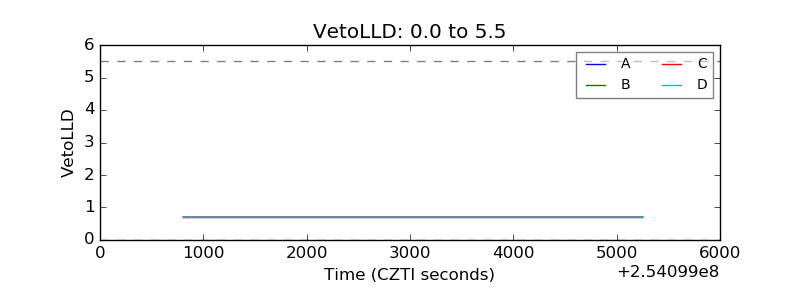 |
| Alpha Counter | 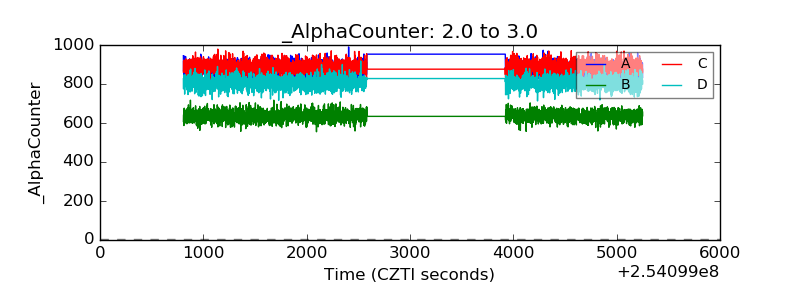 |
| _CPM_Rate | 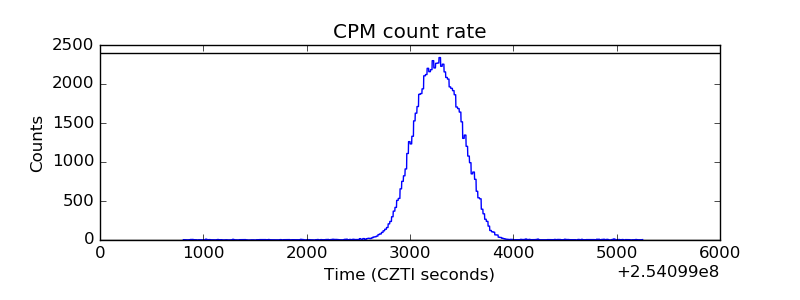 |
| CZT Counter | 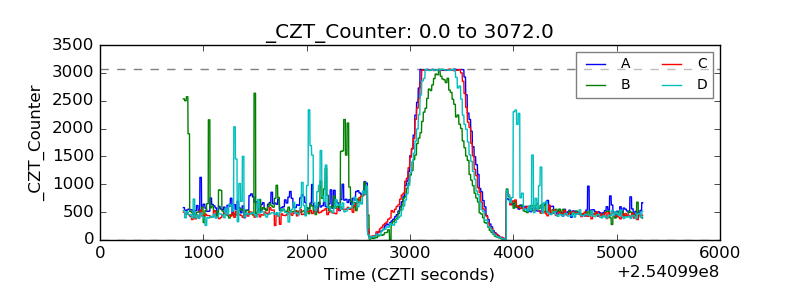 |
| +2.5 Volts monitor |  |
| +5 Volts monitor | 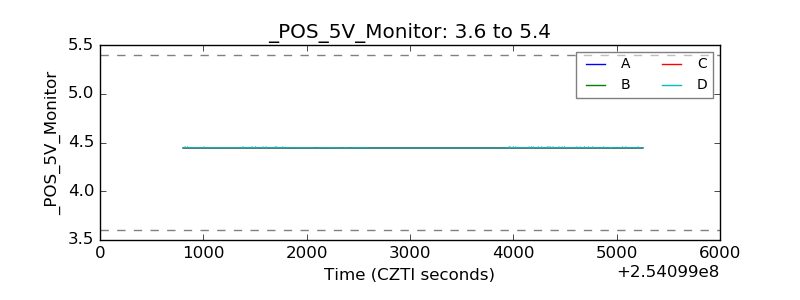 |
| _ROLL_ROT | 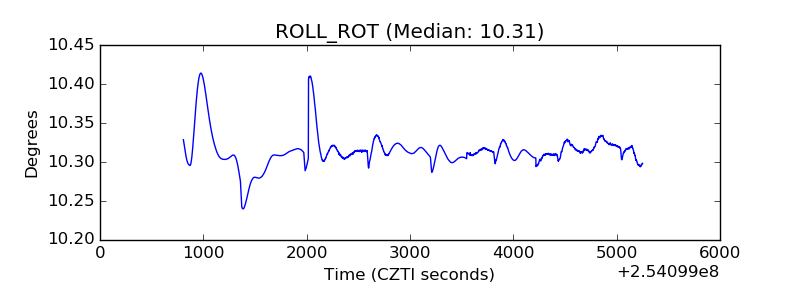 |
| _Roll_DEC | 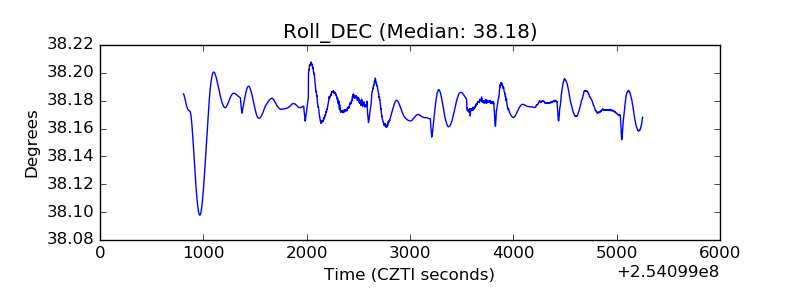 |
| _Roll_RA | 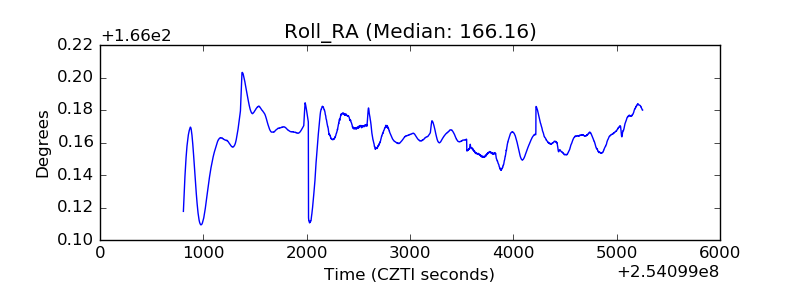 |
| Veto Counter | 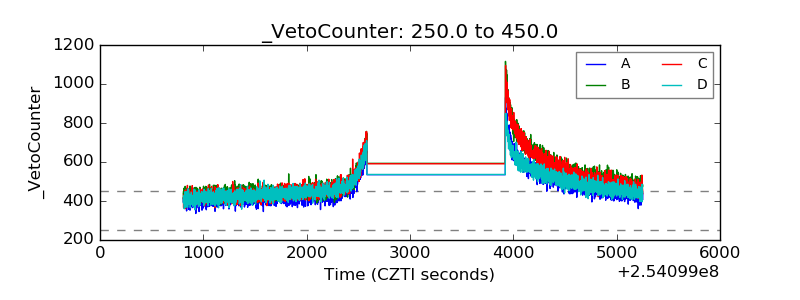 |