| Param | Original file | Final file |
|---|---|---|
| Filename | modeM0/AS1T01_218T01_9000001852_12506cztM0_level2.evt | modeM0/AS1T01_218T01_9000001852_12506cztM0_level2_quad_clean.evt |
| Size (bytes) | 464,382,720 | 97,053,120 |
| Size | 442.9 MB | 92.6 MB |
| Events in quadrant A | 3,428,930 | 625,039 |
| Events in quadrant B | 3,592,168 | 646,839 |
| Events in quadrant C | 3,108,157 | 623,888 |
| Events in quadrant D | 3,490,155 | 587,324 |
| Mode M0 | |||
|---|---|---|---|
| Quadrant | BADHDUFLAG | Total packets | Discarded packets |
| A | 0 | 14303 | 3 |
| B | 0 | 14874 | 2 |
| C | 0 | 13660 | 2 |
| D | 0 | 14937 | 2 |
| Mode SS | |||
|---|---|---|---|
| Quadrant | BADHDUFLAG | Total packets | Discarded packets |
| A | 0 | 134 | 0 |
| B | 0 | 134 | 0 |
| C | 0 | 134 | 0 |
| D | 0 | 134 | 0 |
| Mode M9 | |||
|---|---|---|---|
| Quadrant | BADHDUFLAG | Total packets | Discarded packets |
| A | 0 | 20 | 0 |
| B | 0 | 20 | 0 |
| C | 0 | 20 | 0 |
| D | 0 | 21 | 0 |
| Quadrant | Total seconds | Saturated seconds | Saturation percentage |
|---|---|---|---|
| A | 6538 | 42 | 0.642398% |
| B | 6538 | 130 | 1.988376% |
| C | 6538 | 27 | 0.412970% |
| D | 6538 | 90 | 1.376568% |
Noise dominated data is calculated using 1-second bins in cleaned event files. If a bin has >2000 counts, and if more than 50% of those come from <1% of pixels, then it is considered to be noise-dominated and hence unusable.
| Quadrant | # 1 sec bins | Bins with >0 counts | Bins with >2000 counts | High rate bins dominated by noise | Noise dominated (total time) | Noise dominated (detector-on time) | Marked lightcurve |
|---|---|---|---|---|---|---|---|
| A | 7889 | 6540 | 1 | 1 | 0.01% | 0.02% | 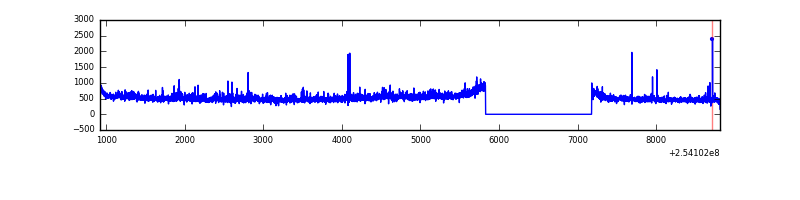 |
| B | 7889 | 6540 | 50 | 50 | 0.63% | 0.76% | 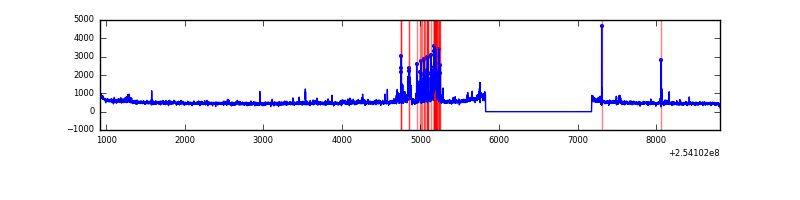 |
| C | 7889 | 6540 | 9 | 9 | 0.11% | 0.14% | 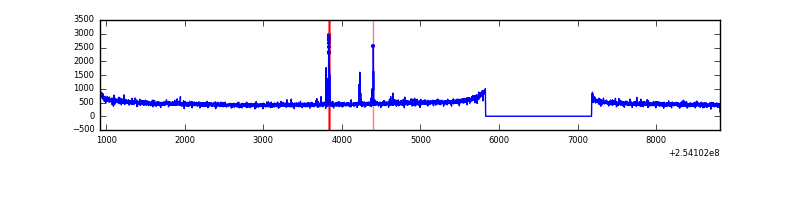 |
| D | 7889 | 6540 | 71 | 71 | 0.90% | 1.09% | 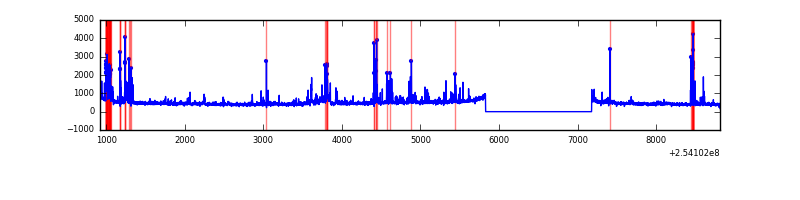 |
Top three noisy pixels from each quadrant. If the there are fewer than three noisy pixels in the level2.evt file, extra rows are filled as -1
| Pixel properties | Quadrant properties | ||||||
|---|---|---|---|---|---|---|---|
| Quadrant | DetID | PixID | Counts | Sigma | Mean | Median | Sigma |
| A | 1 | 162 | 107117 | 650.34 | 808 | 792 | 163.5 |
| A | 1 | 178 | 62138 | 375.23 | 808 | 792 | 163.5 |
| A | 1 | 161 | 52526 | 316.43 | 808 | 792 | 163.5 |
| B | 4 | 239 | 326898 | 2133.12 | 810 | 792 | 152.9 |
| B | 0 | 214 | 46296 | 297.65 | 810 | 792 | 152.9 |
| B | 12 | 111 | 16718 | 104.17 | 810 | 792 | 152.9 |
| C | 14 | 234 | 55754 | 306.57 | 782 | 786 | 179.3 |
| C | 13 | 61 | 5892 | 28.48 | 782 | 786 | 179.3 |
| C | 14 | 67 | 3537 | 15.34 | 782 | 786 | 179.3 |
| D | 1 | 52 | 417730 | 2280.02 | 769 | 749 | 182.9 |
| D | 13 | 104 | 65747 | 355.4 | 769 | 749 | 182.9 |
| D | 8 | 195 | 23626 | 125.09 | 769 | 749 | 182.9 |
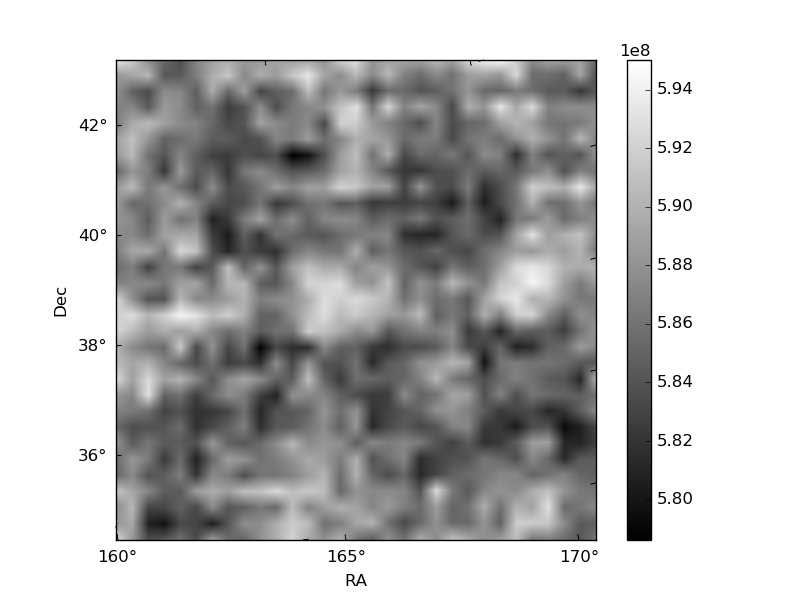
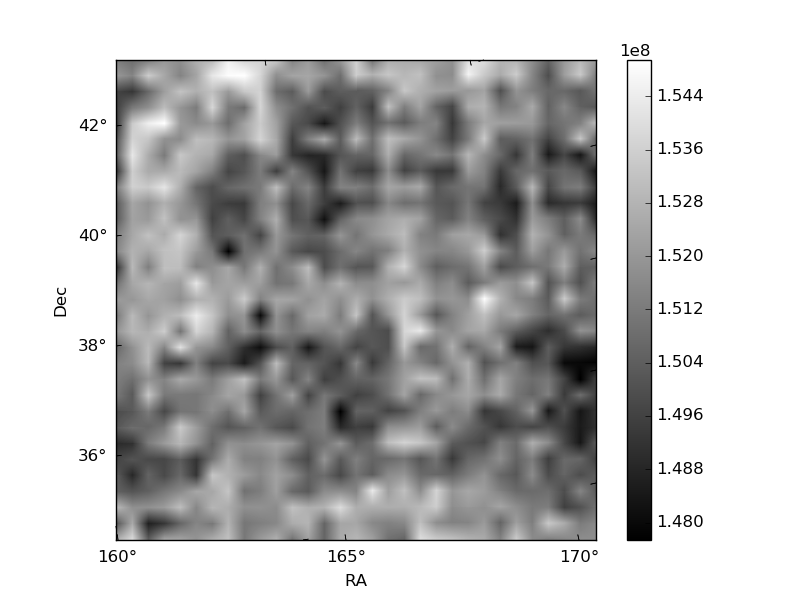
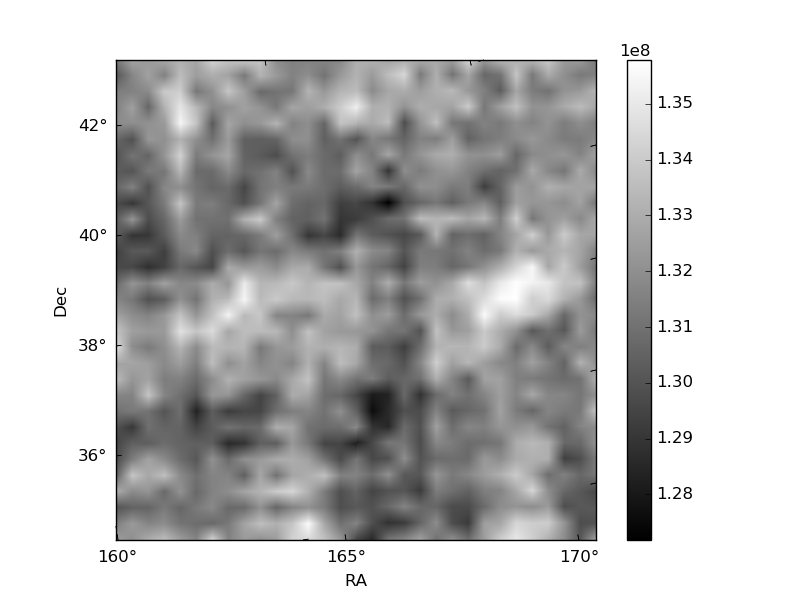
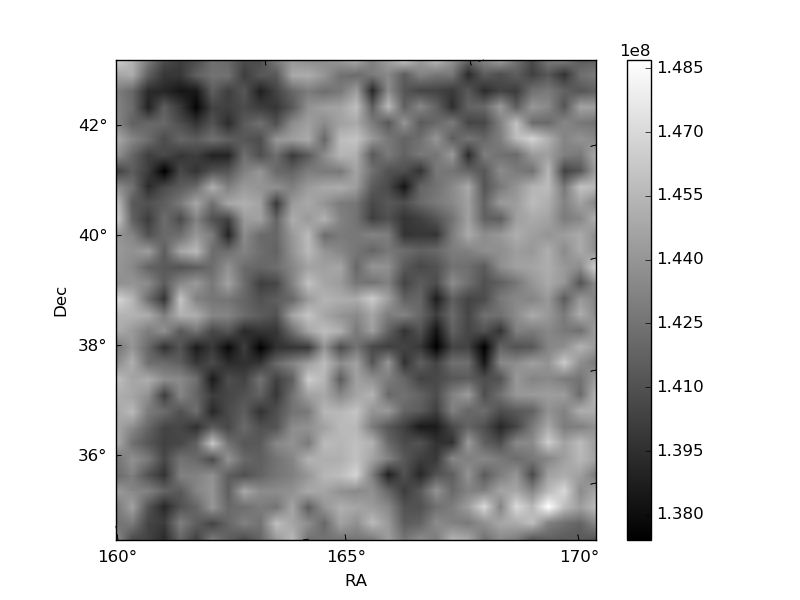
Histogram calculated using DETX and DETY for each event in the final _common_clean file
| Quadrant A | 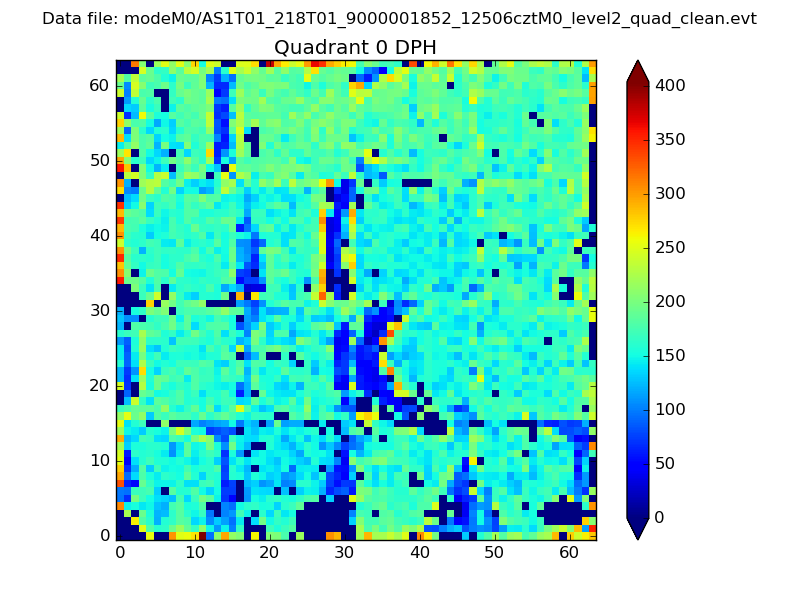 |
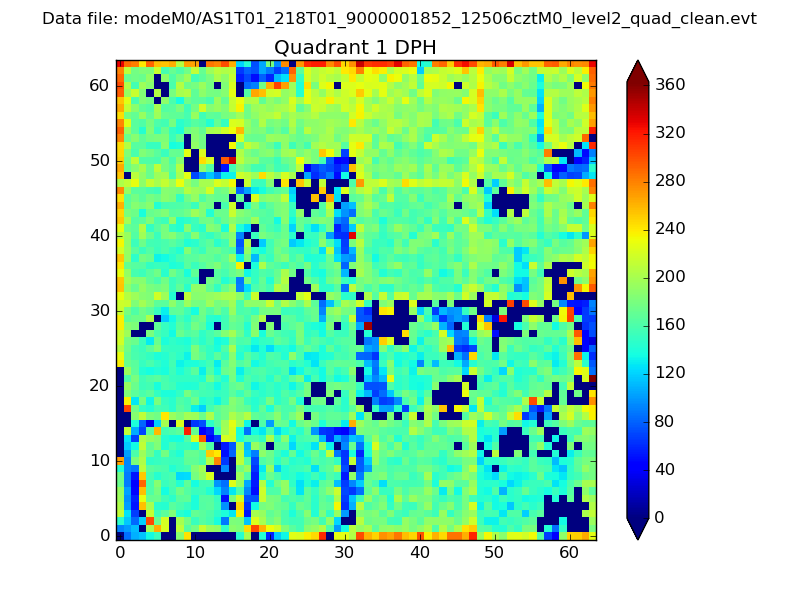 |
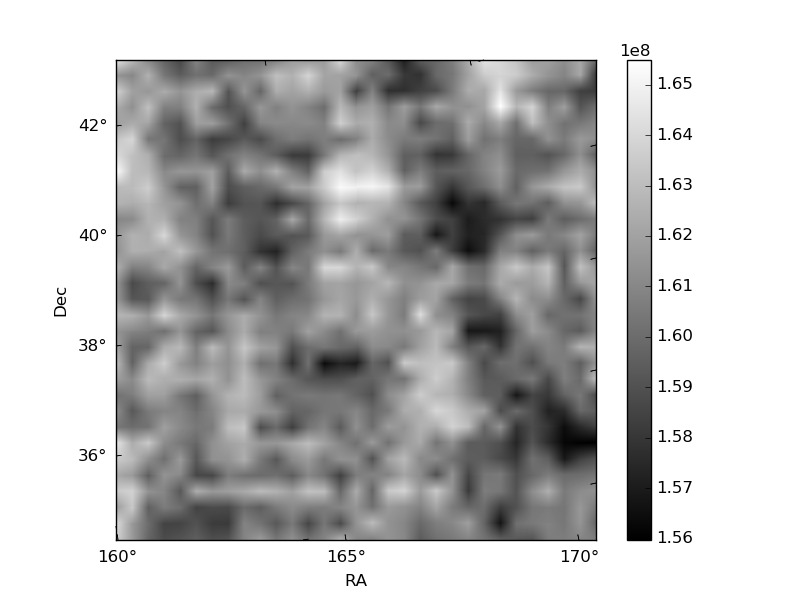
Quadrant B |
|---|---|---|---|
| Quadrant D | 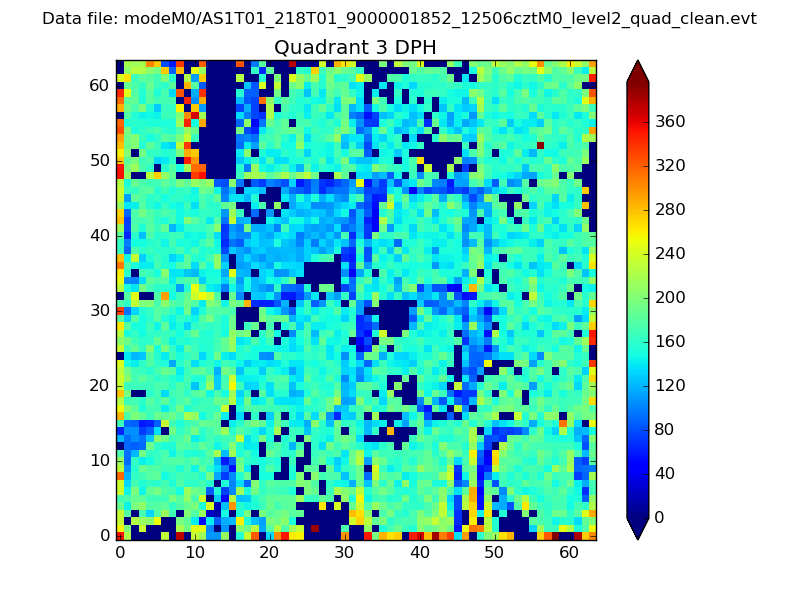 |
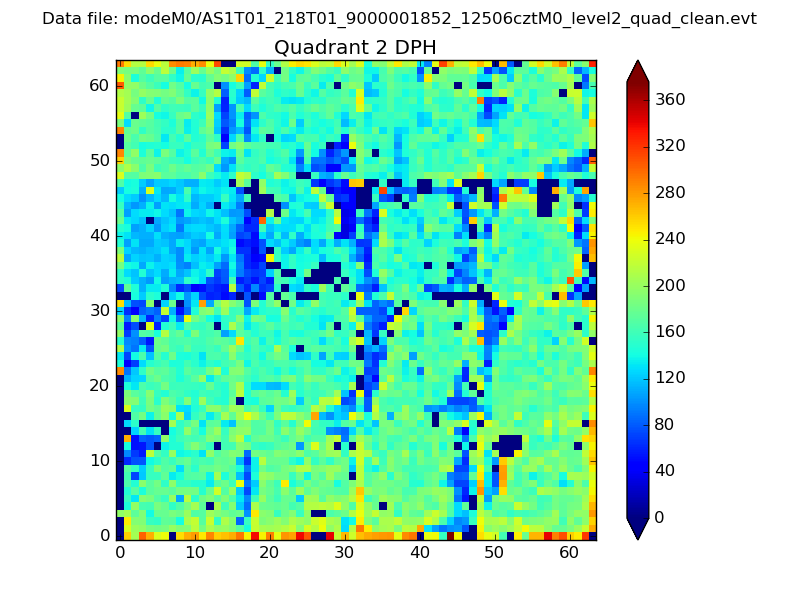 |
Quadrant C |
| Plot type | Count rate plots | Images |
|---|---|---|
| Comparison with Poisson distribution Blue bars denote a histogram of data divided into 1 sec bins. Red curve is a Poisson curve with rate = median count rate of data. |
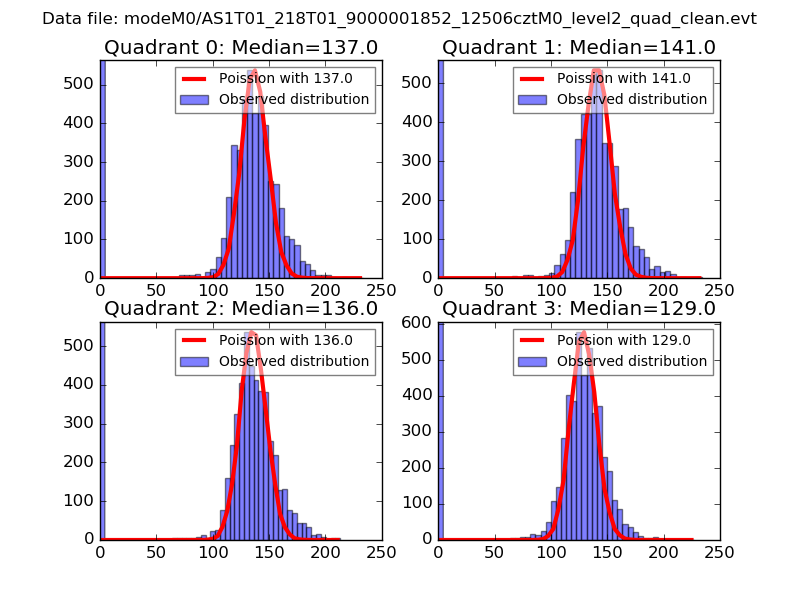 |
 |
| Quadrant-wise count rates Data is divided into 100 sec bins |
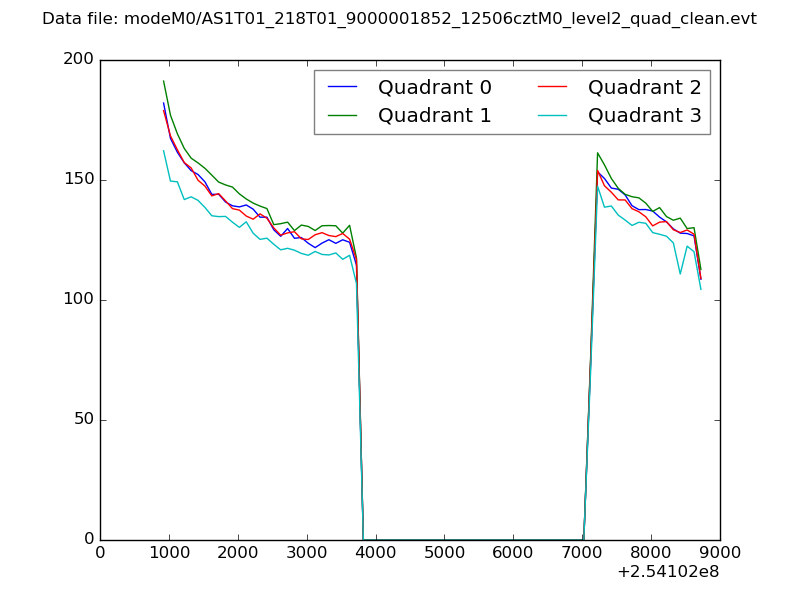 |
|
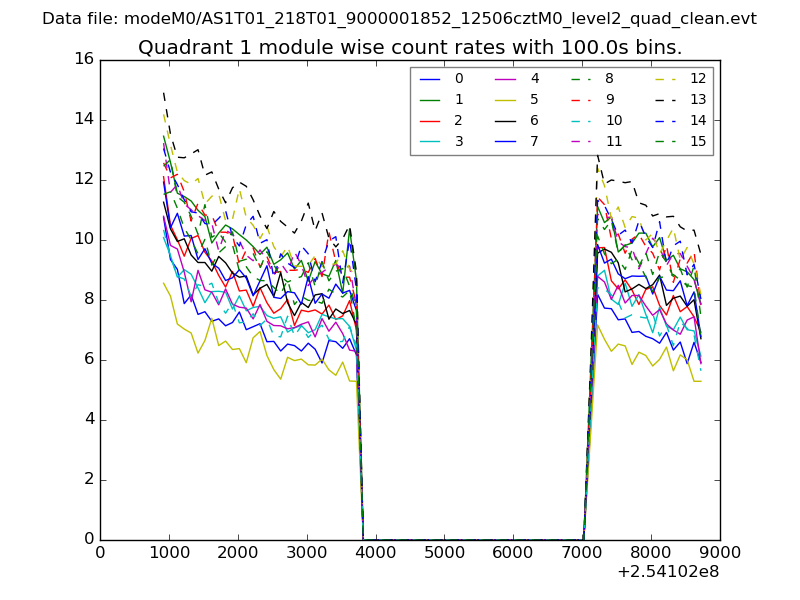
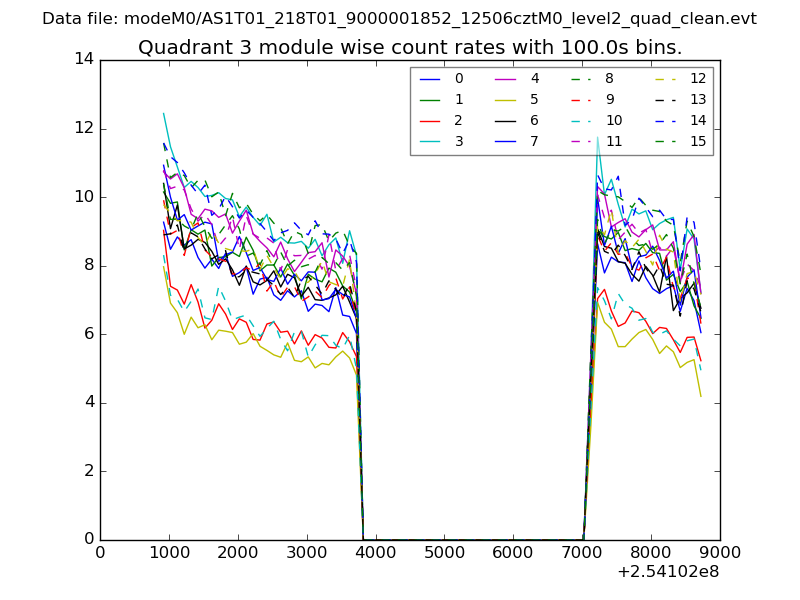
| Module-wise count rates for Quadrant A Data is divided into 100 sec bins |
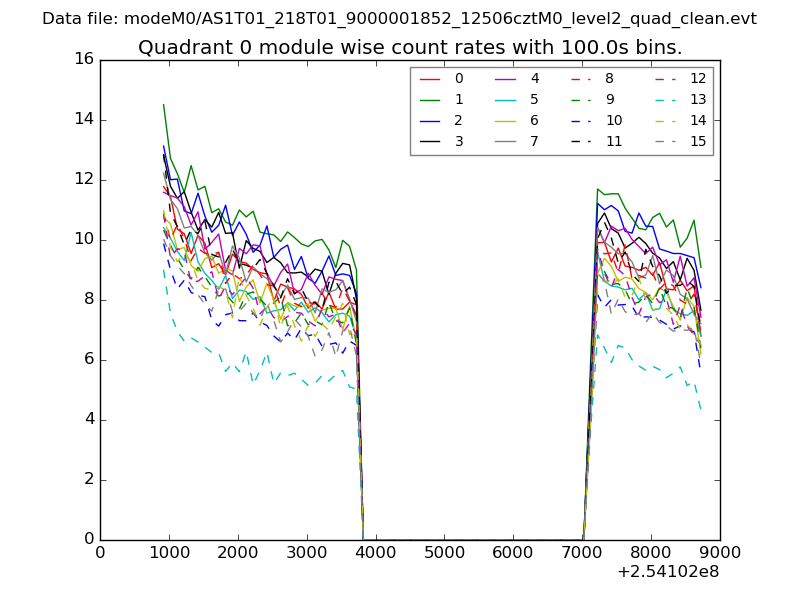 |
 |
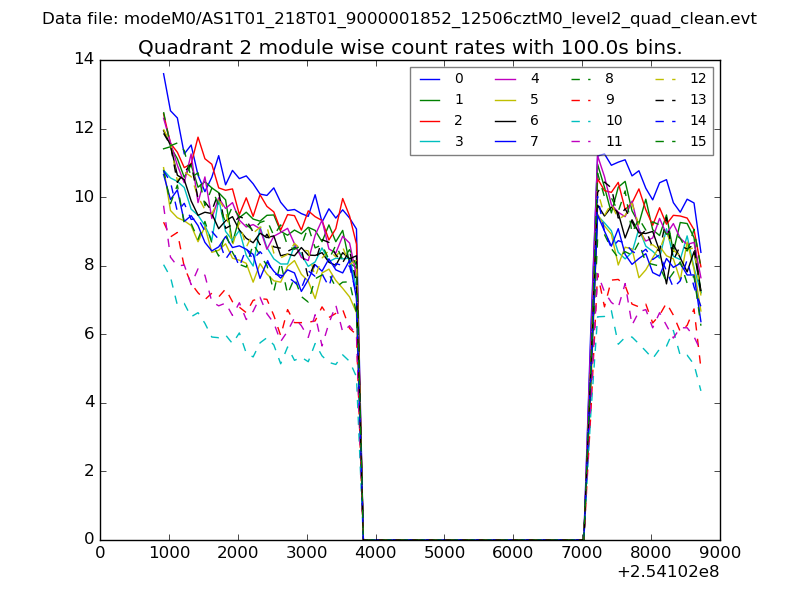
| Module-wise count rates for Quadrant B Data is divided into 100 sec bins |
 |
 |
| Module-wise count rates for Quadrant C Data is divided into 100 sec bins |
 |
 |
| Module-wise count rates for Quadrant D Data is divided into 100 sec bins |
 |
 |
| Parameter | Plot |
|---|---|
| CZT HV Monitor | 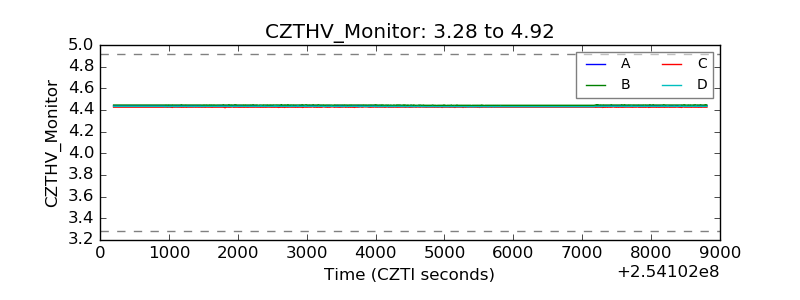 |
| D_VDD | 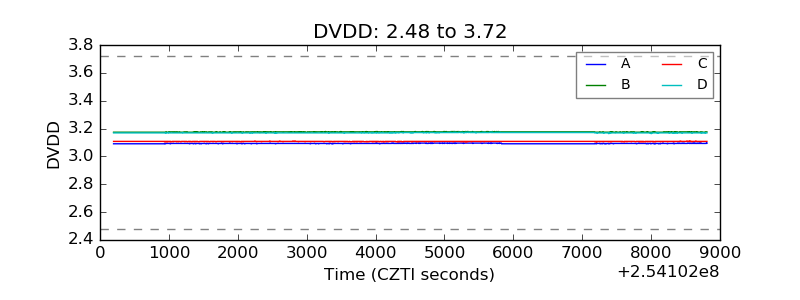 |
| Temperature 1 | 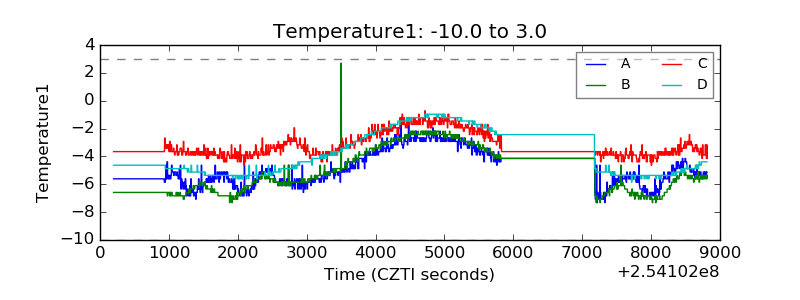 |
| Veto HV Monitor | 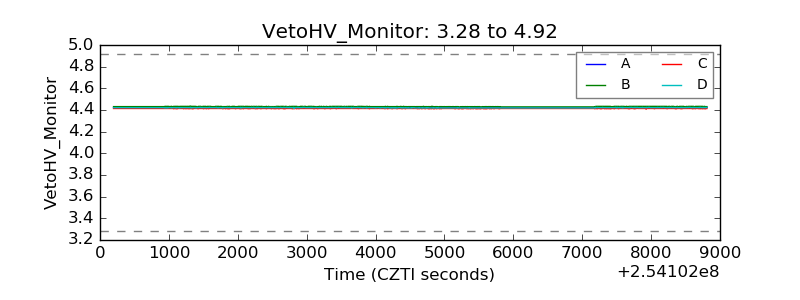 |
| Veto LLD | 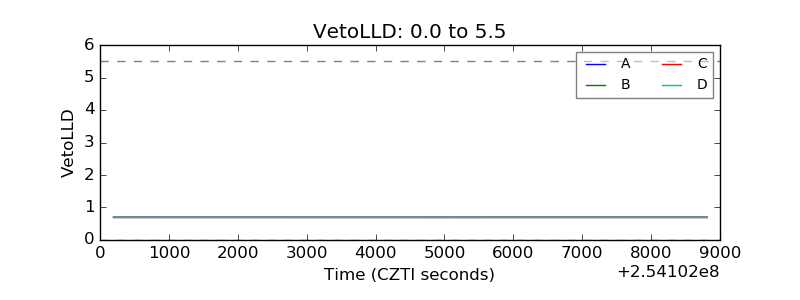 |
| Alpha Counter | 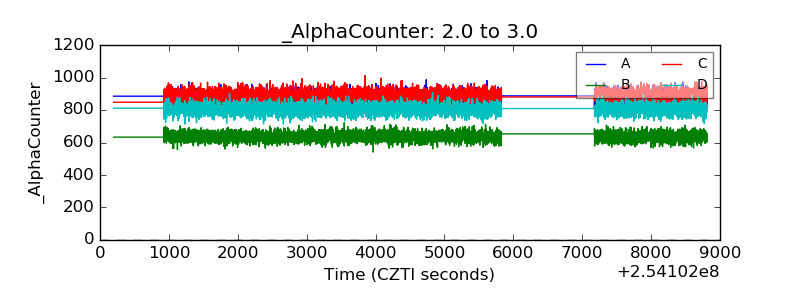 |
| _CPM_Rate | 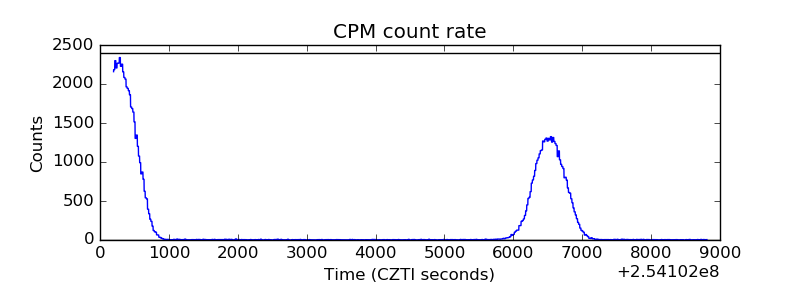 |
| CZT Counter |  |
| +2.5 Volts monitor |  |
| +5 Volts monitor |  |
| _ROLL_ROT | 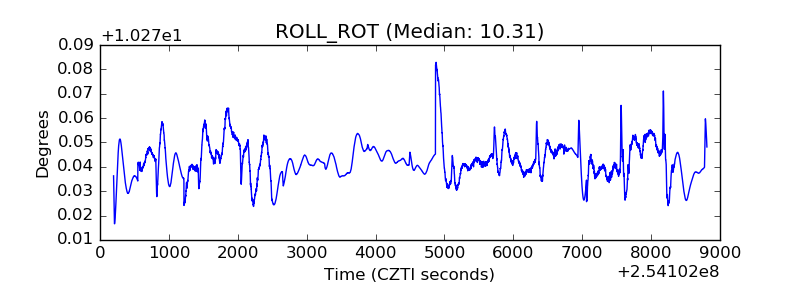 |
| _Roll_DEC | 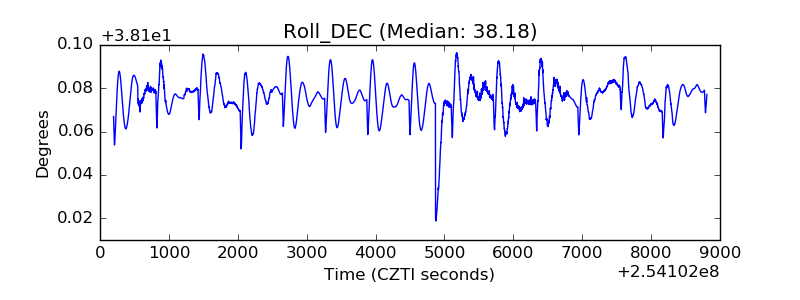 |
| _Roll_RA | 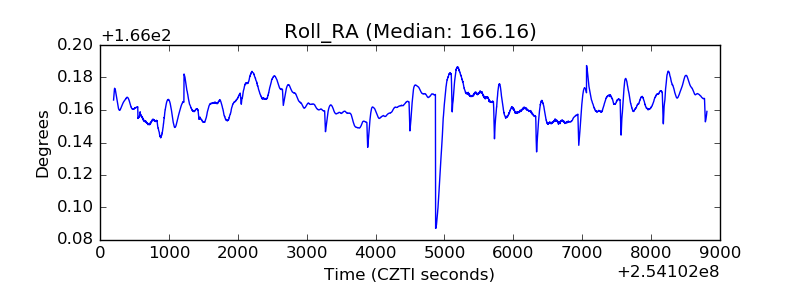 |
| Veto Counter | 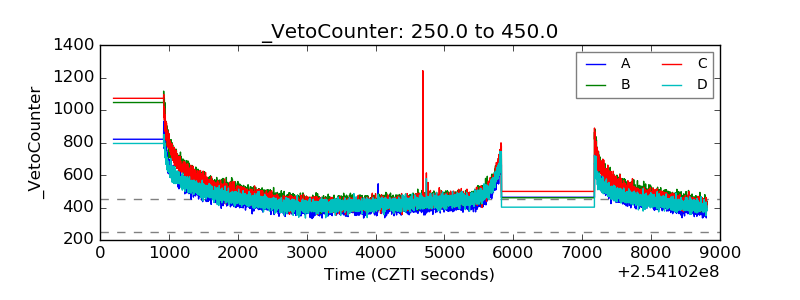 |