| Param | Original file | Final file |
|---|---|---|
| Filename | modeM0/AS1T01_218T01_9000001852_12507cztM0_level2.evt | modeM0/AS1T01_218T01_9000001852_12507cztM0_level2_quad_clean.evt |
| Size (bytes) | 456,045,120 | 94,613,760 |
| Size | 434.9 MB | 90.2 MB |
| Events in quadrant A | 3,310,455 | 603,346 |
| Events in quadrant B | 3,432,812 | 620,129 |
| Events in quadrant C | 3,096,243 | 602,779 |
| Events in quadrant D | 3,516,307 | 571,970 |
| Mode M0 | |||
|---|---|---|---|
| Quadrant | BADHDUFLAG | Total packets | Discarded packets |
| A | 0 | 14135 | 3 |
| B | 0 | 14582 | 2 |
| C | 0 | 13853 | 2 |
| D | 0 | 15221 | 2 |
| Mode SS | |||
|---|---|---|---|
| Quadrant | BADHDUFLAG | Total packets | Discarded packets |
| A | 0 | 138 | 0 |
| B | 0 | 138 | 0 |
| C | 0 | 138 | 0 |
| D | 0 | 138 | 0 |
| Mode M9 | |||
|---|---|---|---|
| Quadrant | BADHDUFLAG | Total packets | Discarded packets |
| A | 0 | 18 | 0 |
| B | 0 | 18 | 0 |
| C | 0 | 18 | 0 |
| D | 0 | 19 | 0 |
| Quadrant | Total seconds | Saturated seconds | Saturation percentage |
|---|---|---|---|
| A | 6695 | 83 | 1.239731% |
| B | 6695 | 129 | 1.926811% |
| C | 6695 | 26 | 0.388350% |
| D | 6695 | 66 | 0.985810% |
Noise dominated data is calculated using 1-second bins in cleaned event files. If a bin has >2000 counts, and if more than 50% of those come from <1% of pixels, then it is considered to be noise-dominated and hence unusable.
| Quadrant | # 1 sec bins | Bins with >0 counts | Bins with >2000 counts | High rate bins dominated by noise | Noise dominated (total time) | Noise dominated (detector-on time) | Marked lightcurve |
|---|---|---|---|---|---|---|---|
| A | 7821 | 6697 | 1 | 1 | 0.01% | 0.01% | 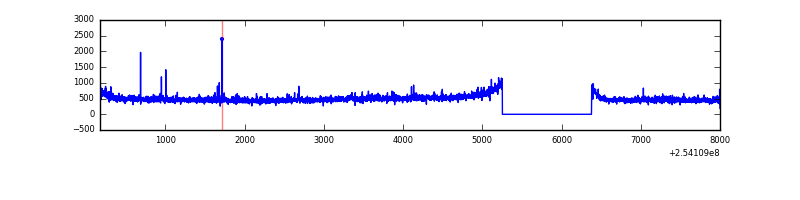 |
| B | 7821 | 6697 | 16 | 16 | 0.20% | 0.24% | 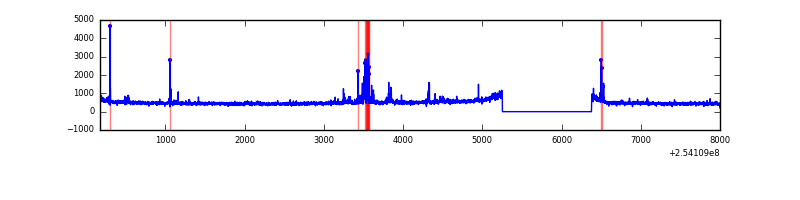 |
| C | 7821 | 6697 | 0 | 0 | 0.00% | 0.00% | 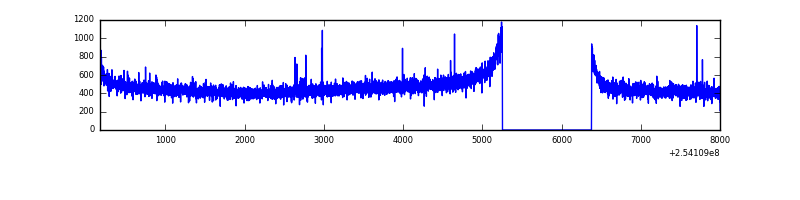 |
| D | 7821 | 6697 | 49 | 49 | 0.63% | 0.73% | 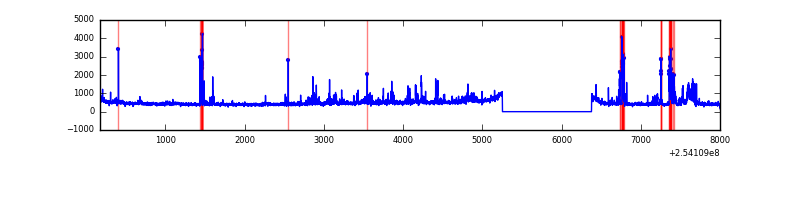 |
Top three noisy pixels from each quadrant. If the there are fewer than three noisy pixels in the level2.evt file, extra rows are filled as -1
| Pixel properties | Quadrant properties | ||||||
|---|---|---|---|---|---|---|---|
| Quadrant | DetID | PixID | Counts | Sigma | Mean | Median | Sigma |
| A | 1 | 162 | 53490 | 317.97 | 818 | 799 | 165.7 |
| A | 1 | 178 | 30499 | 179.23 | 818 | 799 | 165.7 |
| A | 12 | 189 | 28493 | 167.12 | 818 | 799 | 165.7 |
| B | 4 | 239 | 151532 | 965.35 | 819 | 799 | 156.1 |
| B | 0 | 214 | 24409 | 151.21 | 819 | 799 | 156.1 |
| B | 3 | 64 | 19382 | 119.01 | 819 | 799 | 156.1 |
| C | 3 | 233 | 9726 | 48.86 | 790 | 795 | 182.8 |
| C | 14 | 234 | 9498 | 47.61 | 790 | 795 | 182.8 |
| C | 13 | 61 | 5937 | 28.13 | 790 | 795 | 182.8 |
| D | 1 | 52 | 210337 | 1132.76 | 779 | 758 | 185.0 |
| D | 13 | 104 | 138781 | 746.01 | 779 | 758 | 185.0 |
| D | 1 | 255 | 134850 | 724.76 | 779 | 758 | 185.0 |
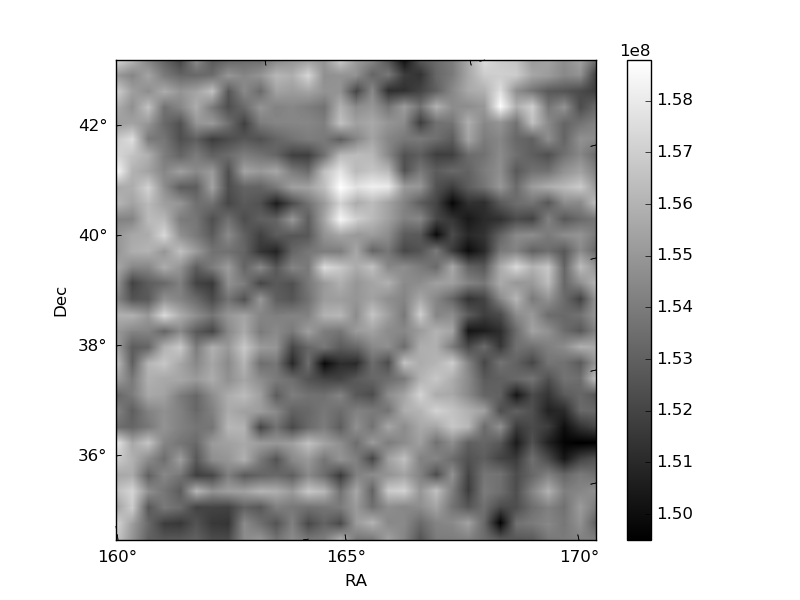
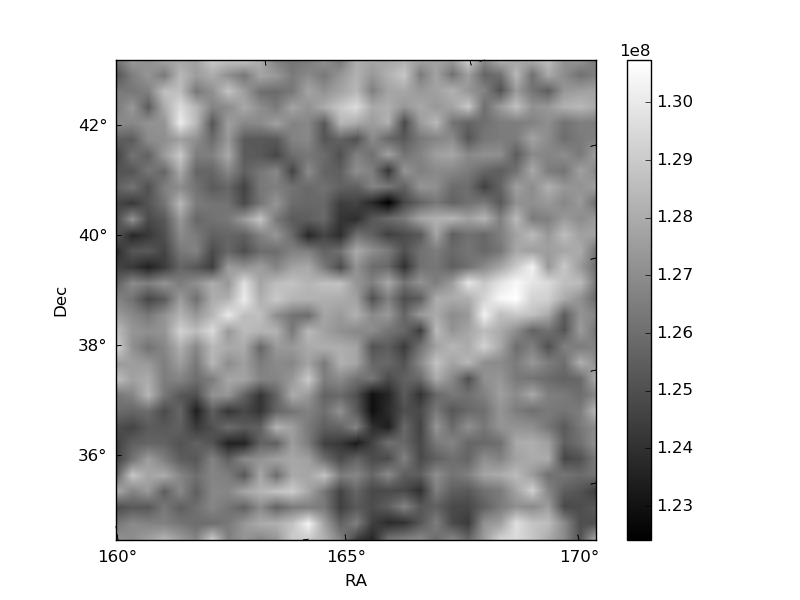
Histogram calculated using DETX and DETY for each event in the final _common_clean file
| Quadrant A | 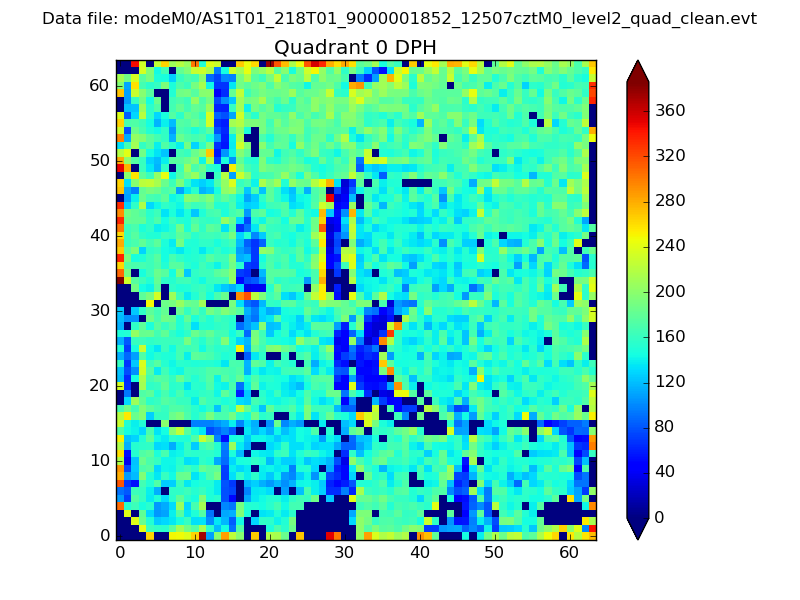 |
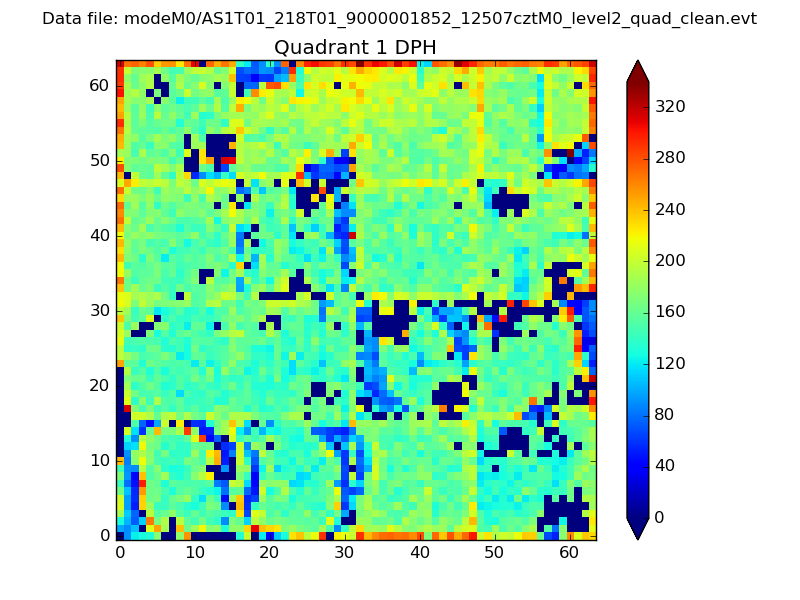 |
Quadrant B |
|---|---|---|---|
| Quadrant D | 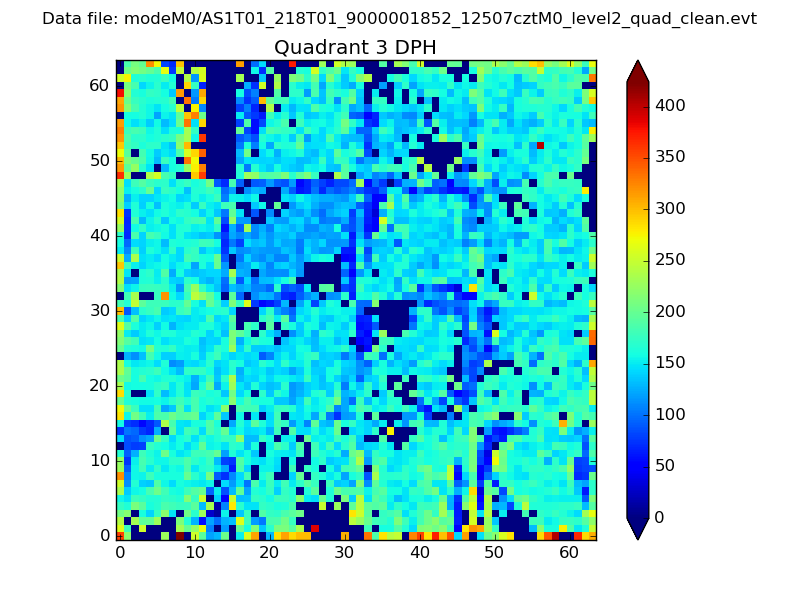 |
 |
Quadrant C |
| Plot type | Count rate plots | Images |
|---|---|---|
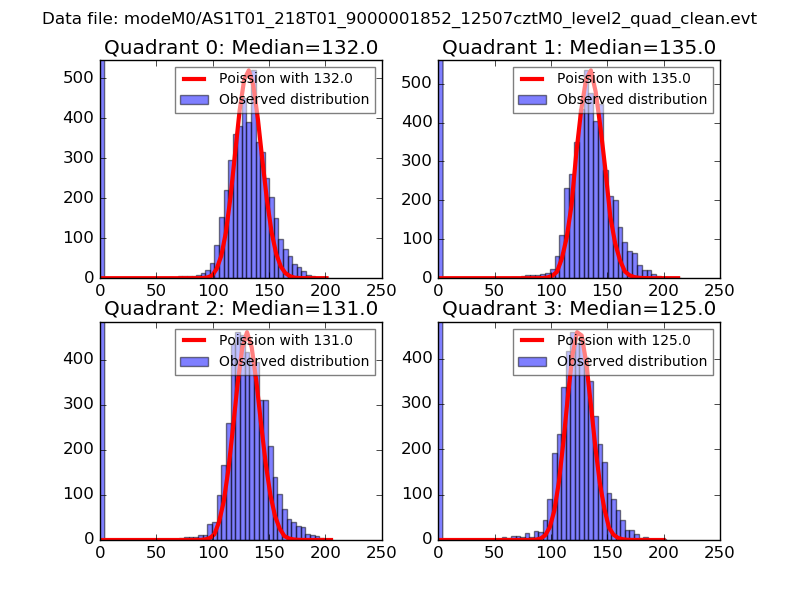
| Comparison with Poisson distribution Blue bars denote a histogram of data divided into 1 sec bins. Red curve is a Poisson curve with rate = median count rate of data. |
 |
 |
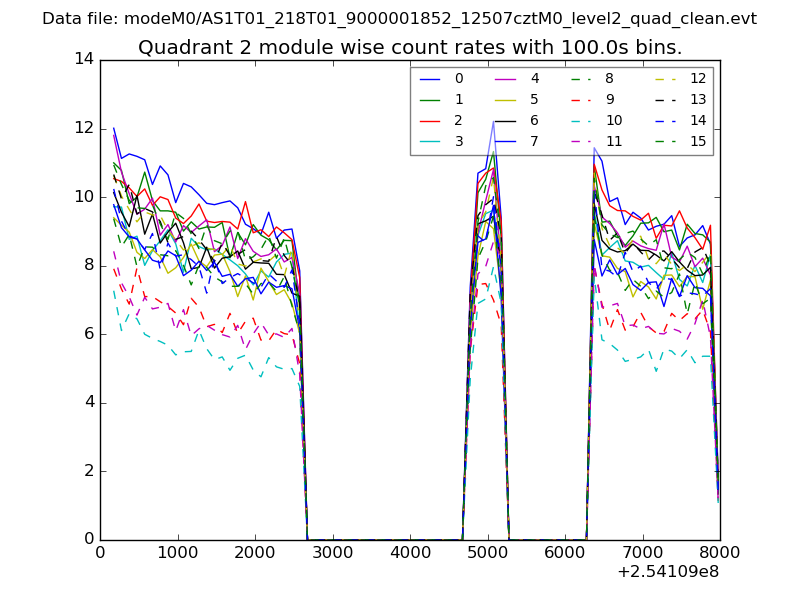
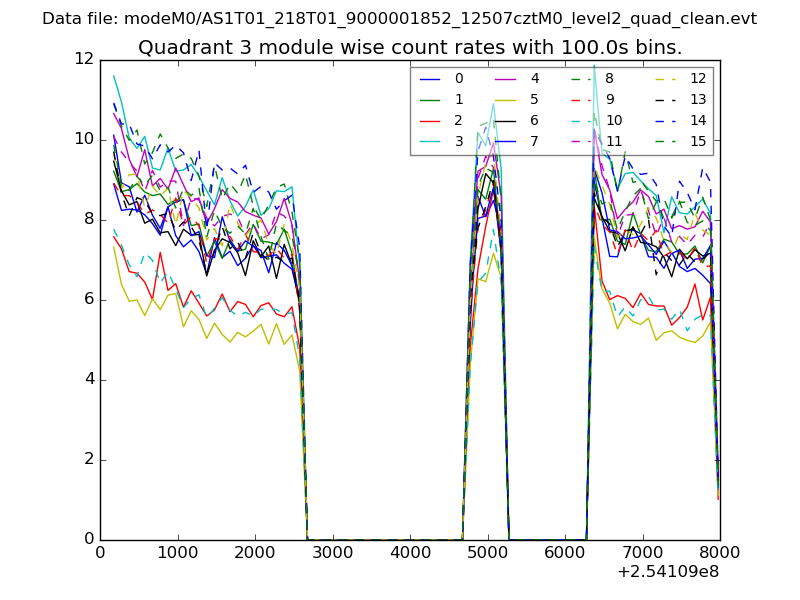
| Quadrant-wise count rates Data is divided into 100 sec bins |
 |
|
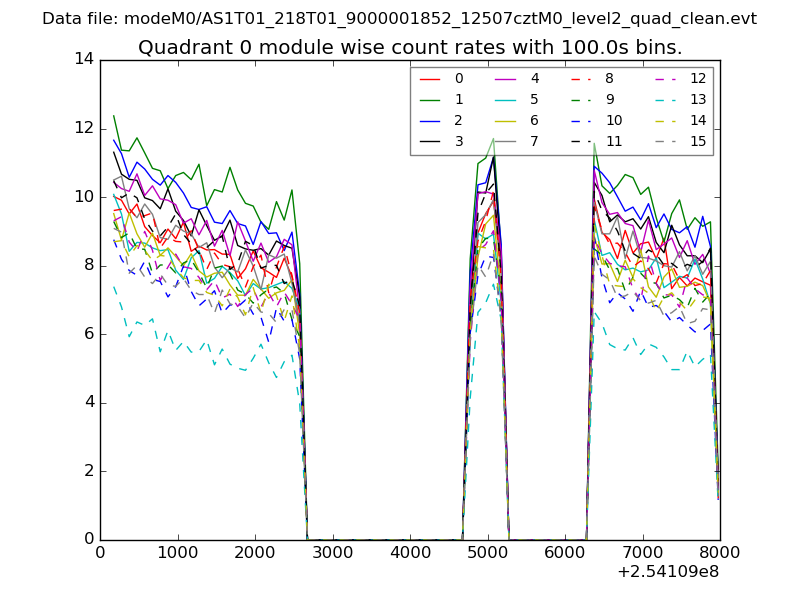
| Module-wise count rates for Quadrant A Data is divided into 100 sec bins |
 |
 |
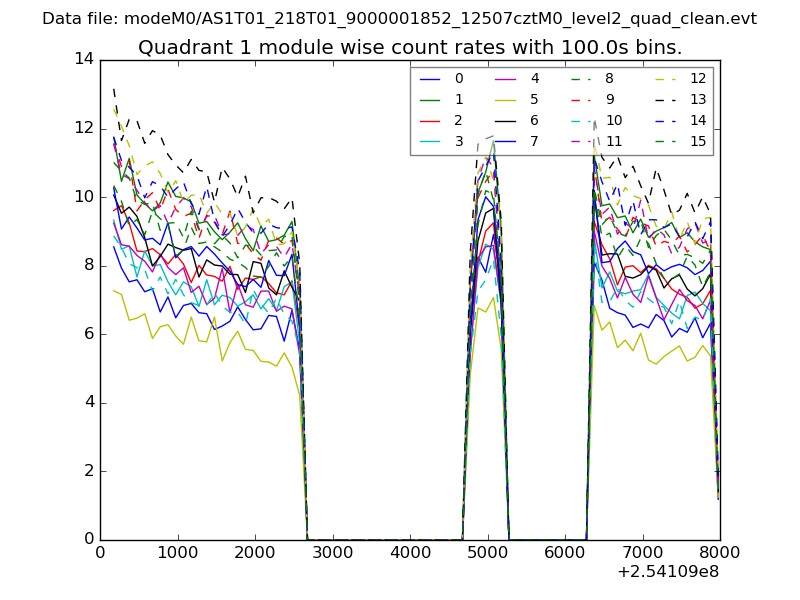
| Module-wise count rates for Quadrant B Data is divided into 100 sec bins |
 |
 |
| Module-wise count rates for Quadrant C Data is divided into 100 sec bins |
 |
 |
| Module-wise count rates for Quadrant D Data is divided into 100 sec bins |
 |
 |
| Parameter | Plot |
|---|---|
| CZT HV Monitor | 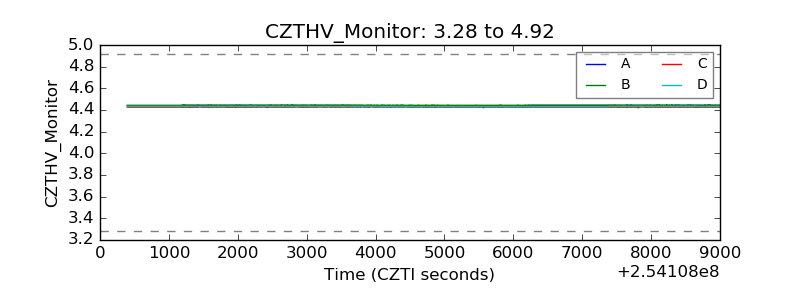 |
| D_VDD | 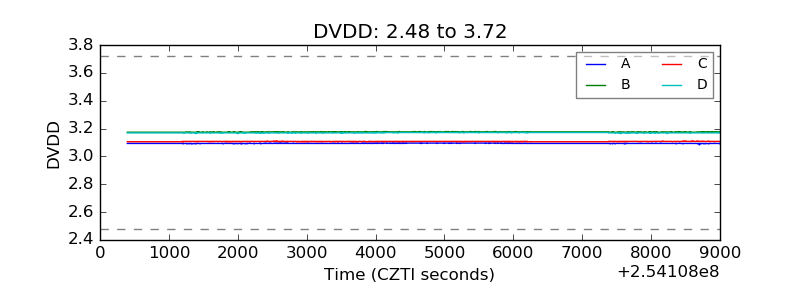 |
| Temperature 1 | 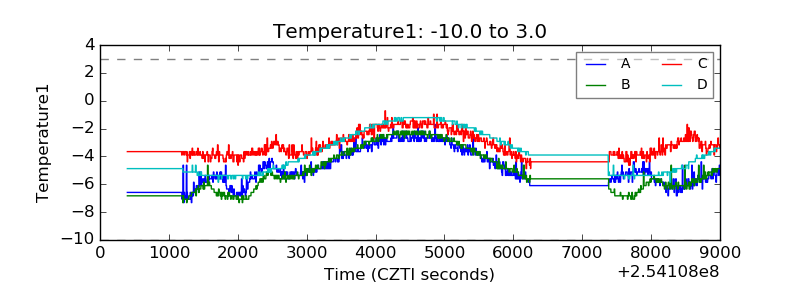 |
| Veto HV Monitor |  |
| Veto LLD | 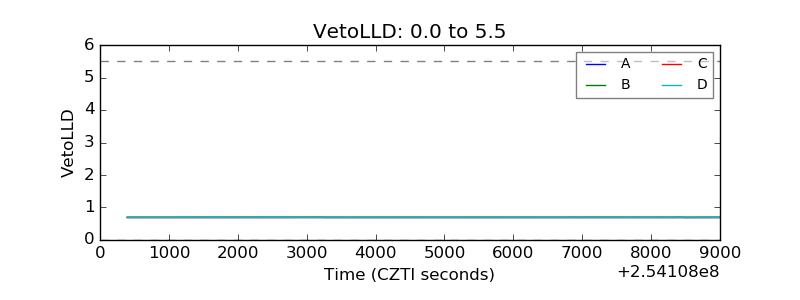 |
| Alpha Counter | 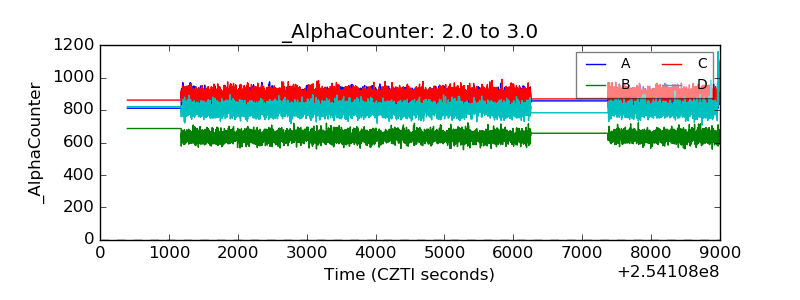 |
| _CPM_Rate |  |
| CZT Counter | 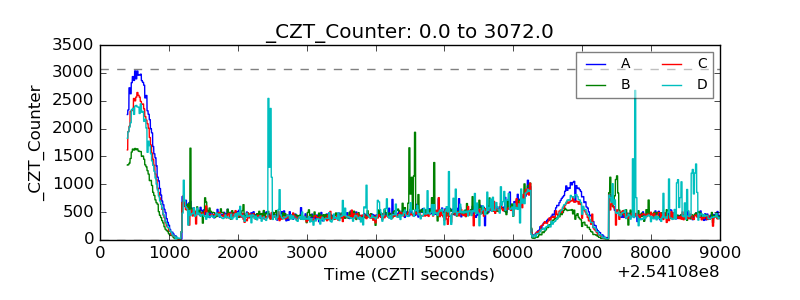 |
| +2.5 Volts monitor |  |
| +5 Volts monitor | 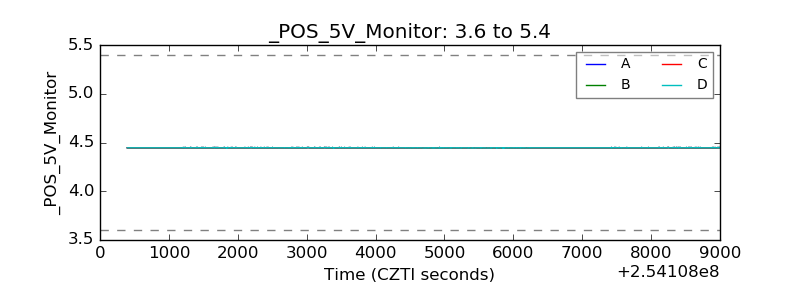 |
| _ROLL_ROT | 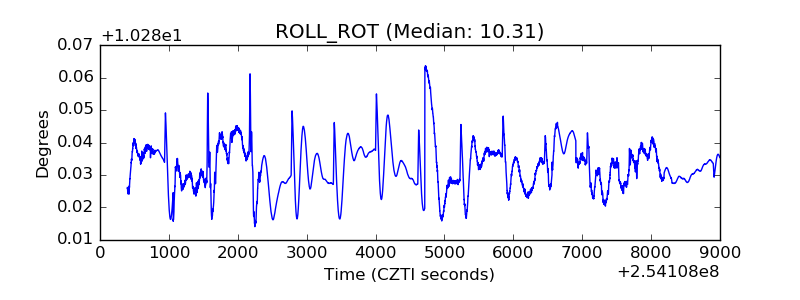 |
| _Roll_DEC | 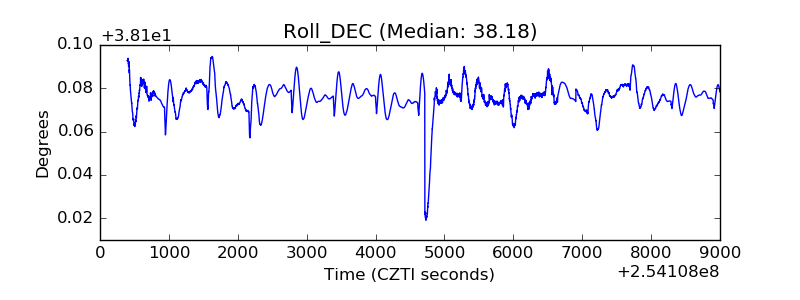 |
| _Roll_RA | 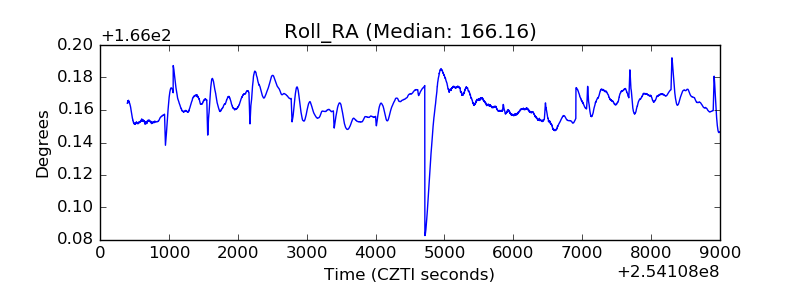 |
| Veto Counter | 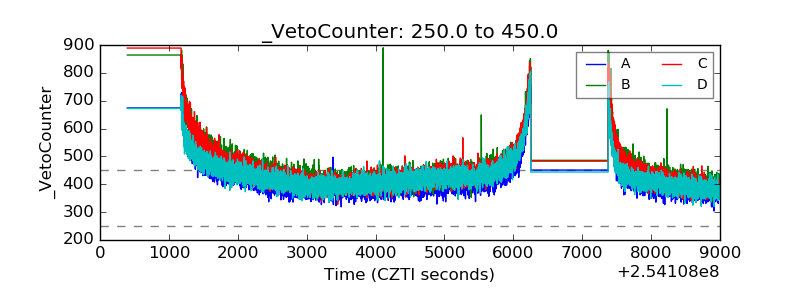 |