| Param | Original file | Final file |
|---|---|---|
| Filename | modeM0/AS1T01_218T01_9000001852_12508cztM0_level2.evt | modeM0/AS1T01_218T01_9000001852_12508cztM0_level2_quad_clean.evt |
| Size (bytes) | 485,786,880 | 99,011,520 |
| Size | 463.3 MB | 94.4 MB |
| Events in quadrant A | 3,411,458 | 629,195 |
| Events in quadrant B | 3,733,069 | 642,754 |
| Events in quadrant C | 3,200,301 | 631,110 |
| Events in quadrant D | 3,883,756 | 599,974 |
| Mode M0 | |||
|---|---|---|---|
| Quadrant | BADHDUFLAG | Total packets | Discarded packets |
| A | 0 | 14729 | 3 |
| B | 0 | 15744 | 2 |
| C | 0 | 14550 | 2 |
| D | 0 | 16509 | 2 |
| Mode SS | |||
|---|---|---|---|
| Quadrant | BADHDUFLAG | Total packets | Discarded packets |
| A | 0 | 146 | 0 |
| B | 0 | 146 | 0 |
| C | 0 | 146 | 0 |
| D | 0 | 146 | 0 |
| Mode M9 | |||
|---|---|---|---|
| Quadrant | BADHDUFLAG | Total packets | Discarded packets |
| A | 0 | 11 | 0 |
| B | 0 | 11 | 0 |
| C | 0 | 11 | 0 |
| D | 0 | 12 | 0 |
| Quadrant | Total seconds | Saturated seconds | Saturation percentage |
|---|---|---|---|
| A | 7109 | 106 | 1.491068% |
| B | 7109 | 143 | 2.011535% |
| C | 7109 | 44 | 0.618934% |
| D | 7109 | 136 | 1.913068% |
Noise dominated data is calculated using 1-second bins in cleaned event files. If a bin has >2000 counts, and if more than 50% of those come from <1% of pixels, then it is considered to be noise-dominated and hence unusable.
| Quadrant | # 1 sec bins | Bins with >0 counts | Bins with >2000 counts | High rate bins dominated by noise | Noise dominated (total time) | Noise dominated (detector-on time) | Marked lightcurve |
|---|---|---|---|---|---|---|---|
| A | 7900 | 7111 | 0 | 0 | 0.00% | 0.00% | 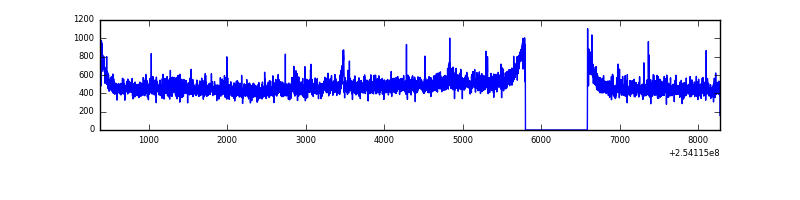 |
| B | 7900 | 7111 | 14 | 14 | 0.18% | 0.20% | 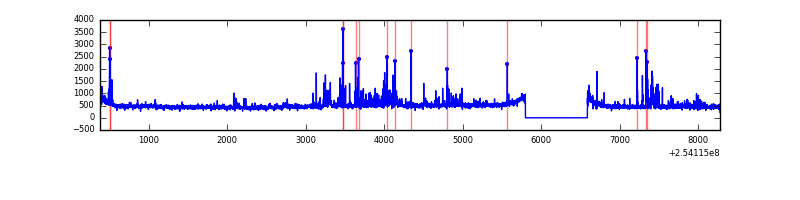 |
| C | 7900 | 7111 | 0 | 0 | 0.00% | 0.00% | 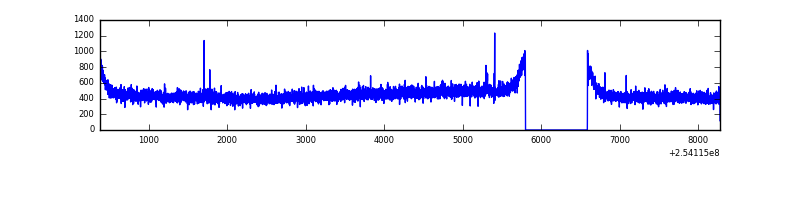 |
| D | 7900 | 7111 | 86 | 86 | 1.09% | 1.21% | 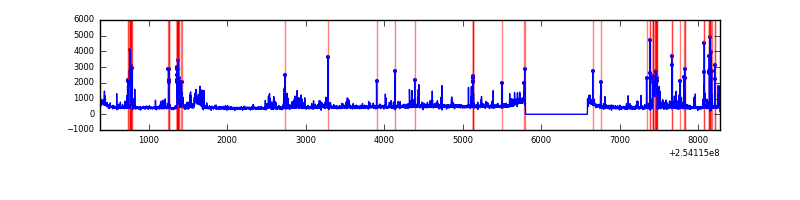 |
Top three noisy pixels from each quadrant. If the there are fewer than three noisy pixels in the level2.evt file, extra rows are filled as -1
| Pixel properties | Quadrant properties | ||||||
|---|---|---|---|---|---|---|---|
| Quadrant | DetID | PixID | Counts | Sigma | Mean | Median | Sigma |
| A | 12 | 189 | 45558 | 259.88 | 851 | 834 | 172.1 |
| A | 1 | 162 | 36801 | 208.99 | 851 | 834 | 172.1 |
| A | 1 | 178 | 20870 | 116.42 | 851 | 834 | 172.1 |
| B | 4 | 239 | 311501 | 1907.99 | 850 | 828 | 162.8 |
| B | 0 | 214 | 36524 | 219.23 | 850 | 828 | 162.8 |
| B | 3 | 64 | 33679 | 201.75 | 850 | 828 | 162.8 |
| C | 3 | 233 | 8292 | 39.26 | 818 | 822 | 190.3 |
| C | 13 | 61 | 6168 | 28.09 | 818 | 822 | 190.3 |
| C | 14 | 234 | 2844 | 10.63 | 818 | 822 | 190.3 |
| D | 1 | 52 | 461076 | 2373.02 | 814 | 789 | 194.0 |
| D | 1 | 255 | 132228 | 677.64 | 814 | 789 | 194.0 |
| D | 13 | 104 | 104776 | 536.11 | 814 | 789 | 194.0 |
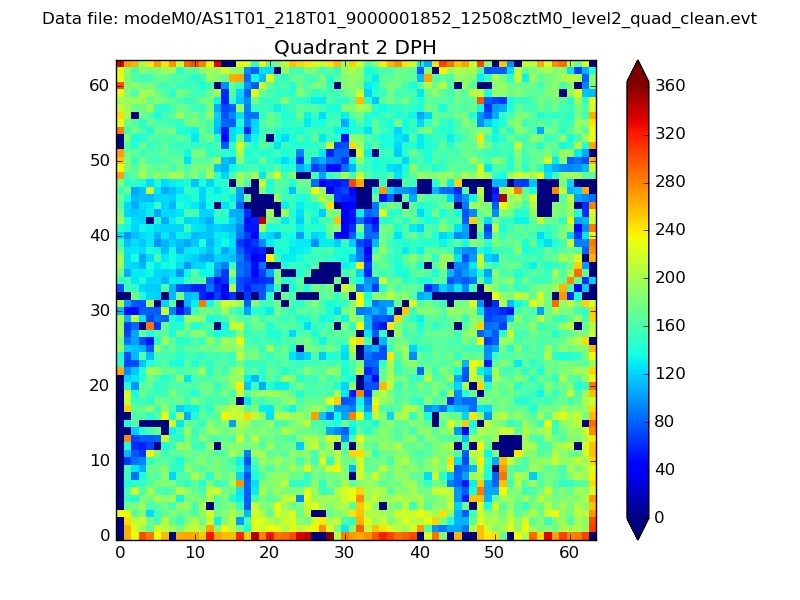
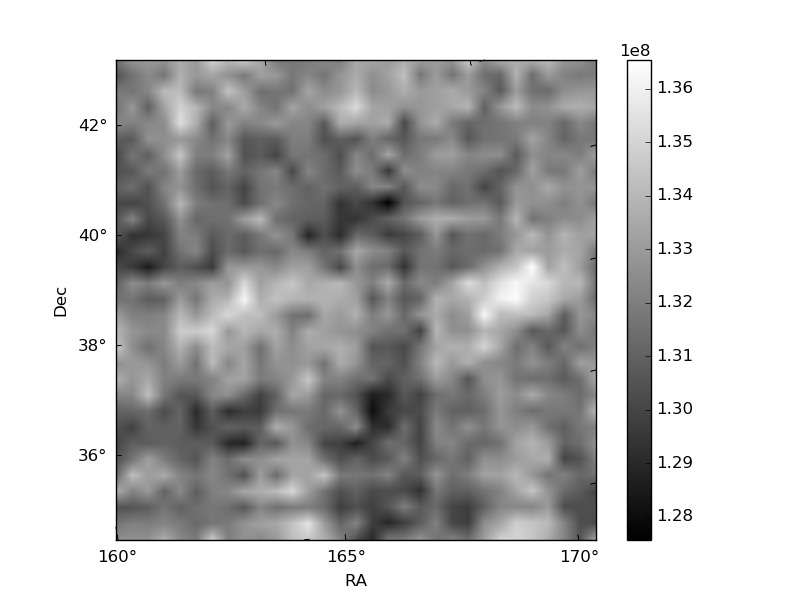
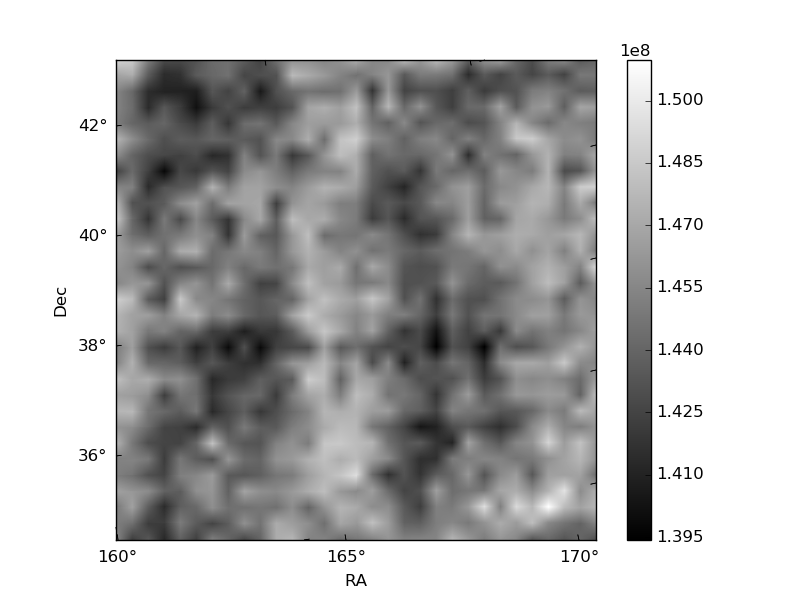
Histogram calculated using DETX and DETY for each event in the final _common_clean file
| Quadrant A | 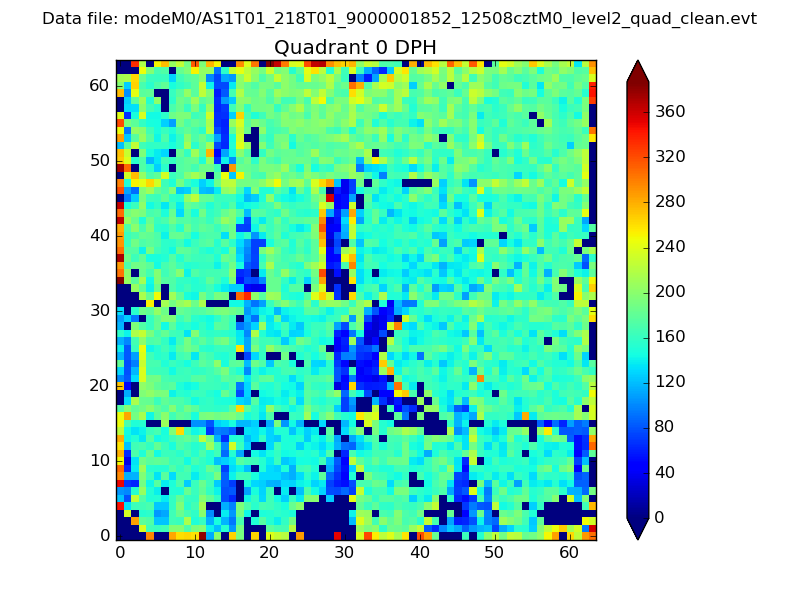 |
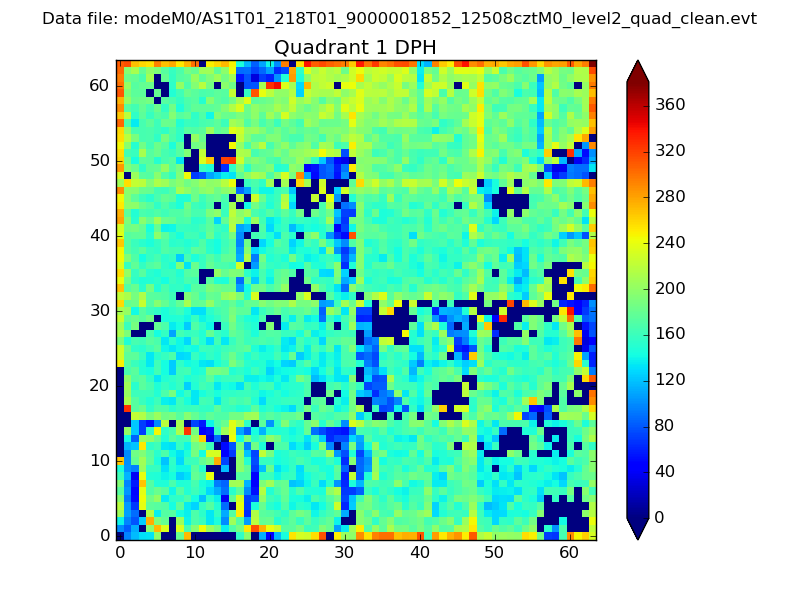 |
Quadrant B |
|---|---|---|---|
| Quadrant D | 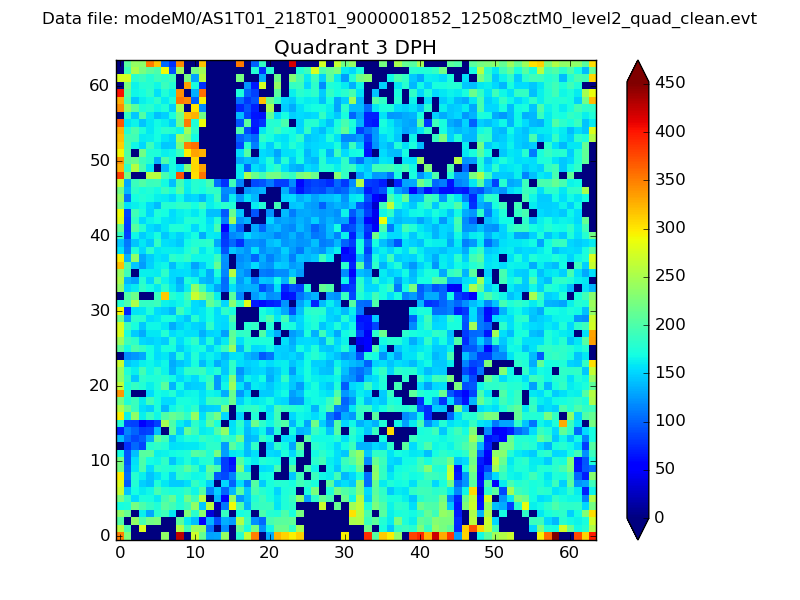 |
 |
Quadrant C |
| Plot type | Count rate plots | Images |
|---|---|---|
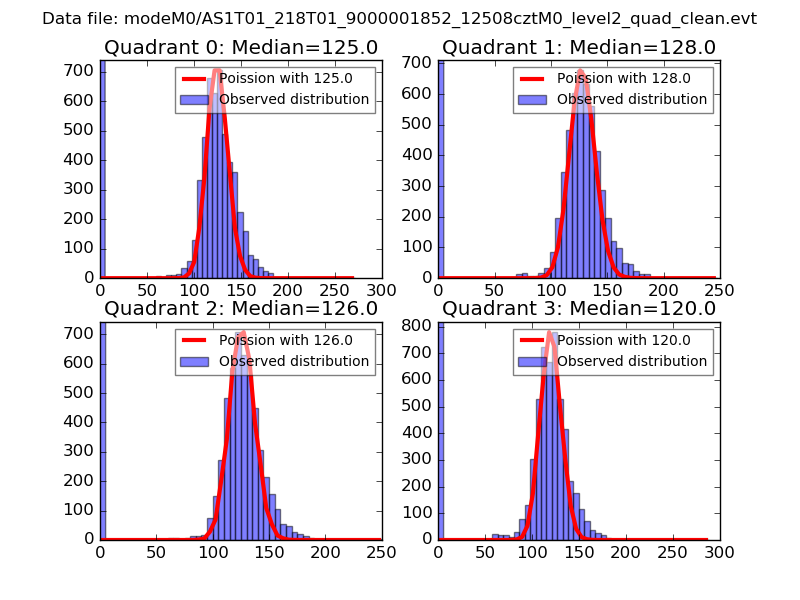
| Comparison with Poisson distribution Blue bars denote a histogram of data divided into 1 sec bins. Red curve is a Poisson curve with rate = median count rate of data. |
 |
 |
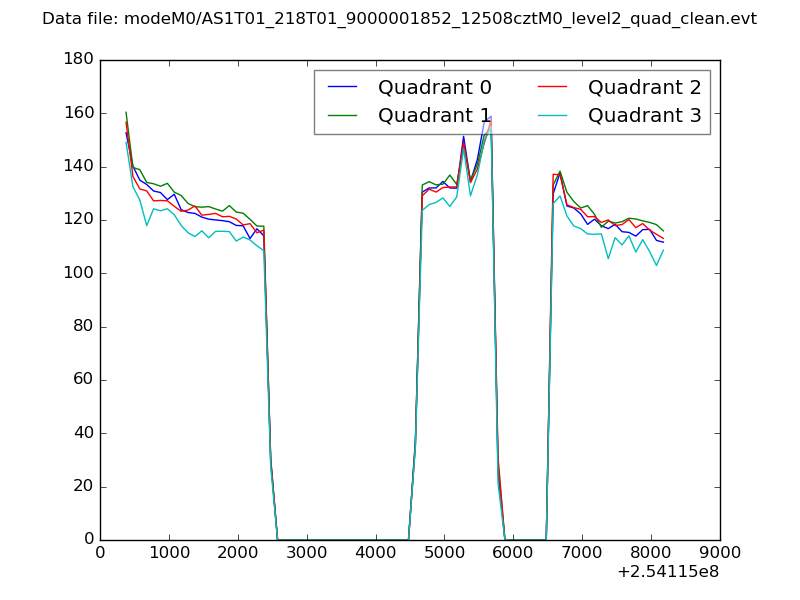
| Quadrant-wise count rates Data is divided into 100 sec bins |
 |
|
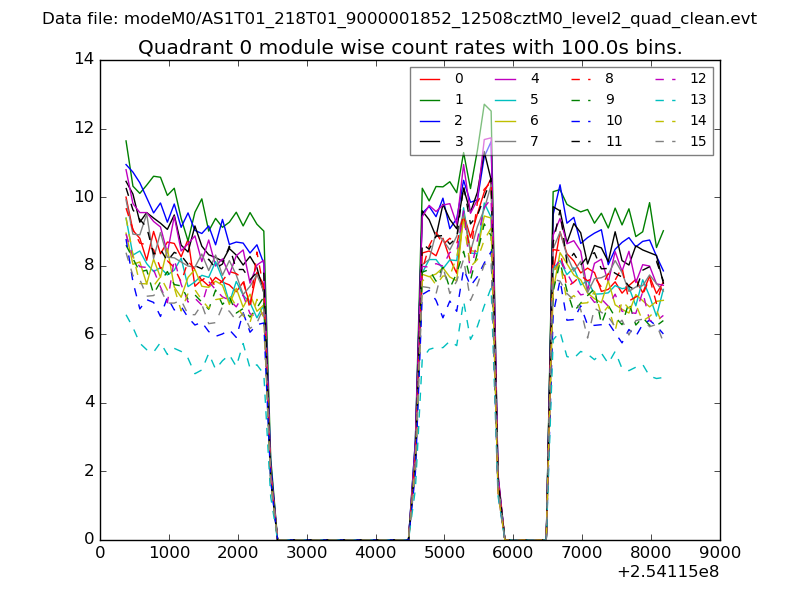
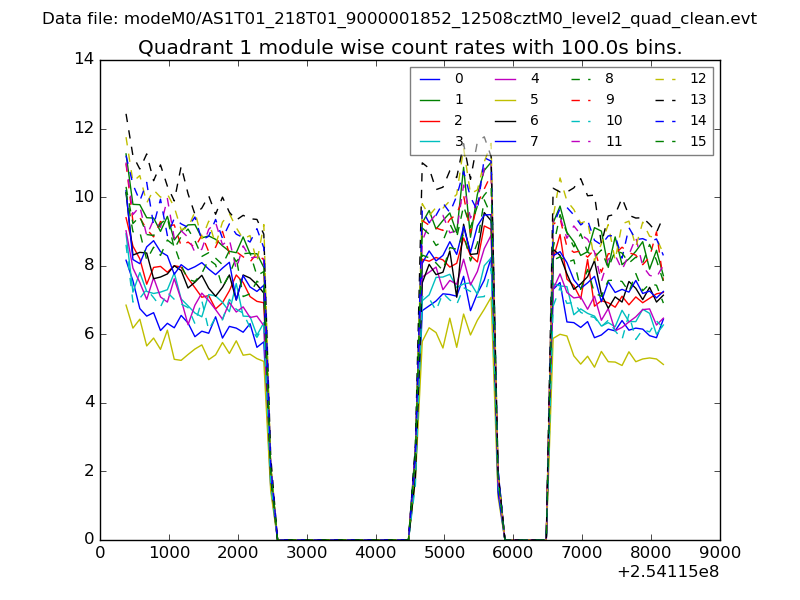
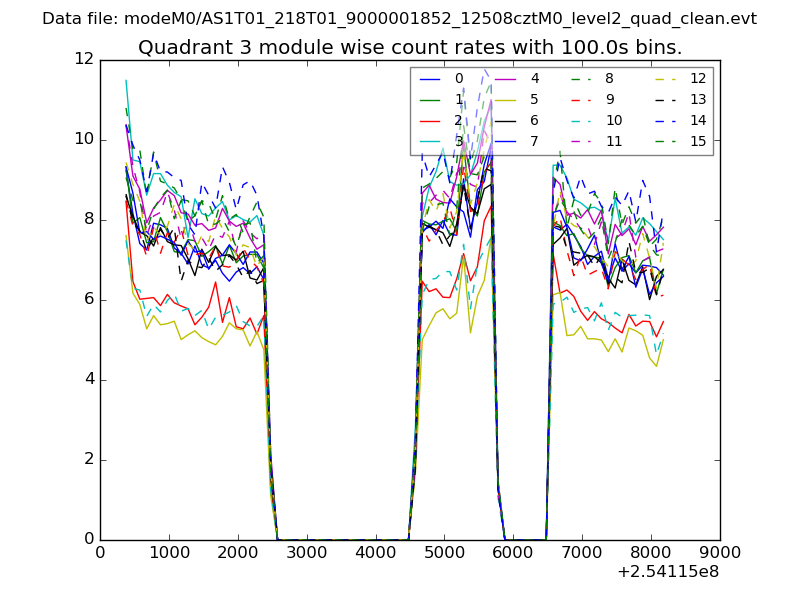
| Module-wise count rates for Quadrant A Data is divided into 100 sec bins |
 |
 |
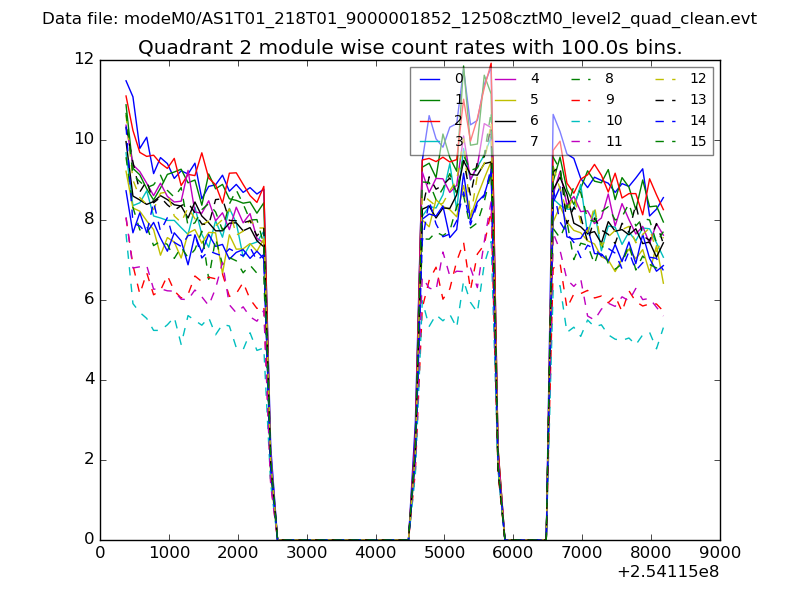
| Module-wise count rates for Quadrant B Data is divided into 100 sec bins |
 |
 |
| Module-wise count rates for Quadrant C Data is divided into 100 sec bins |
 |
 |
| Module-wise count rates for Quadrant D Data is divided into 100 sec bins |
 |
 |
| Parameter | Plot |
|---|---|
| CZT HV Monitor | 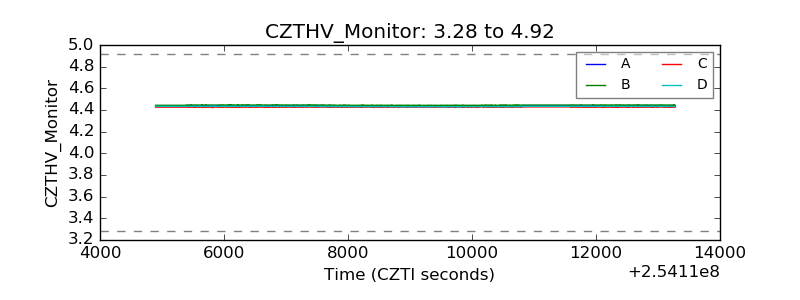 |
| D_VDD | 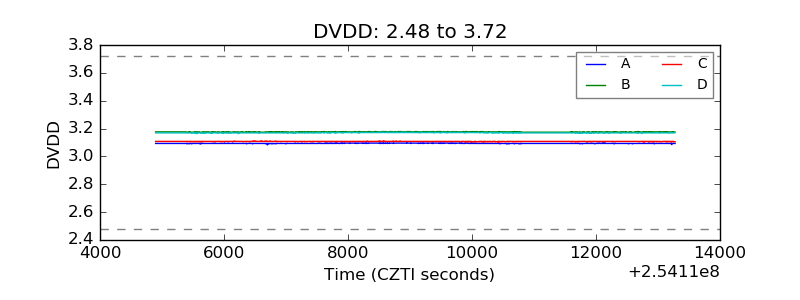 |
| Temperature 1 | 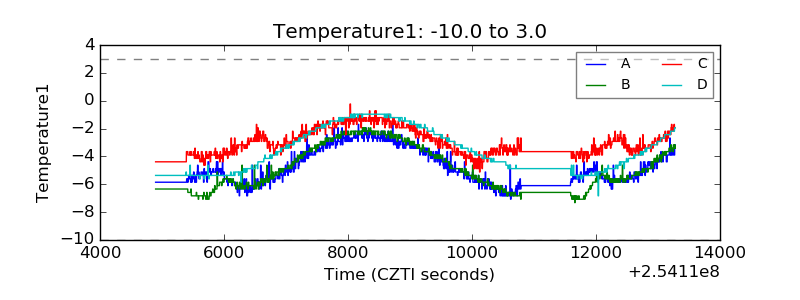 |
| Veto HV Monitor | 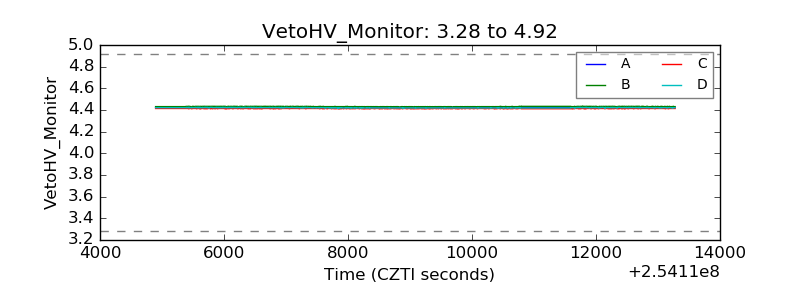 |
| Veto LLD | 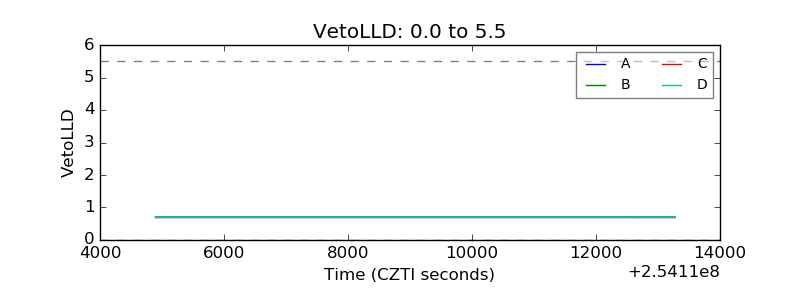 |
| Alpha Counter | 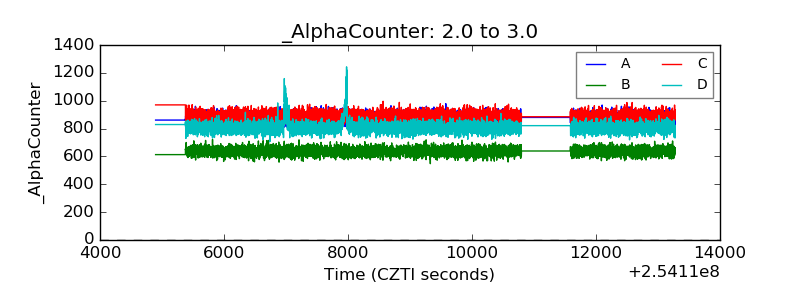 |
| _CPM_Rate | 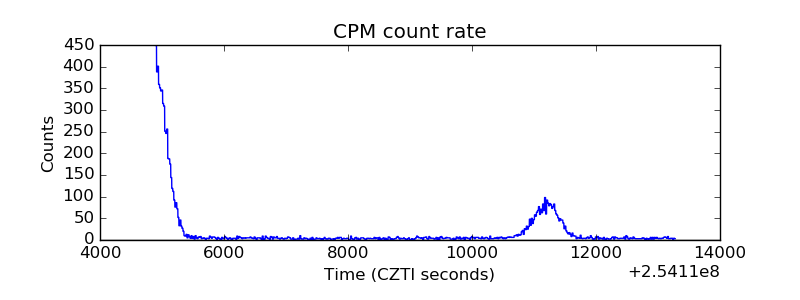 |
| CZT Counter | 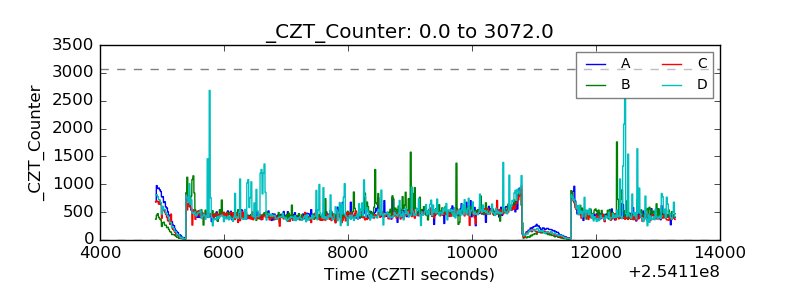 |
| +2.5 Volts monitor |  |
| +5 Volts monitor | 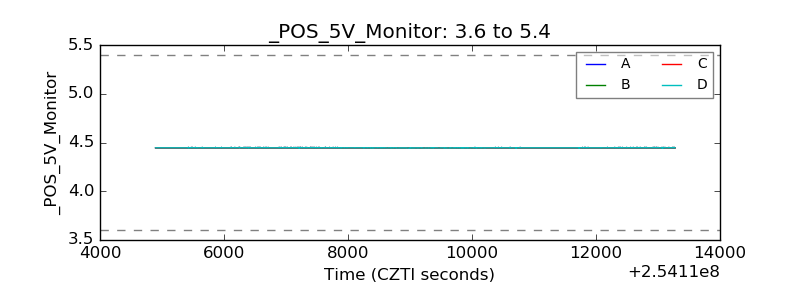 |
| _ROLL_ROT | 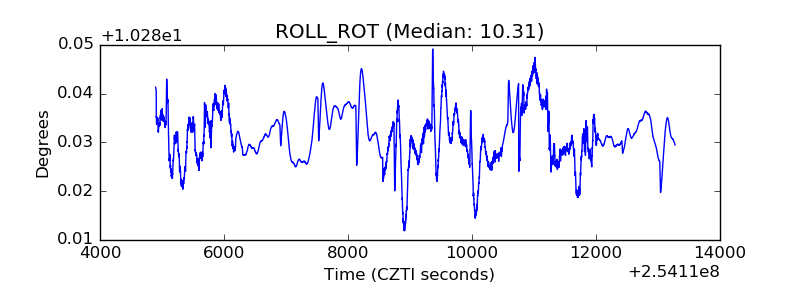 |
| _Roll_DEC | 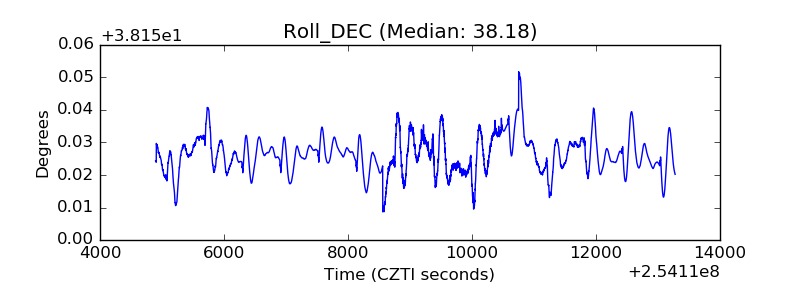 |
| _Roll_RA |  |
| Veto Counter | 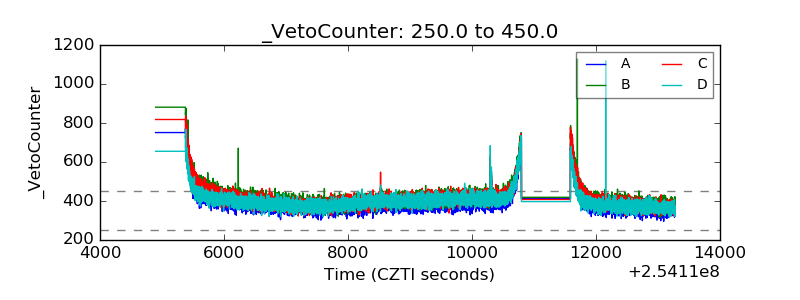 |