| Param | Original file | Final file |
|---|---|---|
| Filename | modeM0/AS1T01_218T01_9000001852_12510cztM0_level2.evt | modeM0/AS1T01_218T01_9000001852_12510cztM0_level2_quad_clean.evt |
| Size (bytes) | 510,278,400 | 89,452,800 |
| Size | 486.6 MB | 85.3 MB |
| Events in quadrant A | 3,750,668 | 549,552 |
| Events in quadrant B | 3,866,234 | 564,098 |
| Events in quadrant C | 3,390,966 | 554,643 |
| Events in quadrant D | 3,947,582 | 529,625 |
| Mode M0 | |||
|---|---|---|---|
| Quadrant | BADHDUFLAG | Total packets | Discarded packets |
| A | 0 | 15721 | 1 |
| B | 0 | 16173 | 0 |
| C | 0 | 15302 | 0 |
| D | 0 | 16775 | 0 |
| Mode SS | |||
|---|---|---|---|
| Quadrant | BADHDUFLAG | Total packets | Discarded packets |
| A | 0 | 148 | 0 |
| B | 0 | 148 | 0 |
| C | 0 | 148 | 0 |
| D | 0 | 148 | 0 |
| Quadrant | Total seconds | Saturated seconds | Saturation percentage |
|---|---|---|---|
| A | 7331 | 223 | 3.041877% |
| B | 7331 | 285 | 3.887601% |
| C | 7331 | 155 | 2.114309% |
| D | 7331 | 212 | 2.891829% |
Noise dominated data is calculated using 1-second bins in cleaned event files. If a bin has >2000 counts, and if more than 50% of those come from <1% of pixels, then it is considered to be noise-dominated and hence unusable.
| Quadrant | # 1 sec bins | Bins with >0 counts | Bins with >2000 counts | High rate bins dominated by noise | Noise dominated (total time) | Noise dominated (detector-on time) | Marked lightcurve |
|---|---|---|---|---|---|---|---|
| A | 7332 | 7332 | 0 | 0 | 0.00% | 0.00% | 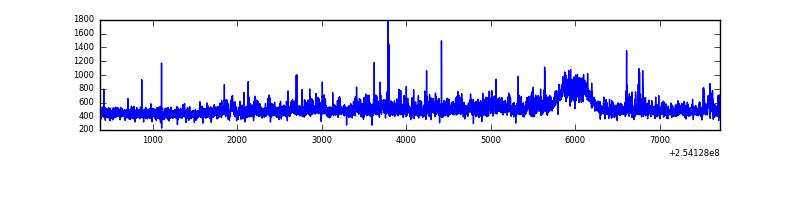 |
| B | 7332 | 7332 | 38 | 38 | 0.52% | 0.52% | 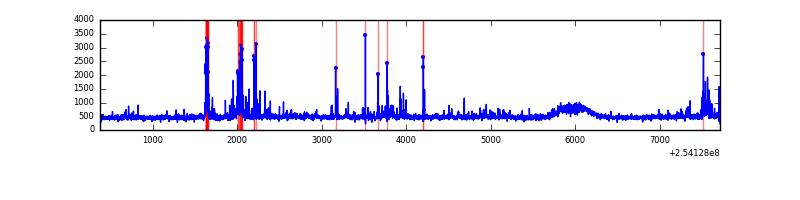 |
| C | 7332 | 7332 | 14 | 14 | 0.19% | 0.19% | 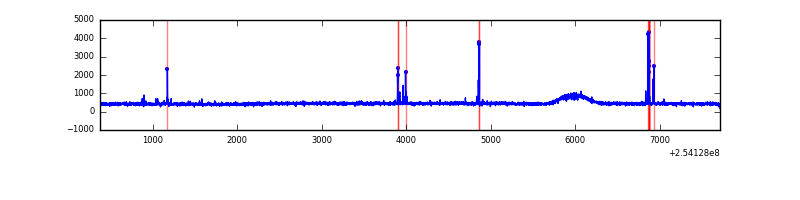 |
| D | 7332 | 7332 | 59 | 59 | 0.80% | 0.80% | 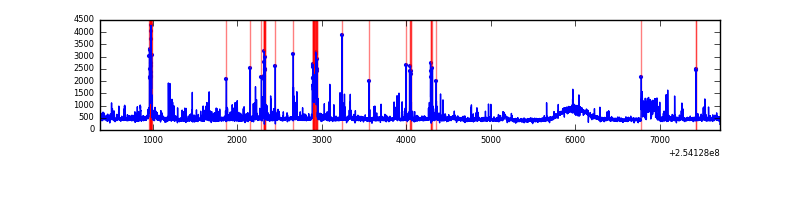 |
Top three noisy pixels from each quadrant. If the there are fewer than three noisy pixels in the level2.evt file, extra rows are filled as -1
| Pixel properties | Quadrant properties | ||||||
|---|---|---|---|---|---|---|---|
| Quadrant | DetID | PixID | Counts | Sigma | Mean | Median | Sigma |
| A | 12 | 189 | 191580 | 1064.94 | 879 | 858 | 179.1 |
| A | 1 | 162 | 57619 | 316.94 | 879 | 858 | 179.1 |
| A | 1 | 178 | 35841 | 195.33 | 879 | 858 | 179.1 |
| B | 4 | 239 | 319792 | 1871.83 | 878 | 855 | 170.4 |
| B | 11 | 51 | 30298 | 172.8 | 878 | 855 | 170.4 |
| B | 3 | 209 | 23030 | 130.14 | 878 | 855 | 170.4 |
| C | 14 | 234 | 78271 | 389.76 | 849 | 850 | 198.6 |
| C | 13 | 61 | 6219 | 27.03 | 849 | 850 | 198.6 |
| C | 8 | 222 | 2311 | 7.36 | 849 | 850 | 198.6 |
| D | 1 | 52 | 359953 | 1735.76 | 848 | 819 | 206.9 |
| D | 1 | 255 | 137055 | 658.45 | 848 | 819 | 206.9 |
| D | 7 | 71 | 102101 | 489.51 | 848 | 819 | 206.9 |
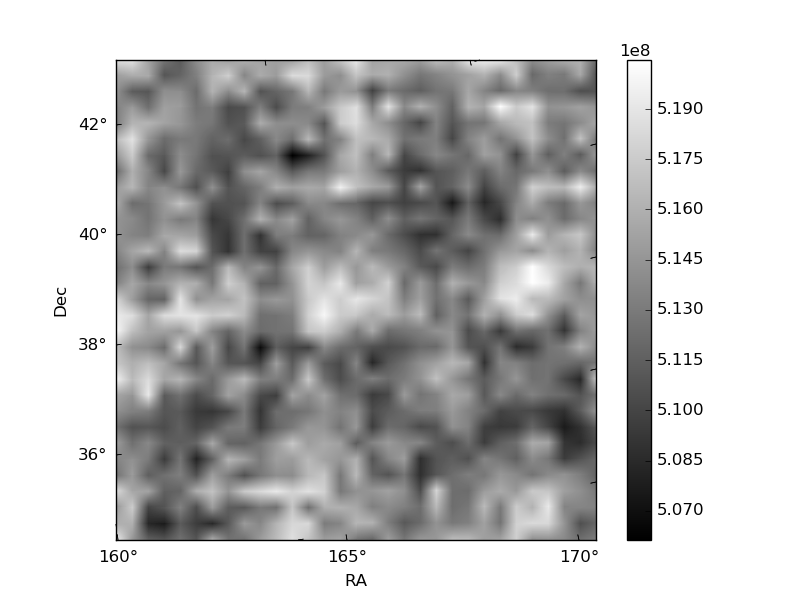
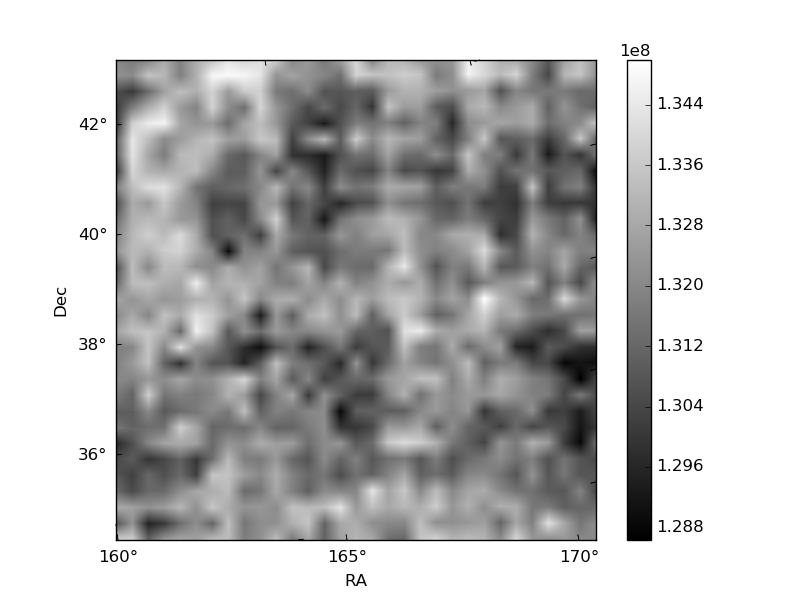
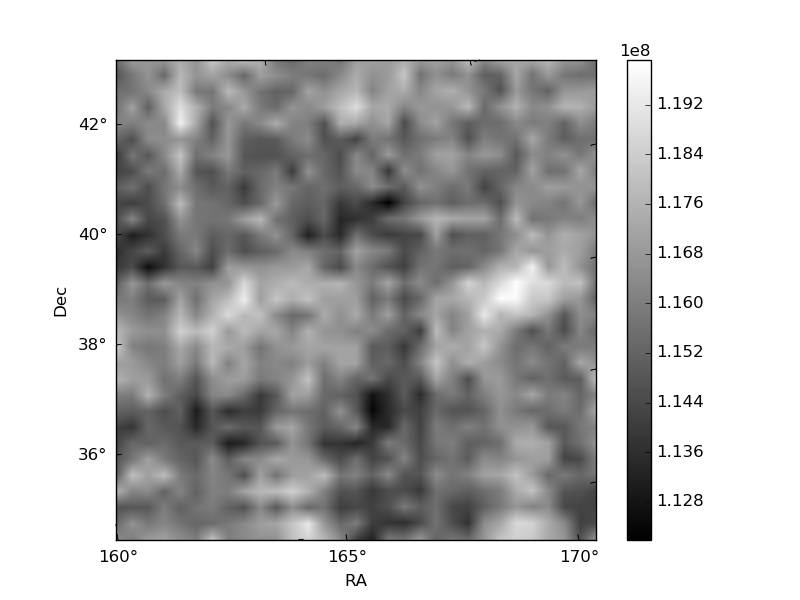
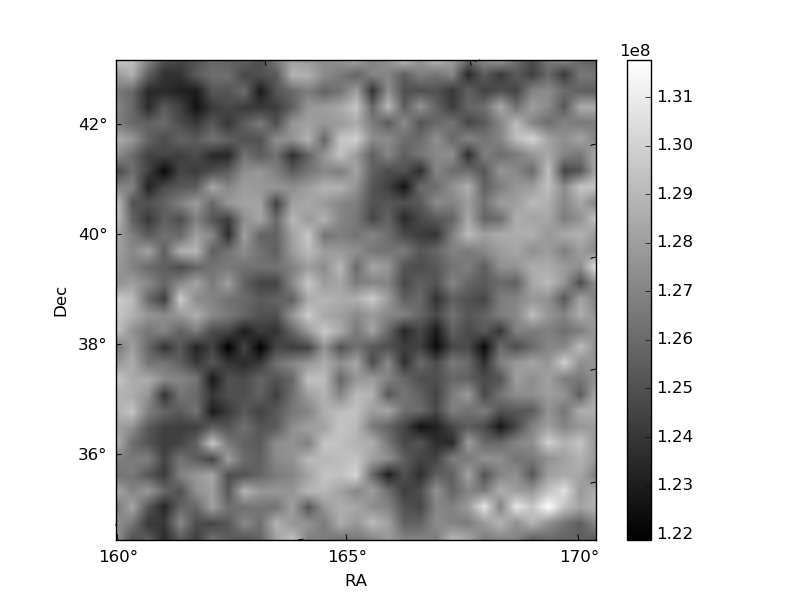
Histogram calculated using DETX and DETY for each event in the final _common_clean file
| Quadrant A | 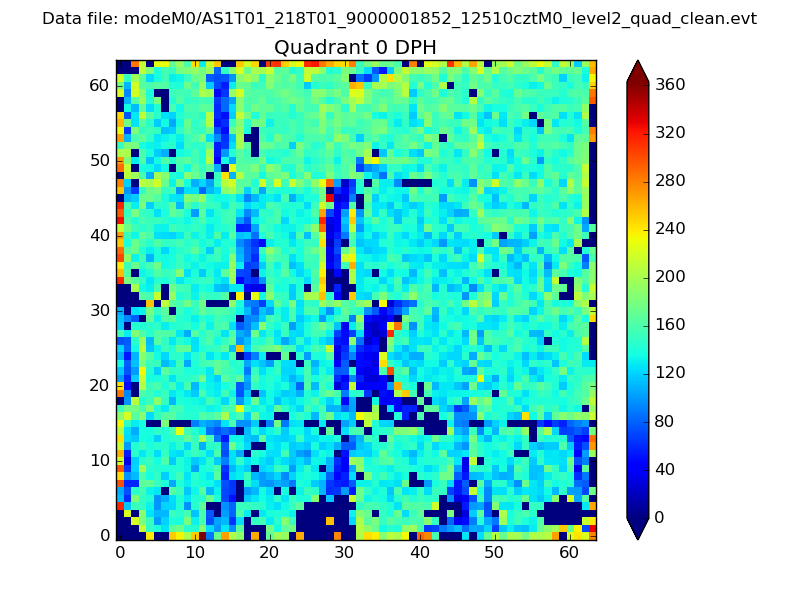 |
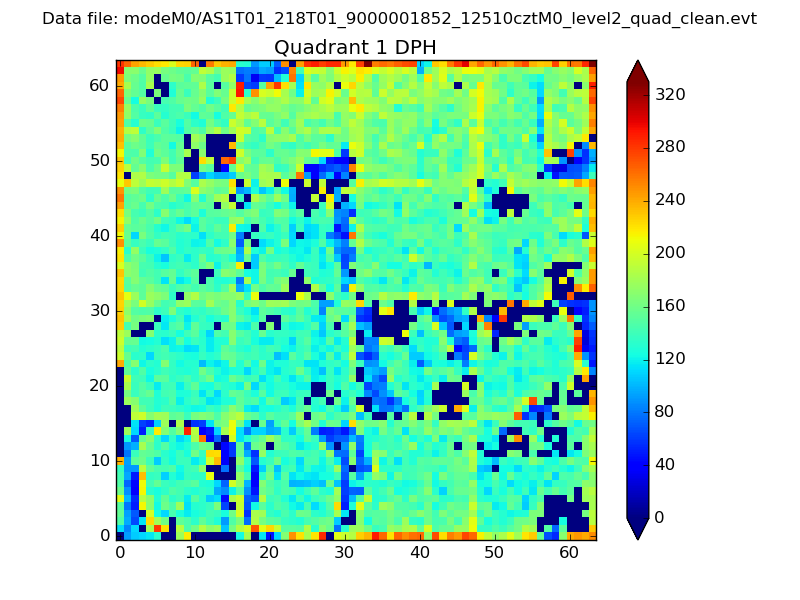 |
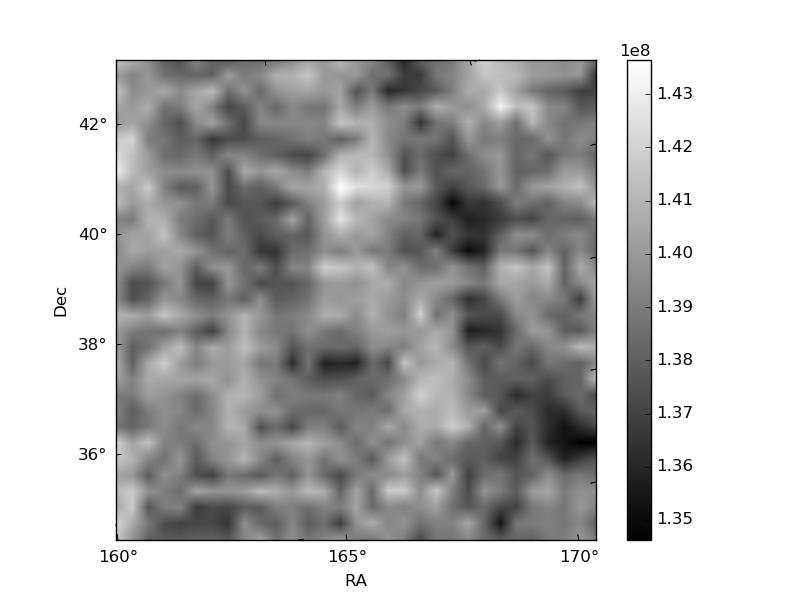
Quadrant B |
|---|---|---|---|
| Quadrant D | 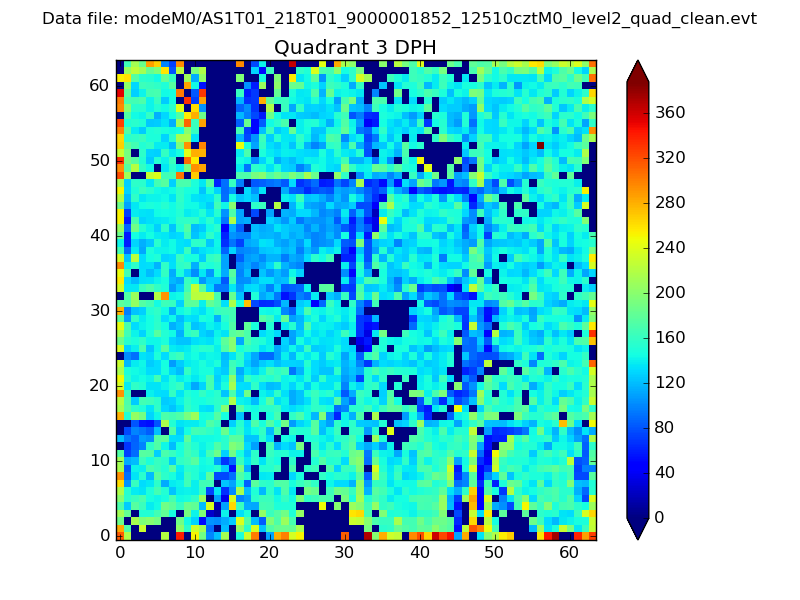 |
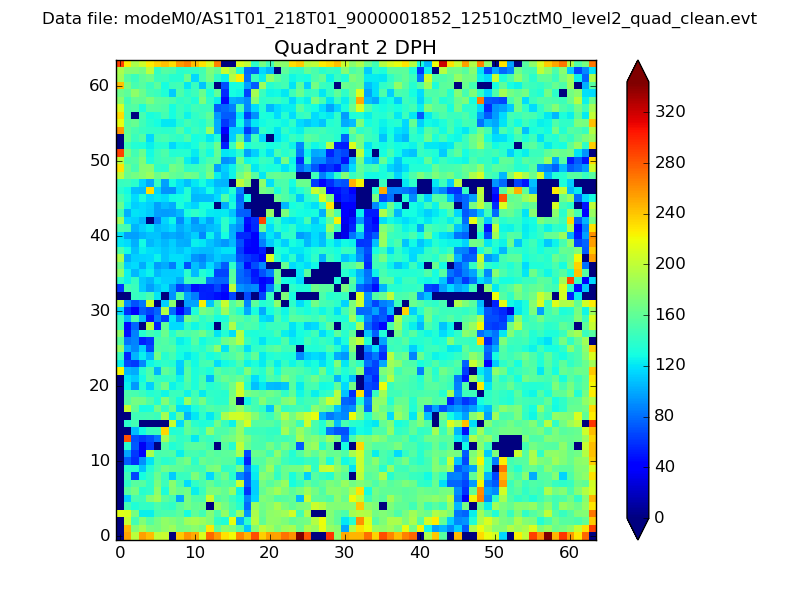 |
Quadrant C |
| Plot type | Count rate plots | Images |
|---|---|---|
| Comparison with Poisson distribution Blue bars denote a histogram of data divided into 1 sec bins. Red curve is a Poisson curve with rate = median count rate of data. |
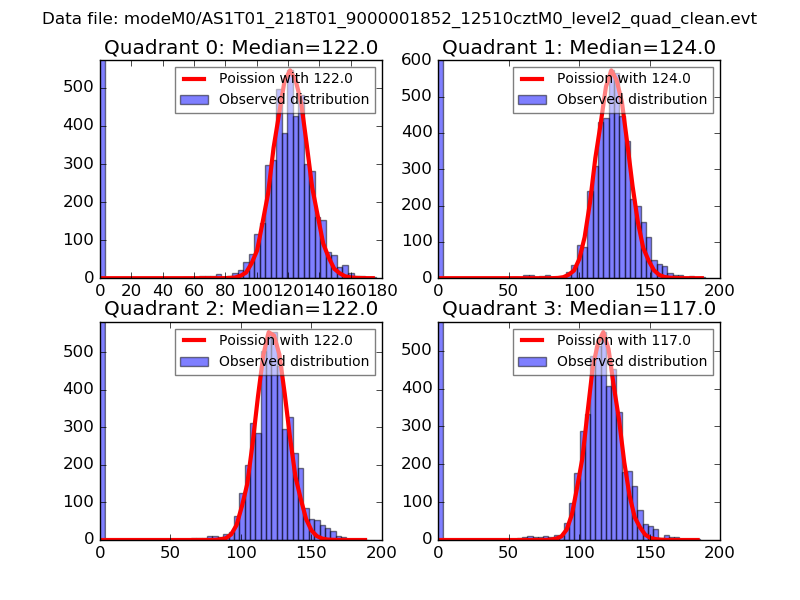 |
 |
| Quadrant-wise count rates Data is divided into 100 sec bins |
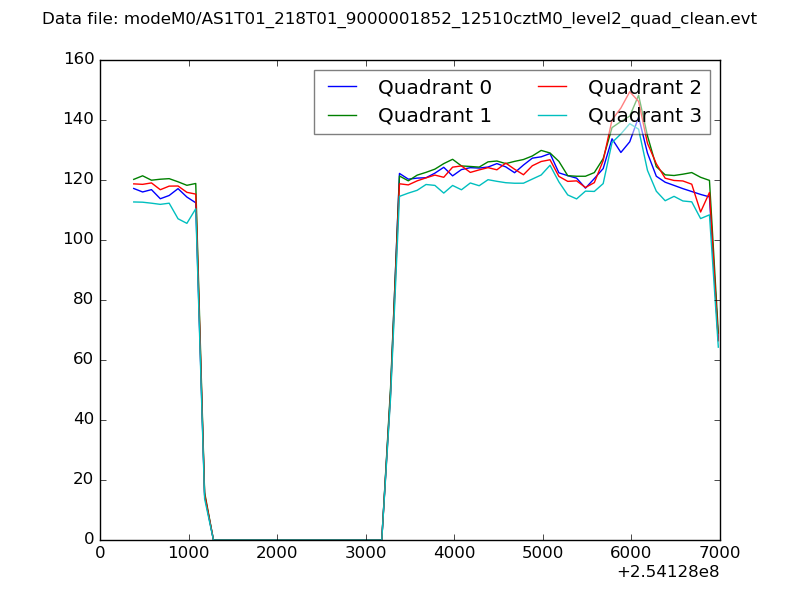 |
|
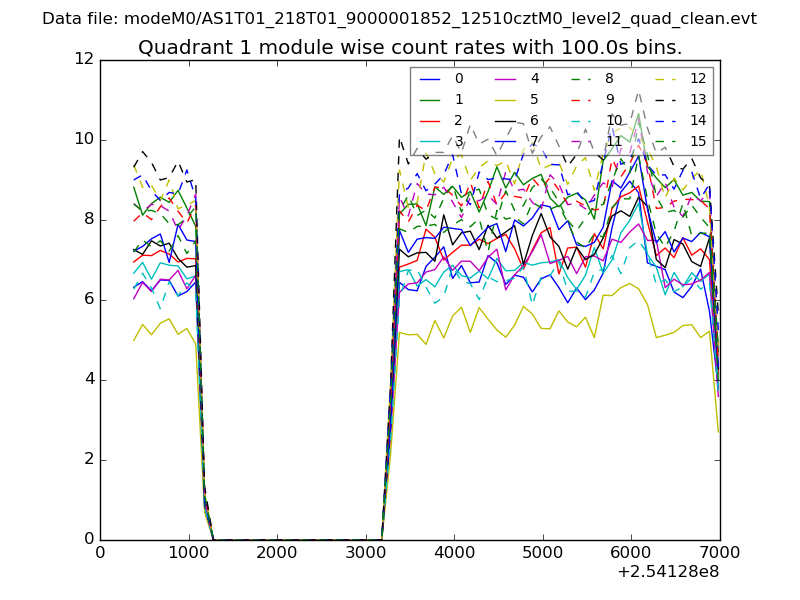
| Module-wise count rates for Quadrant A Data is divided into 100 sec bins |
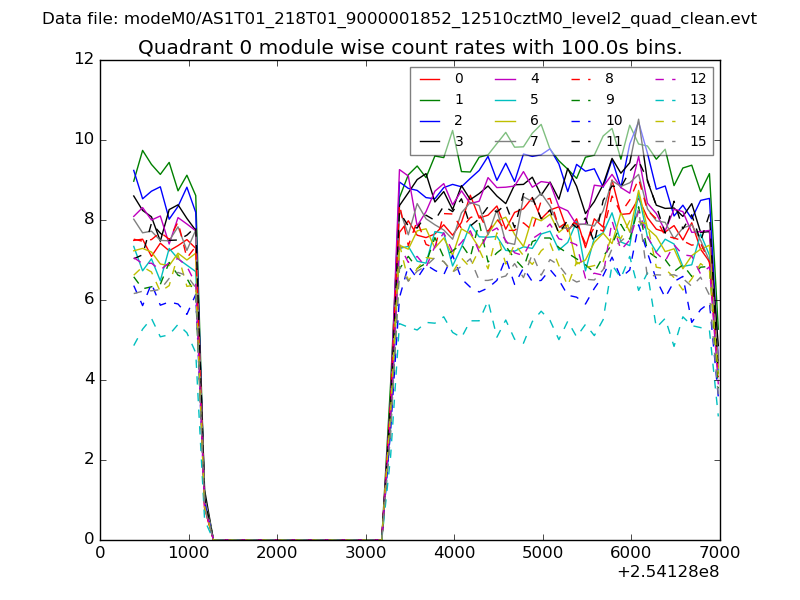 |
 |
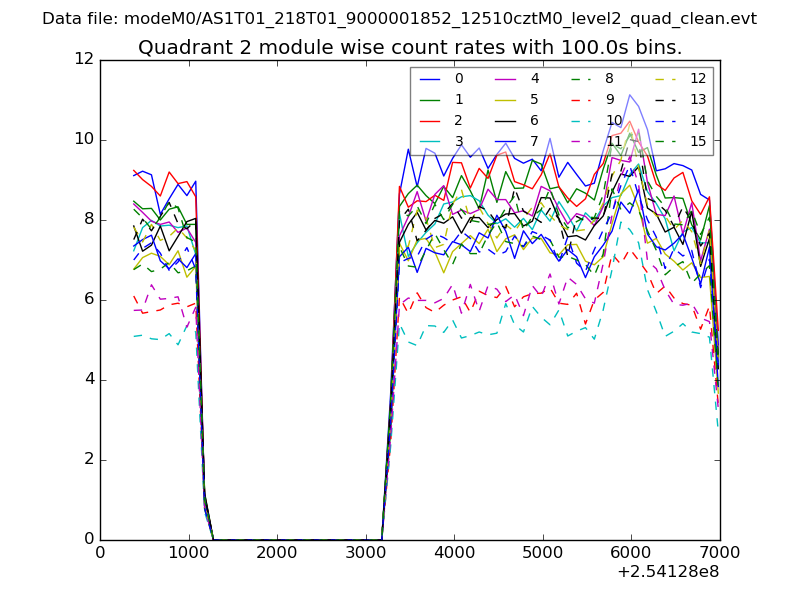
| Module-wise count rates for Quadrant B Data is divided into 100 sec bins |
 |
 |
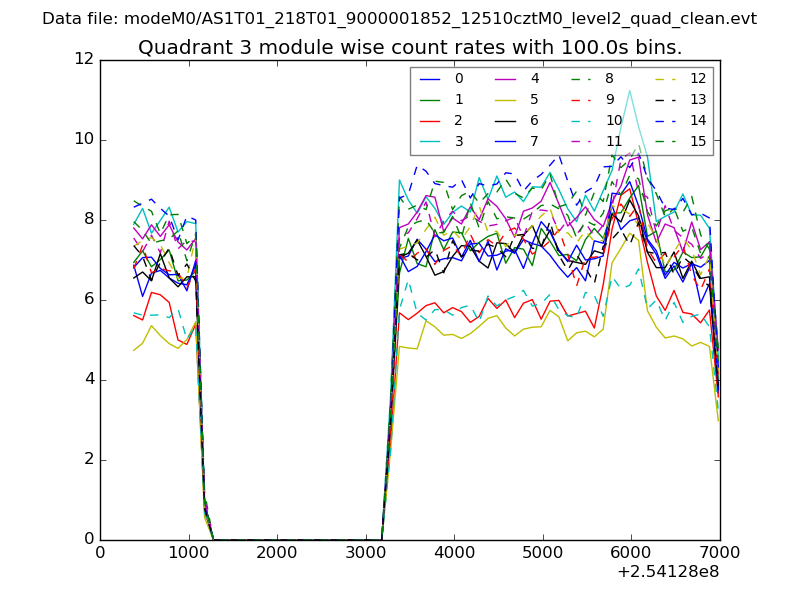
| Module-wise count rates for Quadrant C Data is divided into 100 sec bins |
 |
 |
| Module-wise count rates for Quadrant D Data is divided into 100 sec bins |
 |
 |
| Parameter | Plot |
|---|---|
| CZT HV Monitor | 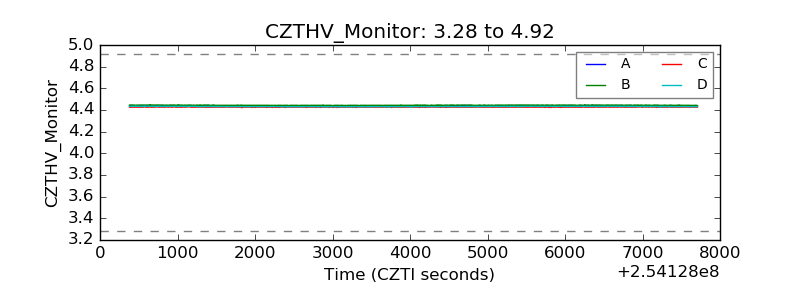 |
| D_VDD | 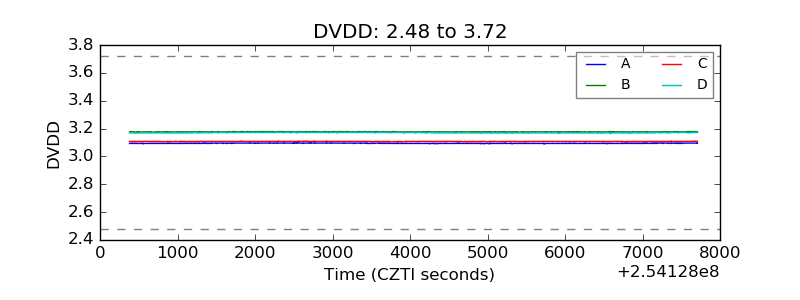 |
| Temperature 1 | 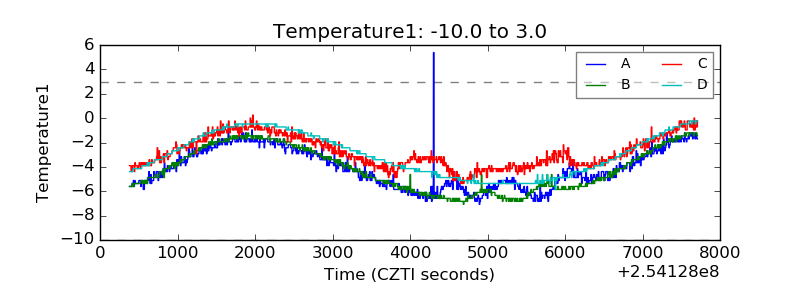 |
| Veto HV Monitor | 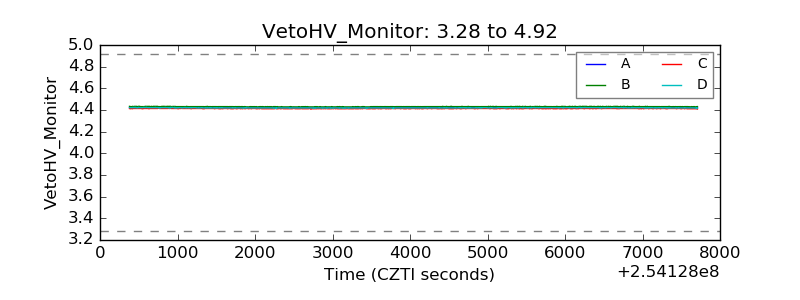 |
| Veto LLD | 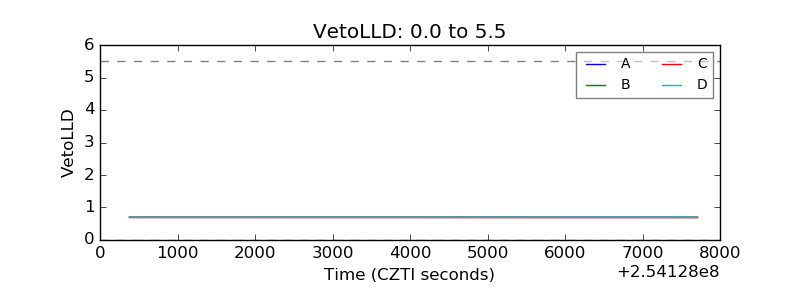 |
| Alpha Counter | 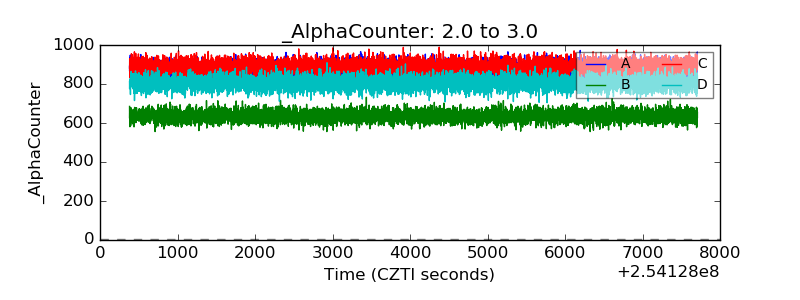 |
| _CPM_Rate | 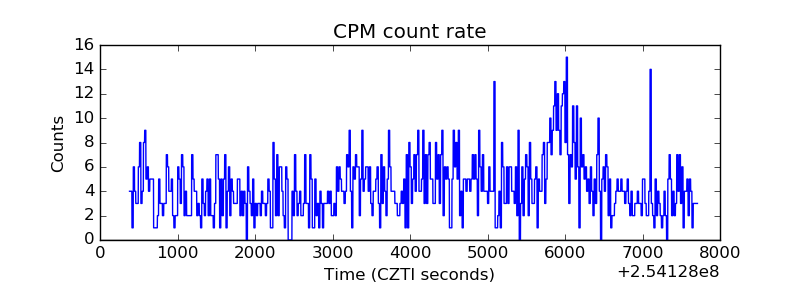 |
| CZT Counter | 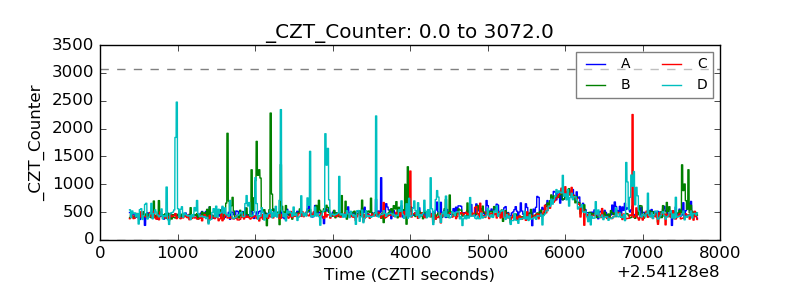 |
| +2.5 Volts monitor |  |
| +5 Volts monitor |  |
| _ROLL_ROT | 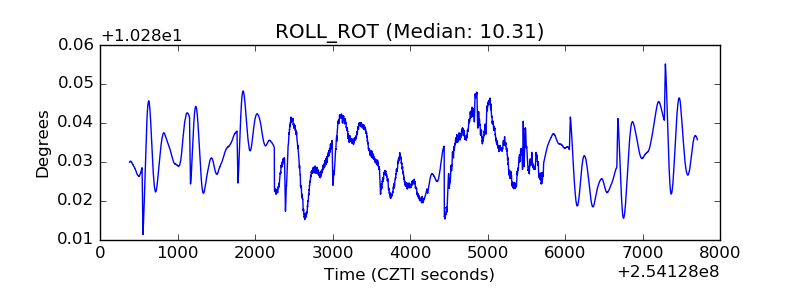 |
| _Roll_DEC | 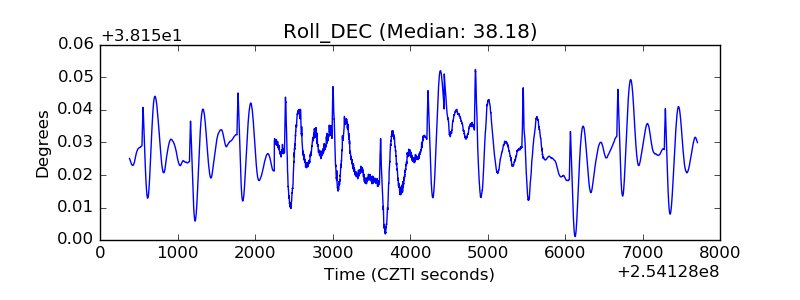 |
| _Roll_RA | 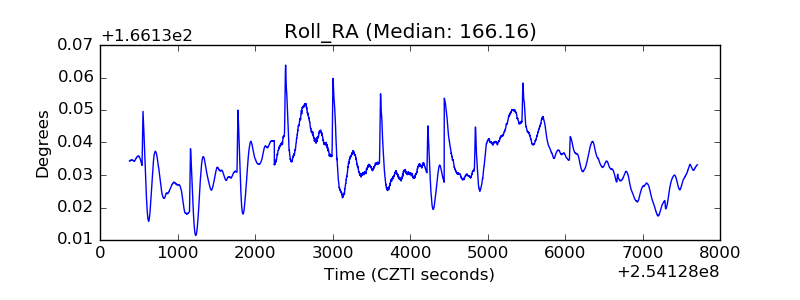 |
| Veto Counter | 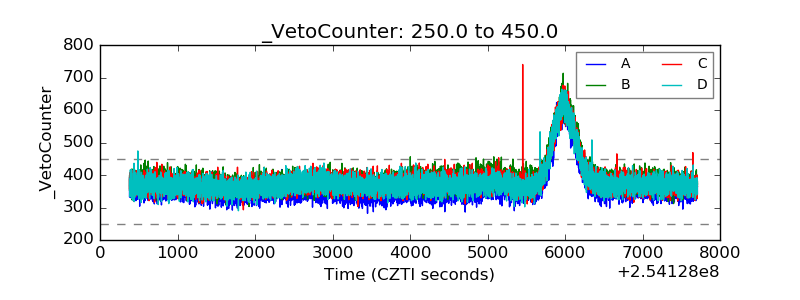 |