| Param | Original file | Final file |
|---|---|---|
| Filename | modeM0/AS1T01_218T01_9000001852_12511cztM0_level2.evt | modeM0/AS1T01_218T01_9000001852_12511cztM0_level2_quad_clean.evt |
| Size (bytes) | 532,644,480 | 78,932,160 |
| Size | 508.0 MB | 75.3 MB |
| Events in quadrant A | 3,815,320 | 475,965 |
| Events in quadrant B | 3,906,707 | 483,176 |
| Events in quadrant C | 3,311,104 | 475,190 |
| Events in quadrant D | 4,605,516 | 450,385 |
| Mode M0 | |||
|---|---|---|---|
| Quadrant | BADHDUFLAG | Total packets | Discarded packets |
| A | 0 | 15894 | 2 |
| B | 0 | 16154 | 1 |
| C | 0 | 14987 | 1 |
| D | 0 | 18672 | 1 |
| Mode SS | |||
|---|---|---|---|
| Quadrant | BADHDUFLAG | Total packets | Discarded packets |
| A | 0 | 144 | 0 |
| B | 0 | 144 | 0 |
| C | 0 | 144 | 0 |
| D | 0 | 144 | 0 |
| Mode M9 | |||
|---|---|---|---|
| Quadrant | BADHDUFLAG | Total packets | Discarded packets |
| A | 0 | 3 | 0 |
| B | 0 | 3 | 0 |
| C | 0 | 3 | 0 |
| D | 0 | 3 | 0 |
| Quadrant | Total seconds | Saturated seconds | Saturation percentage |
|---|---|---|---|
| A | 7268 | 157 | 2.160154% |
| B | 7268 | 236 | 3.247111% |
| C | 7268 | 139 | 1.912493% |
| D | 7268 | 278 | 3.824986% |
Noise dominated data is calculated using 1-second bins in cleaned event files. If a bin has >2000 counts, and if more than 50% of those come from <1% of pixels, then it is considered to be noise-dominated and hence unusable.
| Quadrant | # 1 sec bins | Bins with >0 counts | Bins with >2000 counts | High rate bins dominated by noise | Noise dominated (total time) | Noise dominated (detector-on time) | Marked lightcurve |
|---|---|---|---|---|---|---|---|
| A | 7484 | 7269 | 0 | 0 | 0.00% | 0.00% | 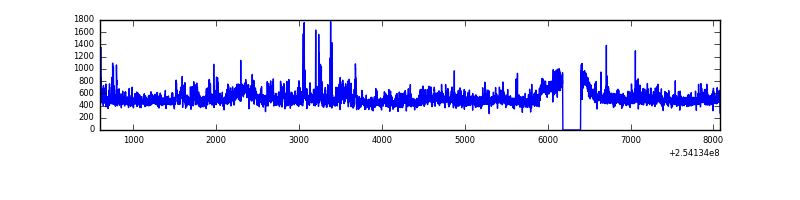 |
| B | 7484 | 7269 | 36 | 36 | 0.48% | 0.50% | 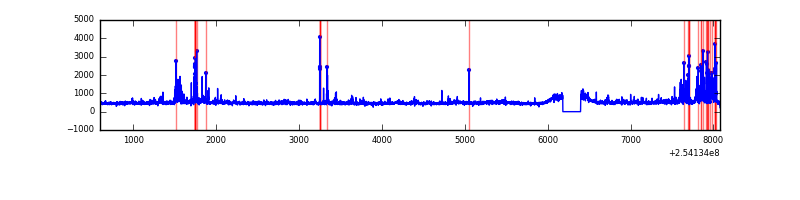 |
| C | 7484 | 7270 | 8 | 8 | 0.11% | 0.11% | 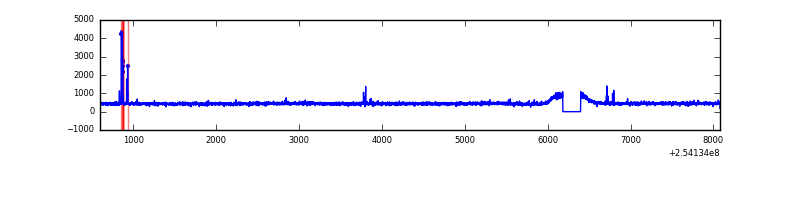 |
| D | 7484 | 7270 | 116 | 116 | 1.55% | 1.60% | 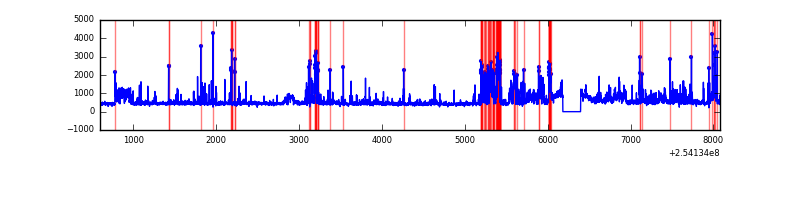 |
Top three noisy pixels from each quadrant. If the there are fewer than three noisy pixels in the level2.evt file, extra rows are filled as -1
| Pixel properties | Quadrant properties | ||||||
|---|---|---|---|---|---|---|---|
| Quadrant | DetID | PixID | Counts | Sigma | Mean | Median | Sigma |
| A | 12 | 189 | 330890 | 1861.43 | 867 | 845 | 177.3 |
| A | 1 | 162 | 46940 | 259.97 | 867 | 845 | 177.3 |
| A | 1 | 178 | 26816 | 146.47 | 867 | 845 | 177.3 |
| B | 4 | 239 | 332879 | 1987.38 | 863 | 841 | 167.1 |
| B | 11 | 51 | 62118 | 366.77 | 863 | 841 | 167.1 |
| B | 0 | 218 | 42239 | 247.78 | 863 | 841 | 167.1 |
| C | 14 | 234 | 53933 | 272.68 | 835 | 835 | 194.7 |
| C | 13 | 61 | 6121 | 27.14 | 835 | 835 | 194.7 |
| C | 12 | 4 | 2324 | 7.64 | 835 | 835 | 194.7 |
| D | 1 | 255 | 780773 | 3869.5 | 829 | 804 | 201.6 |
| D | 1 | 52 | 311388 | 1540.83 | 829 | 804 | 201.6 |
| D | 14 | 34 | 180435 | 891.16 | 829 | 804 | 201.6 |
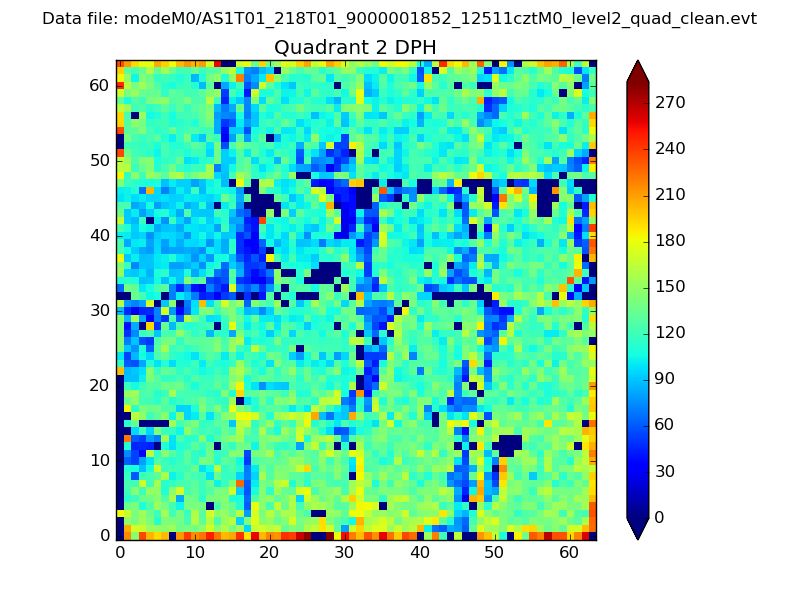
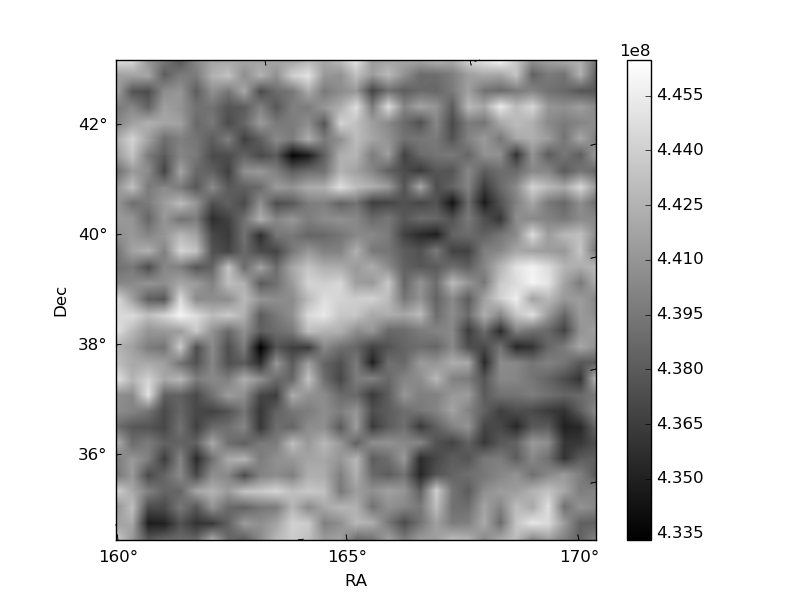
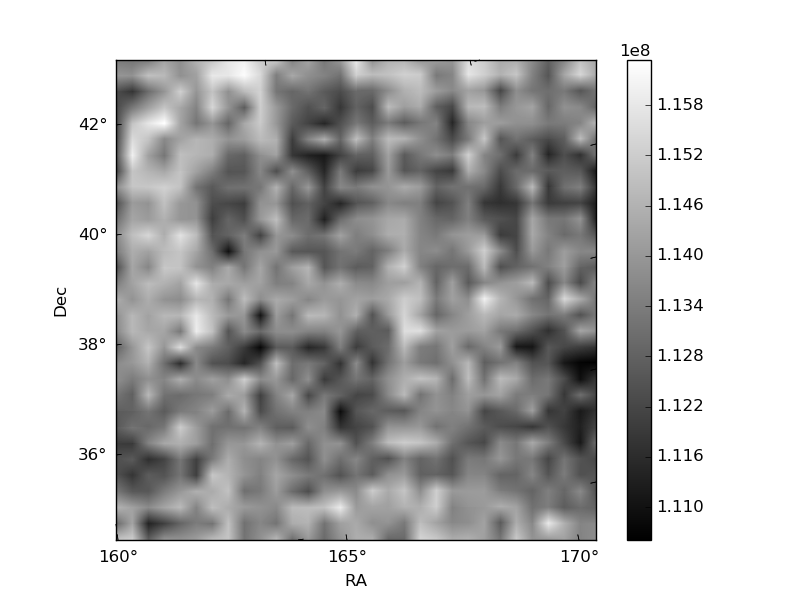
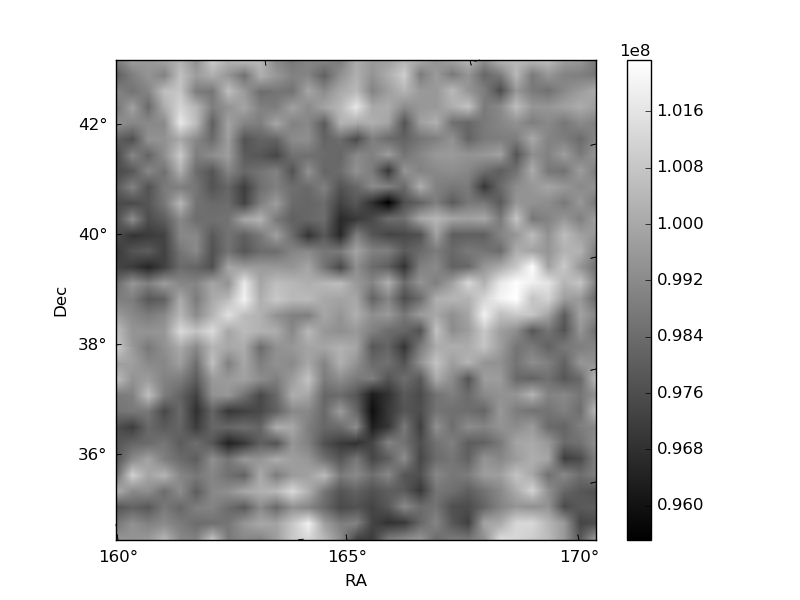
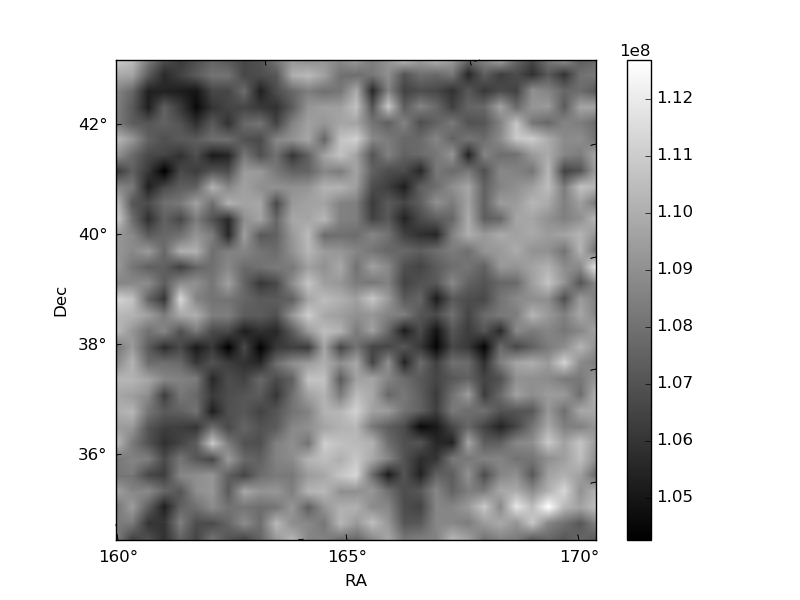
Histogram calculated using DETX and DETY for each event in the final _common_clean file
| Quadrant A | 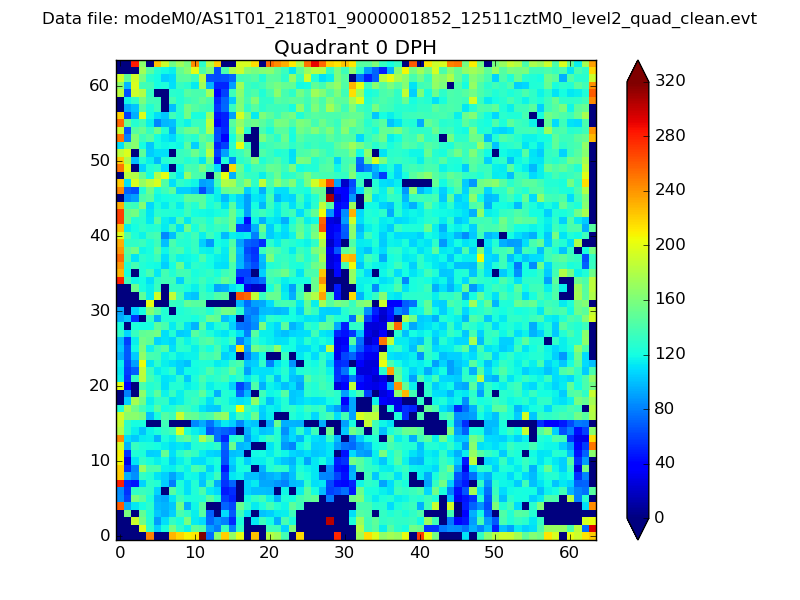 |
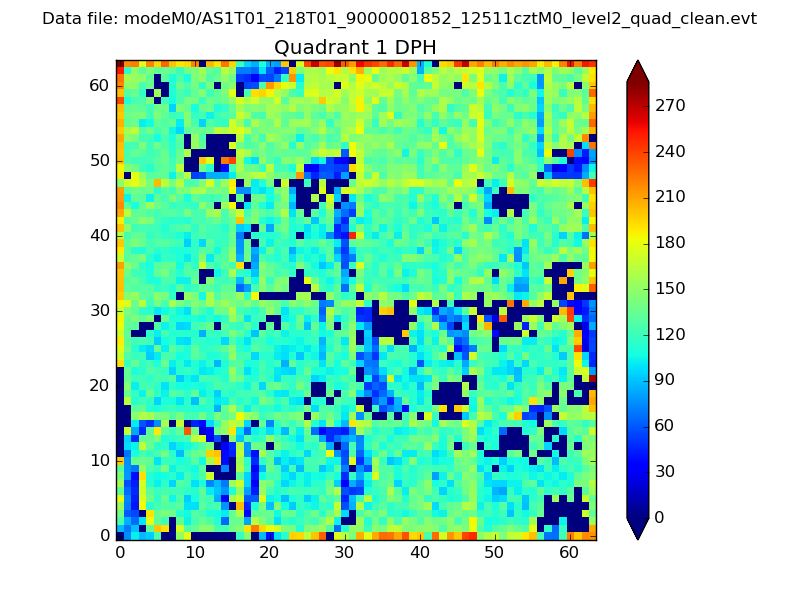 |
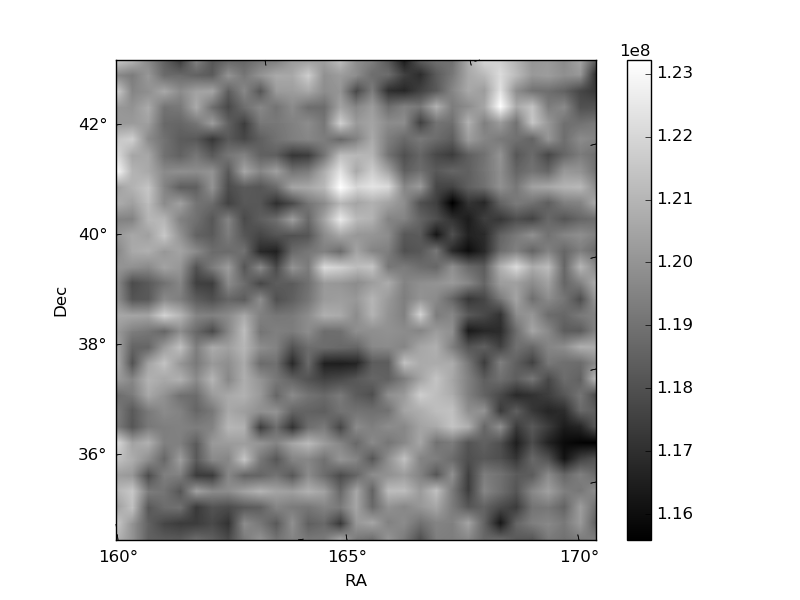
Quadrant B |
|---|---|---|---|
| Quadrant D | 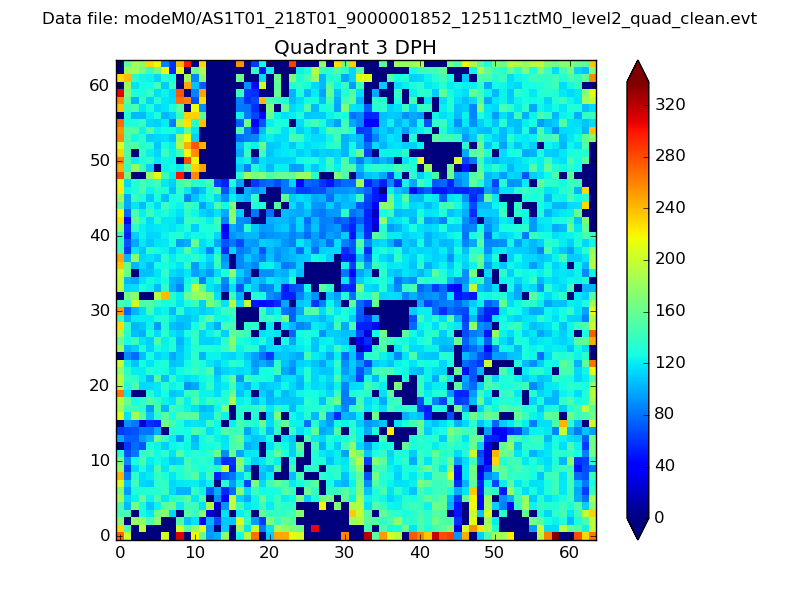 |
 |
Quadrant C |
| Plot type | Count rate plots | Images |
|---|---|---|
| Comparison with Poisson distribution Blue bars denote a histogram of data divided into 1 sec bins. Red curve is a Poisson curve with rate = median count rate of data. |
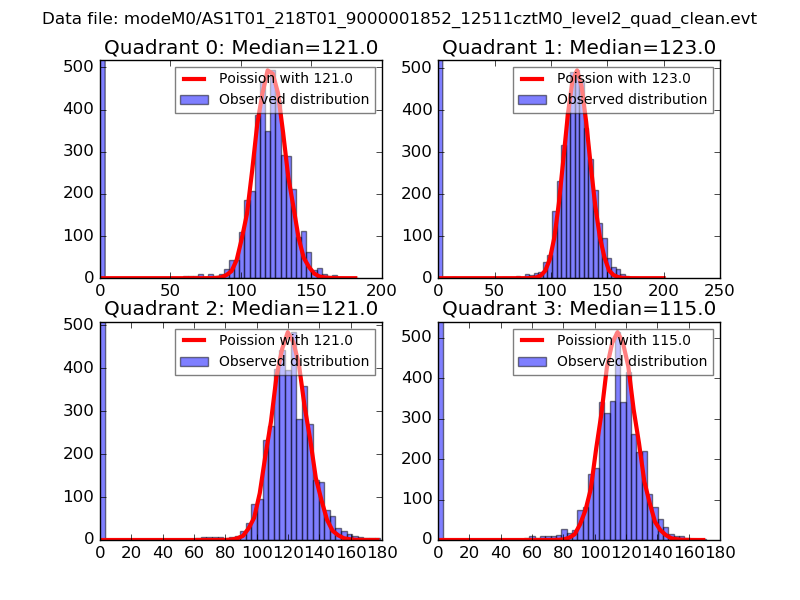 |
 |
| Quadrant-wise count rates Data is divided into 100 sec bins |
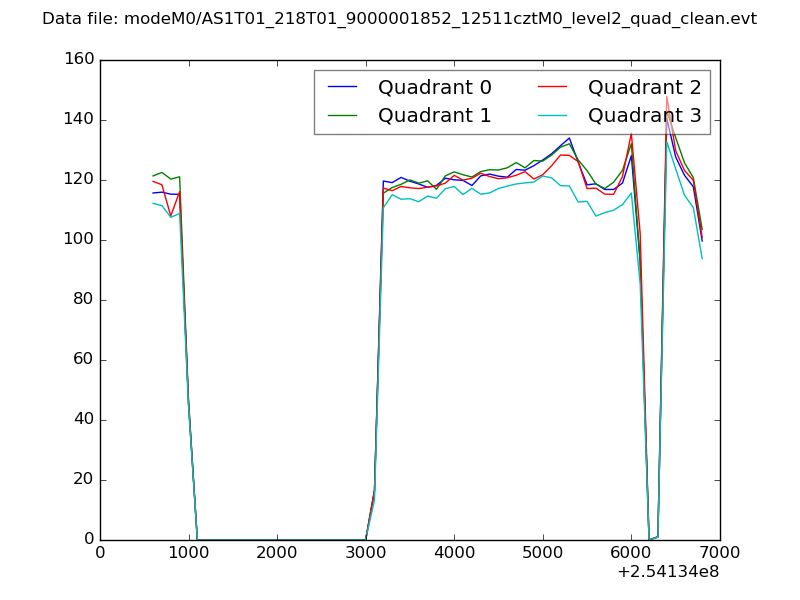 |
|
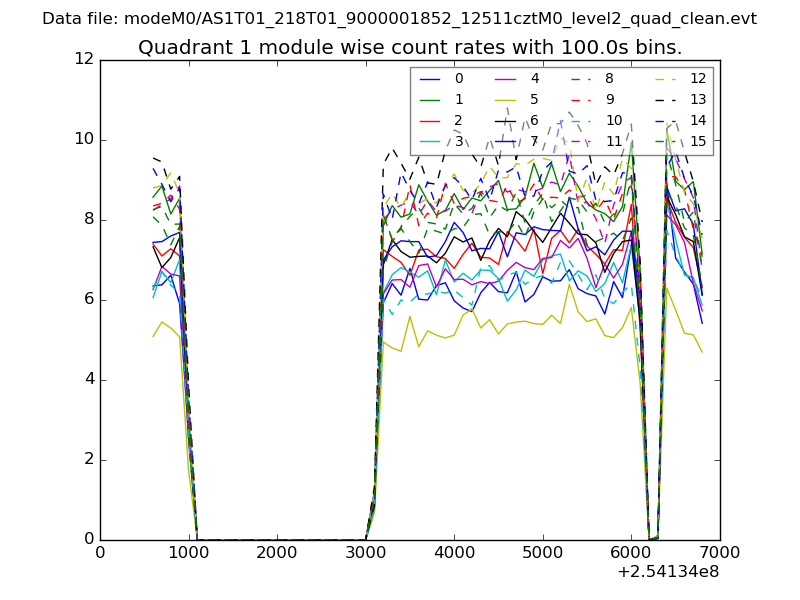
| Module-wise count rates for Quadrant A Data is divided into 100 sec bins |
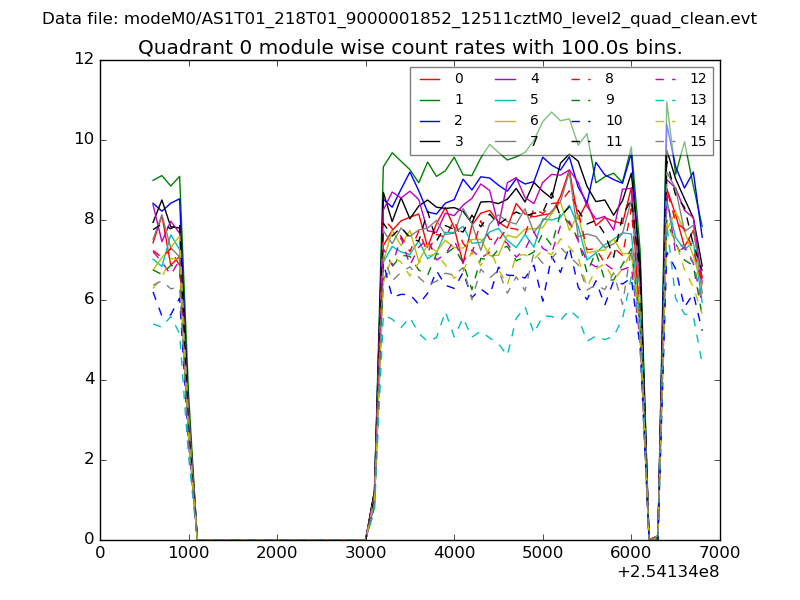 |
 |
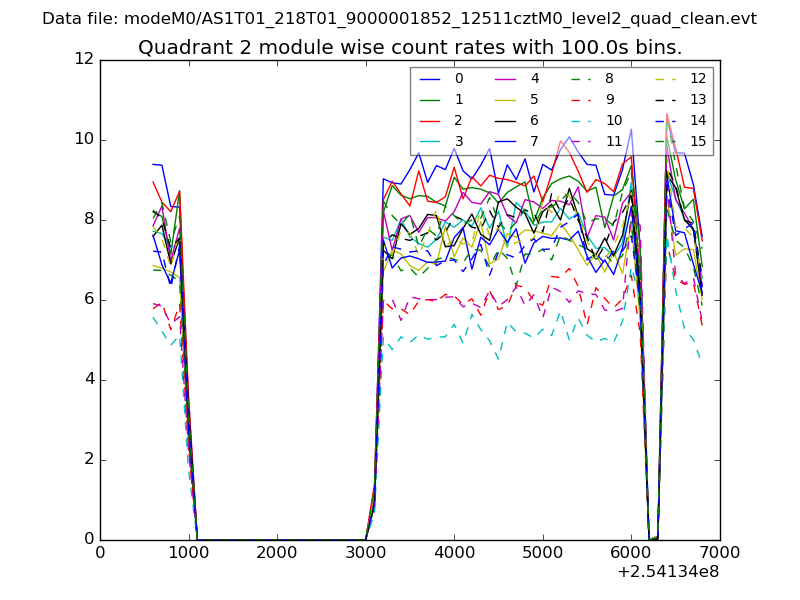
| Module-wise count rates for Quadrant B Data is divided into 100 sec bins |
 |
 |
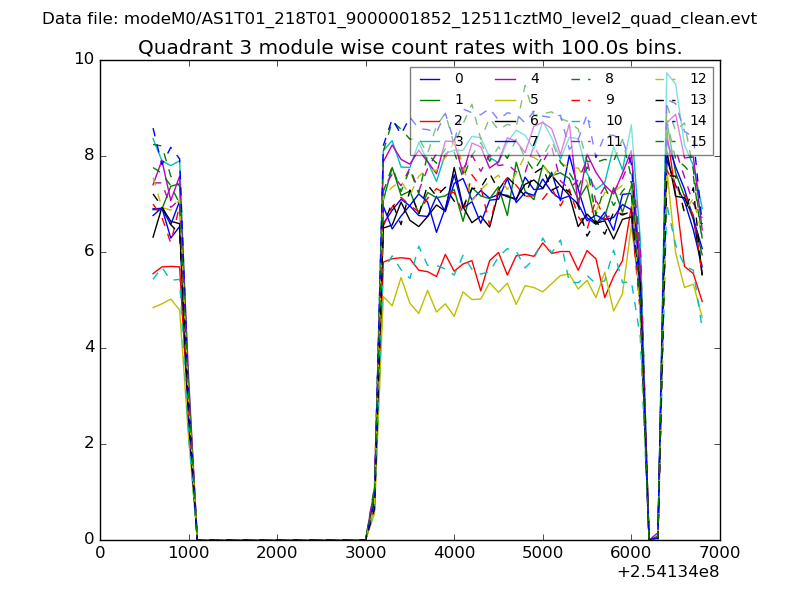
| Module-wise count rates for Quadrant C Data is divided into 100 sec bins |
 |
 |
| Module-wise count rates for Quadrant D Data is divided into 100 sec bins |
 |
 |
| Parameter | Plot |
|---|---|
| CZT HV Monitor | 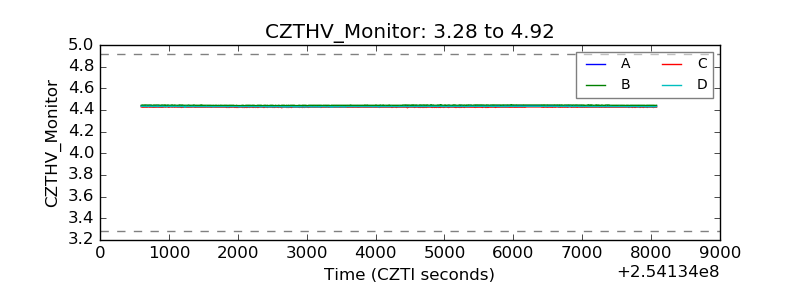 |
| D_VDD | 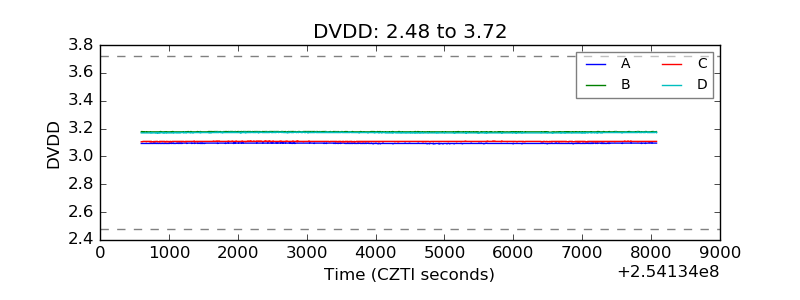 |
| Temperature 1 |  |
| Veto HV Monitor | 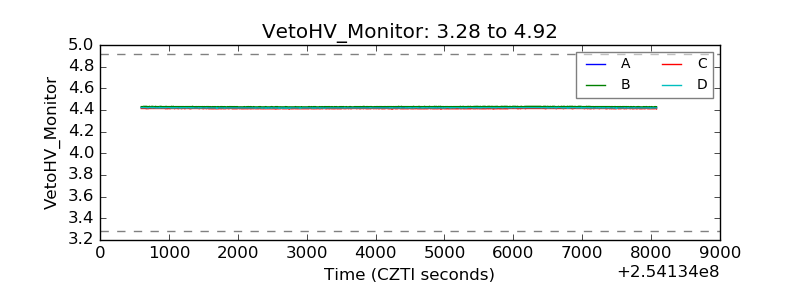 |
| Veto LLD | 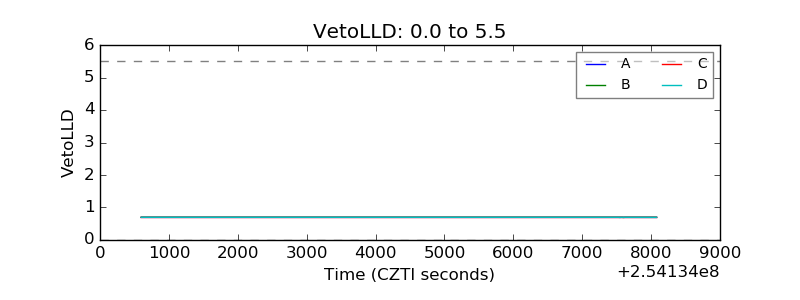 |
| Alpha Counter |  |
| _CPM_Rate | 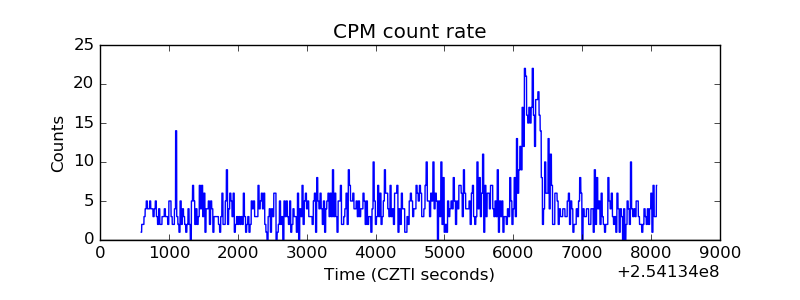 |
| CZT Counter | 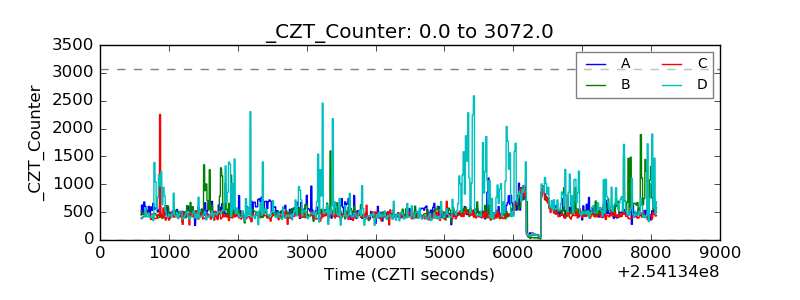 |
| +2.5 Volts monitor |  |
| +5 Volts monitor |  |
| _ROLL_ROT |  |
| _Roll_DEC | 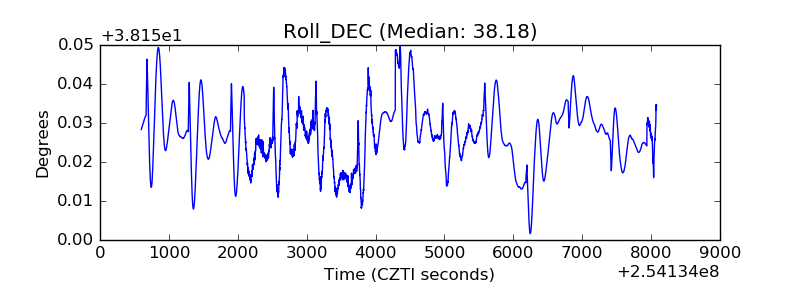 |
| _Roll_RA | 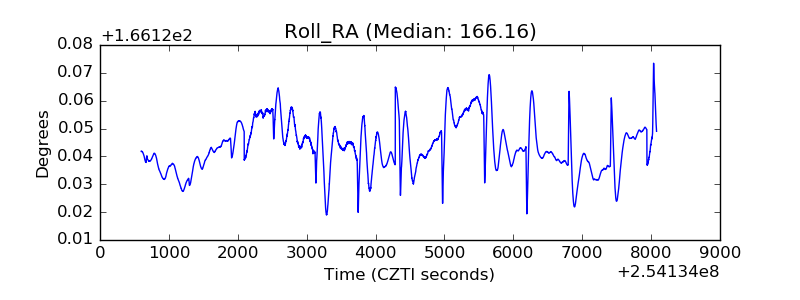 |
| Veto Counter | 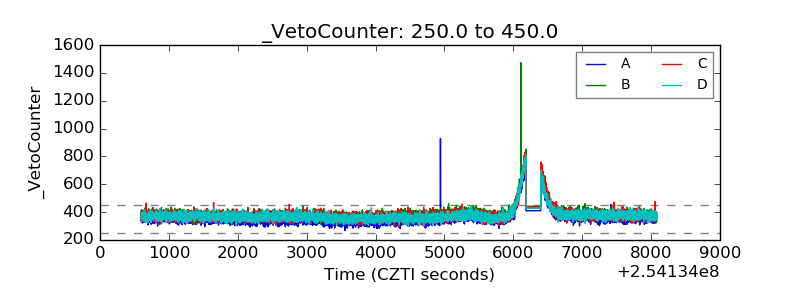 |