| Param | Original file | Final file |
|---|---|---|
| Filename | modeM0/AS1T01_218T01_9000001852_12518cztM0_level2.evt | modeM0/AS1T01_218T01_9000001852_12518cztM0_level2_quad_clean.evt |
| Size (bytes) | 469,995,840 | 103,394,880 |
| Size | 448.2 MB | 98.6 MB |
| Events in quadrant A | 3,406,103 | 672,716 |
| Events in quadrant B | 3,717,496 | 693,936 |
| Events in quadrant C | 3,008,162 | 685,072 |
| Events in quadrant D | 3,676,065 | 641,758 |
| Mode M0 | |||
|---|---|---|---|
| Quadrant | BADHDUFLAG | Total packets | Discarded packets |
| A | 0 | 14232 | 3 |
| B | 0 | 15276 | 2 |
| C | 0 | 13235 | 2 |
| D | 0 | 14993 | 2 |
| Mode SS | |||
|---|---|---|---|
| Quadrant | BADHDUFLAG | Total packets | Discarded packets |
| A | 0 | 128 | 0 |
| B | 0 | 128 | 0 |
| C | 0 | 128 | 0 |
| D | 0 | 128 | 0 |
| Mode M9 | |||
|---|---|---|---|
| Quadrant | BADHDUFLAG | Total packets | Discarded packets |
| A | 0 | 13 | 0 |
| B | 0 | 13 | 0 |
| C | 0 | 13 | 0 |
| D | 0 | 14 | 0 |
| Quadrant | Total seconds | Saturated seconds | Saturation percentage |
|---|---|---|---|
| A | 6273 | 37 | 0.589829% |
| B | 6273 | 167 | 2.662203% |
| C | 6273 | 15 | 0.239120% |
| D | 6273 | 78 | 1.243424% |
Noise dominated data is calculated using 1-second bins in cleaned event files. If a bin has >2000 counts, and if more than 50% of those come from <1% of pixels, then it is considered to be noise-dominated and hence unusable.
| Quadrant | # 1 sec bins | Bins with >0 counts | Bins with >2000 counts | High rate bins dominated by noise | Noise dominated (total time) | Noise dominated (detector-on time) | Marked lightcurve |
|---|---|---|---|---|---|---|---|
| A | 7539 | 6275 | 0 | 0 | 0.00% | 0.00% | 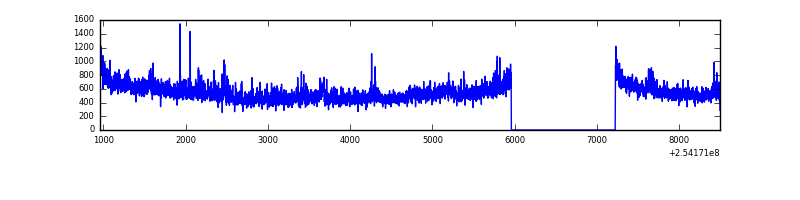 |
| B | 7539 | 6275 | 75 | 75 | 0.99% | 1.20% | 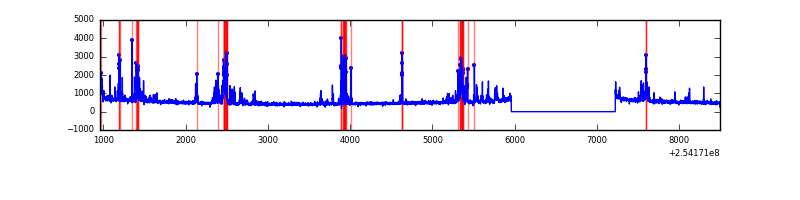 |
| C | 7539 | 6275 | 0 | 0 | 0.00% | 0.00% | 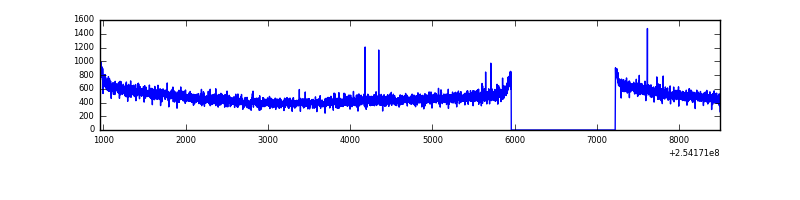 |
| D | 7539 | 6275 | 31 | 31 | 0.41% | 0.49% | 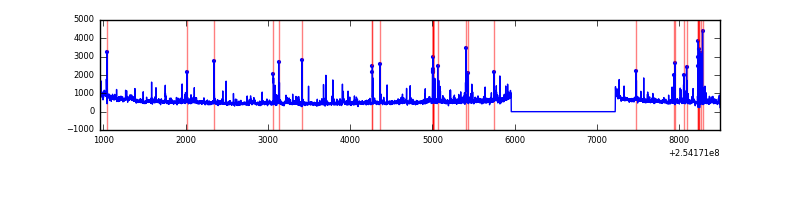 |
Top three noisy pixels from each quadrant. If the there are fewer than three noisy pixels in the level2.evt file, extra rows are filled as -1
| Pixel properties | Quadrant properties | ||||||
|---|---|---|---|---|---|---|---|
| Quadrant | DetID | PixID | Counts | Sigma | Mean | Median | Sigma |
| A | 12 | 189 | 140320 | 894.94 | 778 | 763 | 155.9 |
| A | 1 | 162 | 99941 | 636.0 | 778 | 763 | 155.9 |
| A | 1 | 178 | 58468 | 370.05 | 778 | 763 | 155.9 |
| B | 4 | 239 | 588986 | 4018.47 | 785 | 766 | 146.4 |
| B | 0 | 214 | 21990 | 144.99 | 785 | 766 | 146.4 |
| B | 12 | 111 | 16301 | 106.13 | 785 | 766 | 146.4 |
| C | 13 | 61 | 5589 | 27.04 | 770 | 774 | 178.1 |
| C | 14 | 234 | 3678 | 16.3 | 770 | 774 | 178.1 |
| C | 12 | 4 | 2799 | 11.37 | 770 | 774 | 178.1 |
| D | 1 | 52 | 576465 | 3194.86 | 751 | 730 | 180.2 |
| D | 7 | 71 | 76816 | 422.22 | 751 | 730 | 180.2 |
| D | 13 | 104 | 47329 | 258.59 | 751 | 730 | 180.2 |
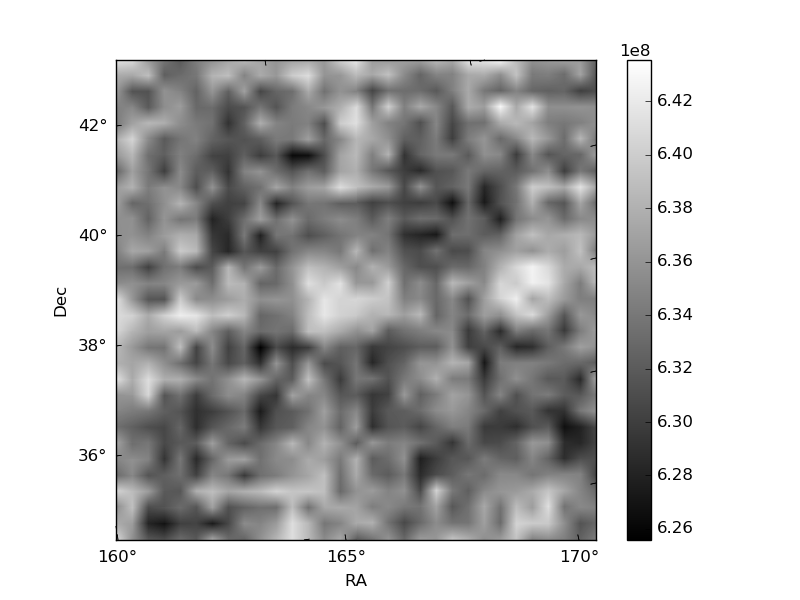
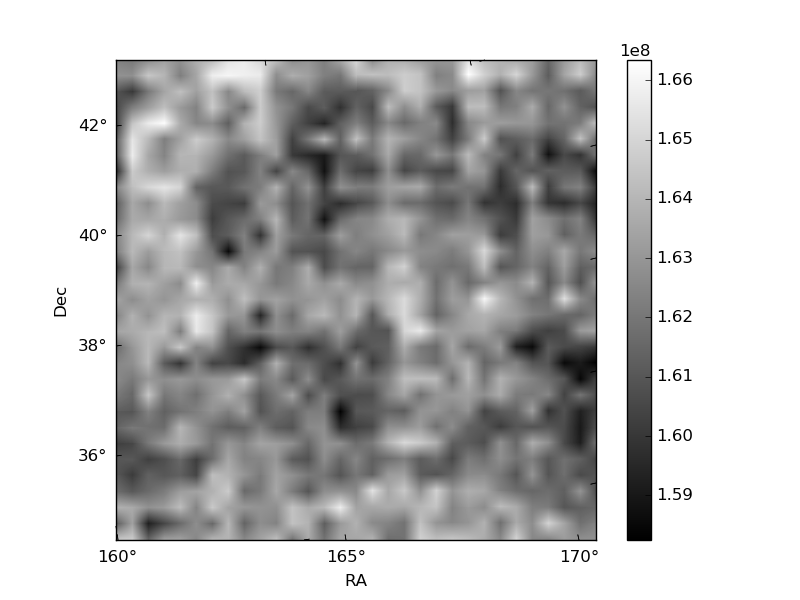
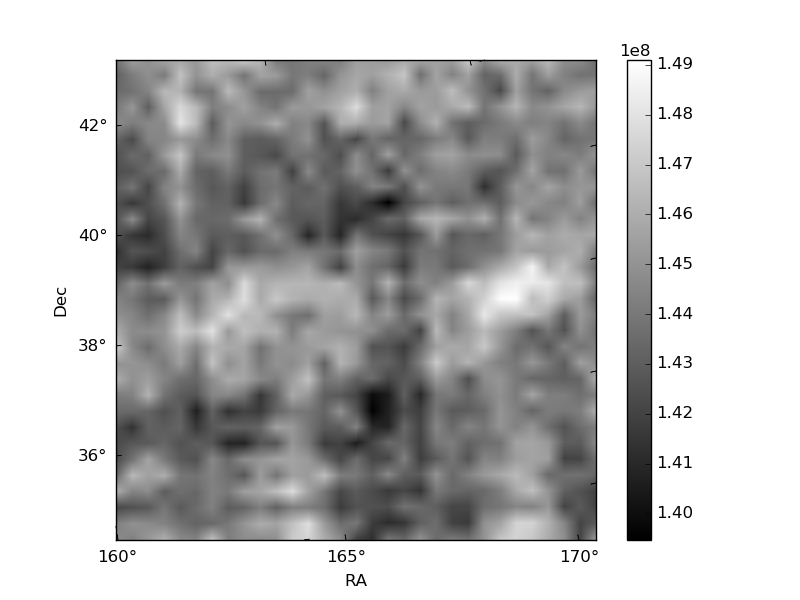
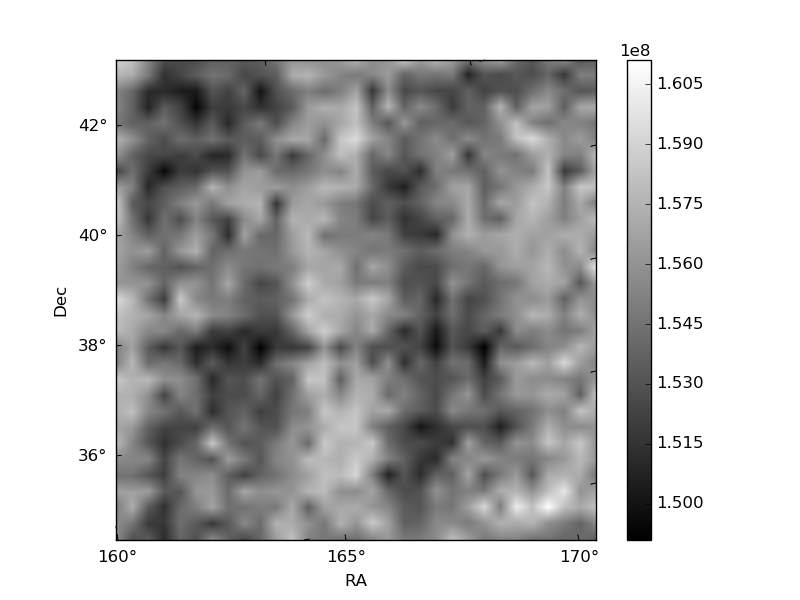
Histogram calculated using DETX and DETY for each event in the final _common_clean file
| Quadrant A | 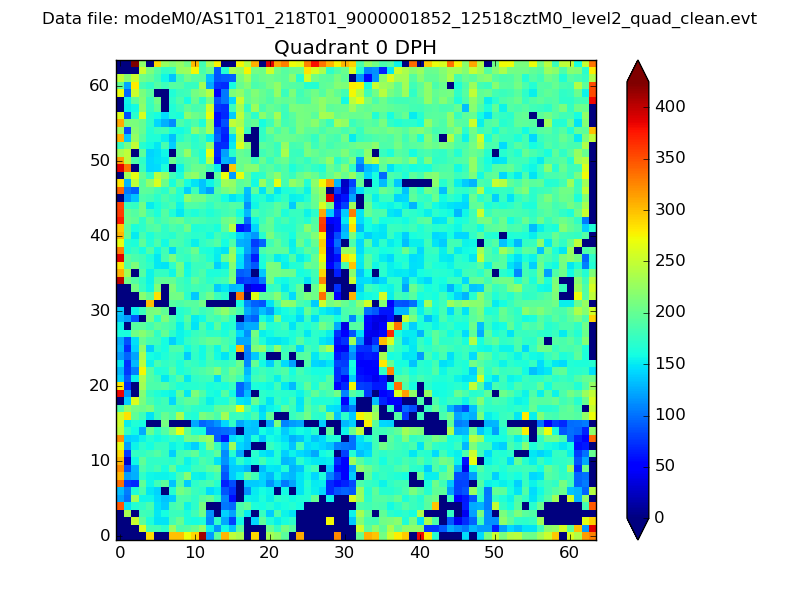 |
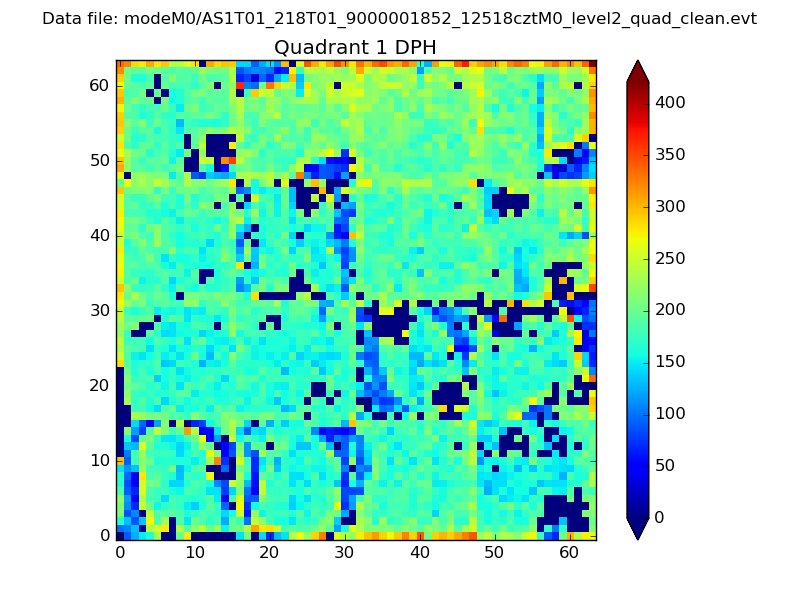 |
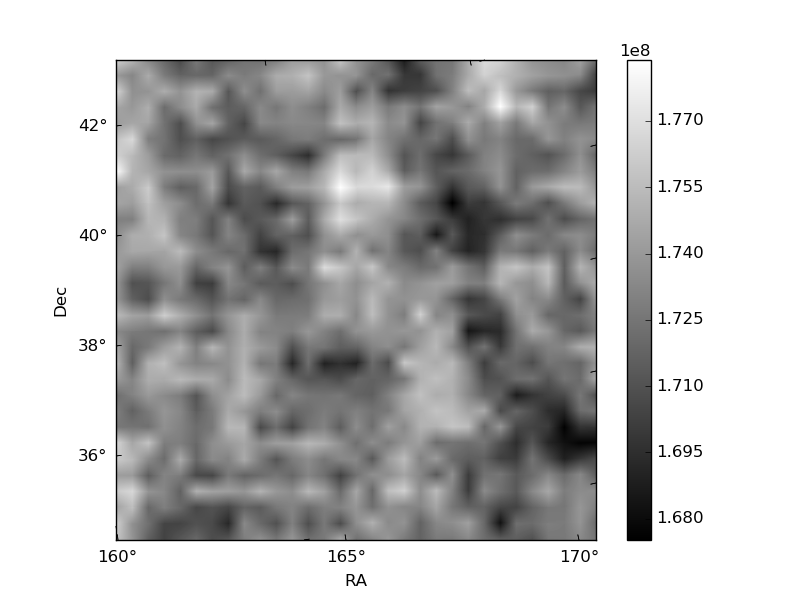
Quadrant B |
|---|---|---|---|
| Quadrant D | 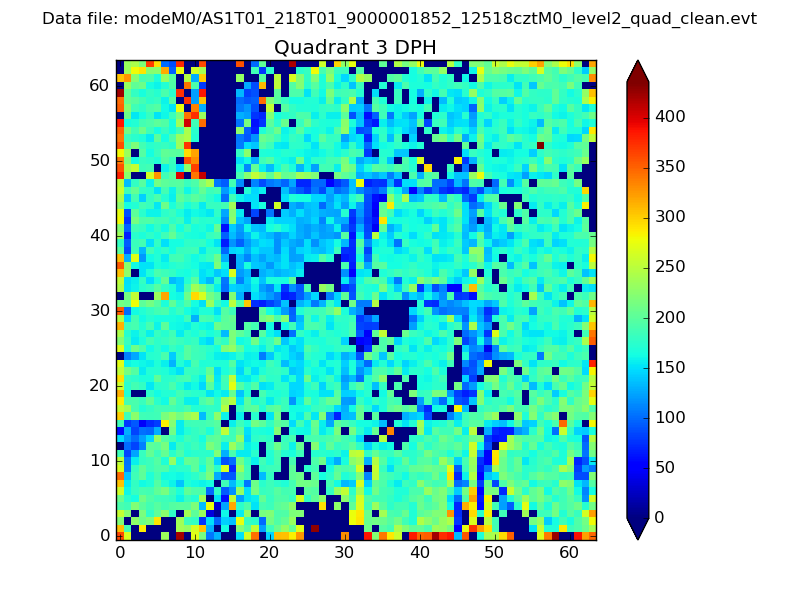 |
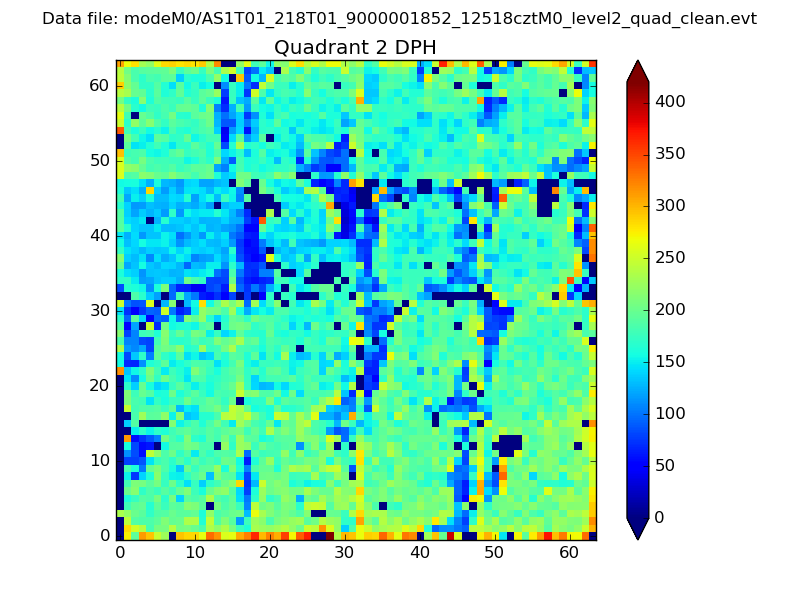 |
Quadrant C |
| Plot type | Count rate plots | Images |
|---|---|---|
| Comparison with Poisson distribution Blue bars denote a histogram of data divided into 1 sec bins. Red curve is a Poisson curve with rate = median count rate of data. |
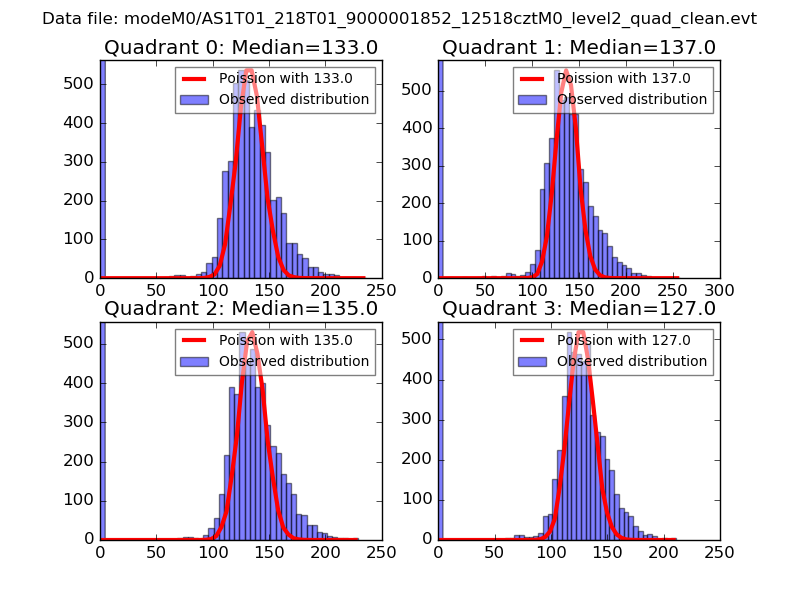 |
 |
| Quadrant-wise count rates Data is divided into 100 sec bins |
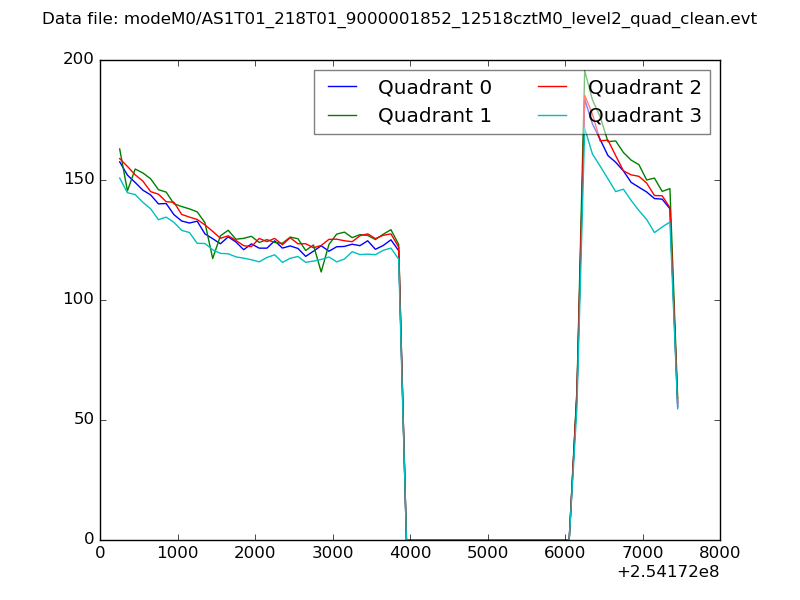 |
|
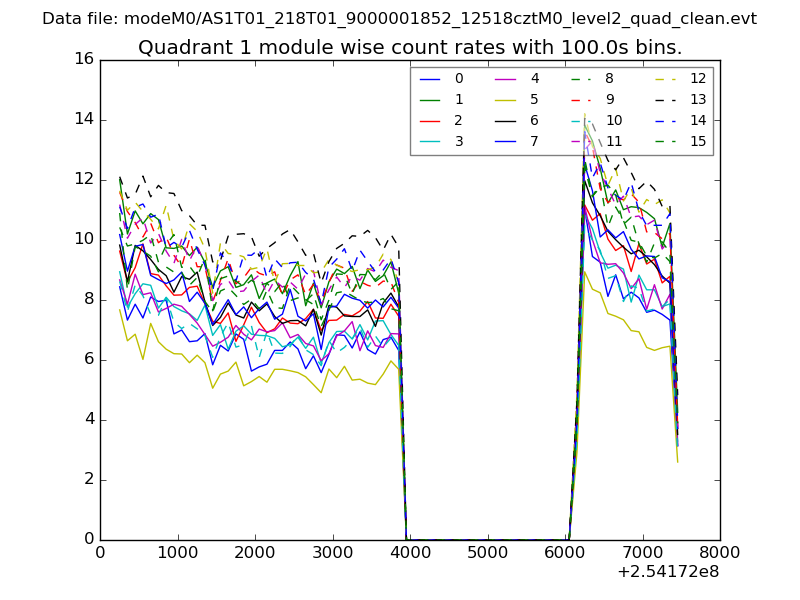
| Module-wise count rates for Quadrant A Data is divided into 100 sec bins |
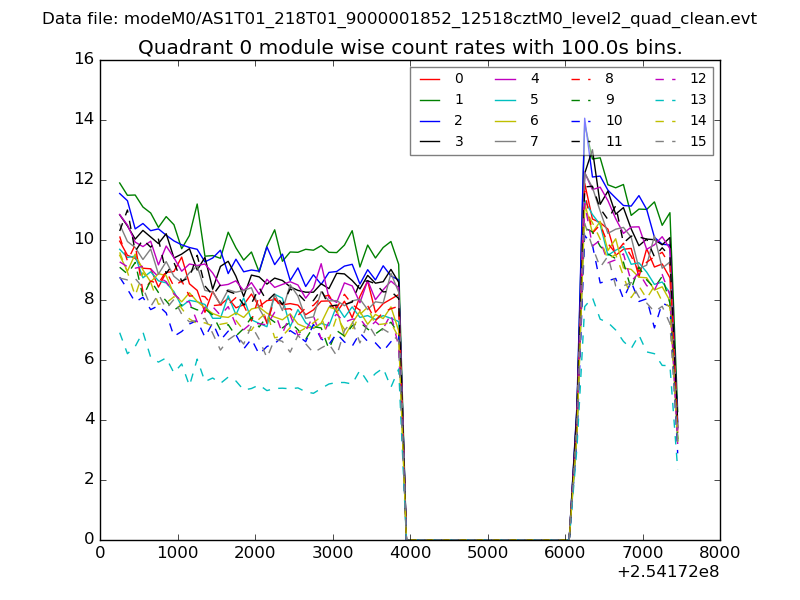 |
 |
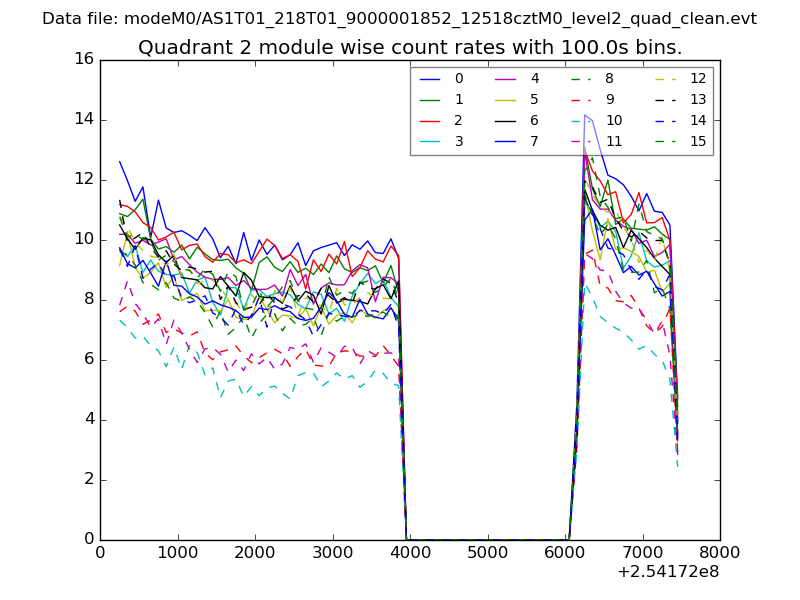
| Module-wise count rates for Quadrant B Data is divided into 100 sec bins |
 |
 |
| Module-wise count rates for Quadrant C Data is divided into 100 sec bins |
 |
 |
| Module-wise count rates for Quadrant D Data is divided into 100 sec bins |
 |
 |
| Parameter | Plot |
|---|---|
| CZT HV Monitor | 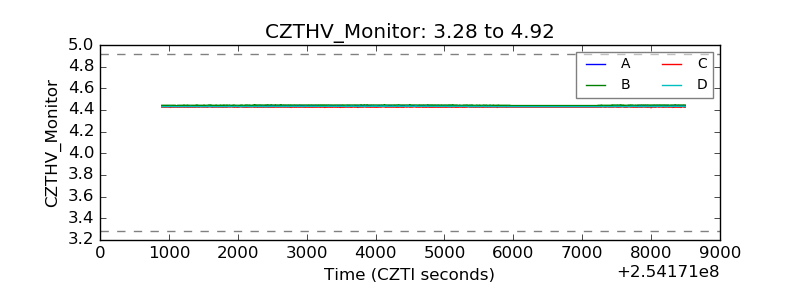 |
| D_VDD | 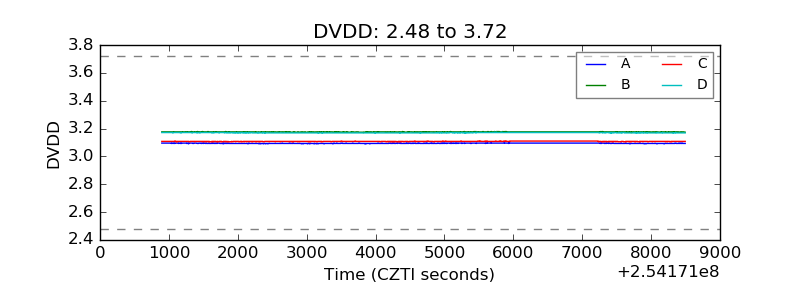 |
| Temperature 1 | 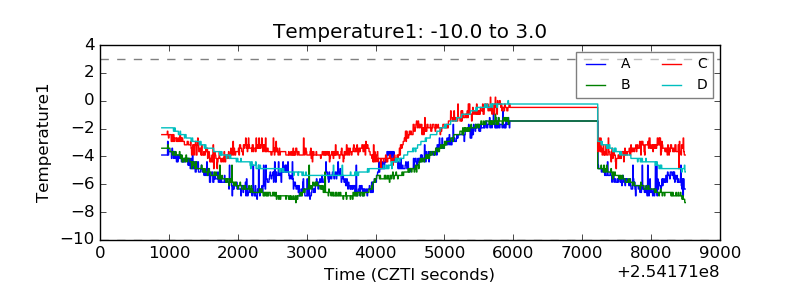 |
| Veto HV Monitor | 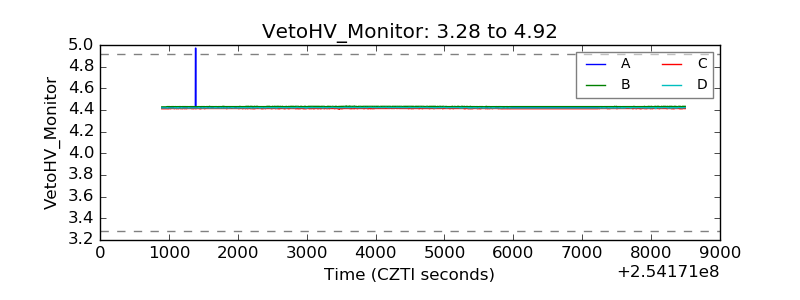 |
| Veto LLD |  |
| Alpha Counter | 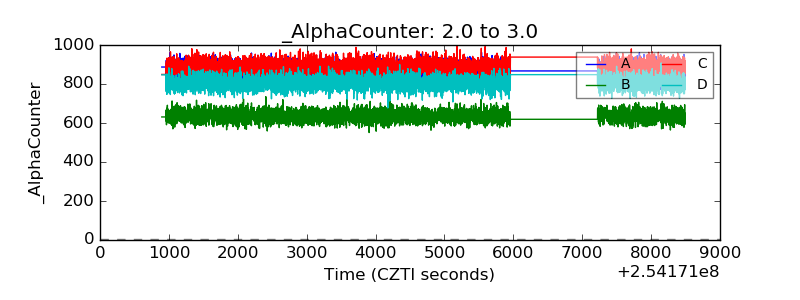 |
| _CPM_Rate | 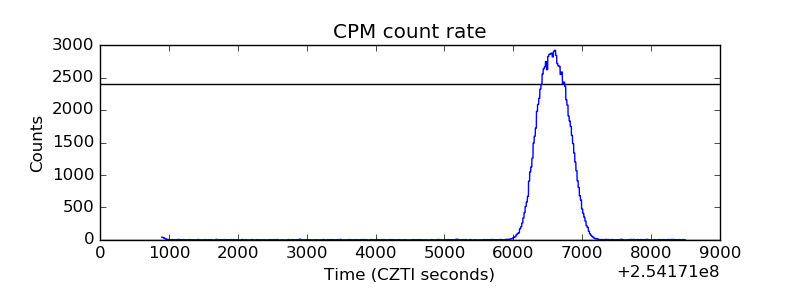 |
| CZT Counter | 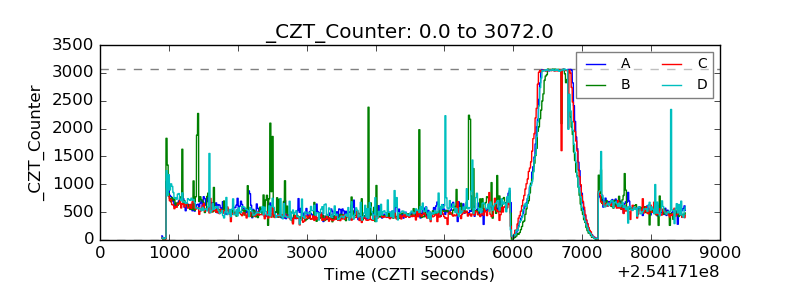 |
| +2.5 Volts monitor |  |
| +5 Volts monitor |  |
| _ROLL_ROT | 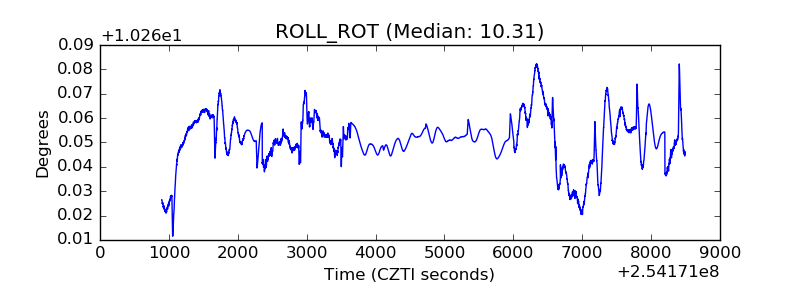 |
| _Roll_DEC | 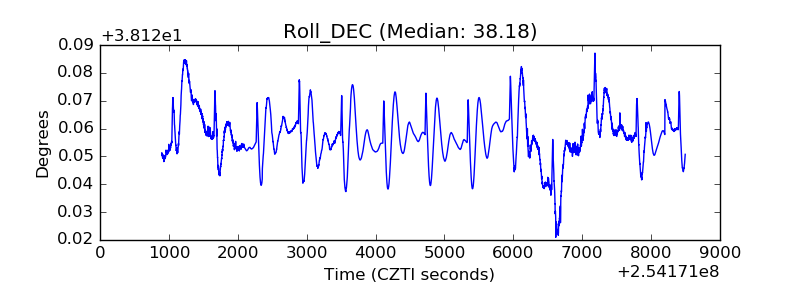 |
| _Roll_RA | 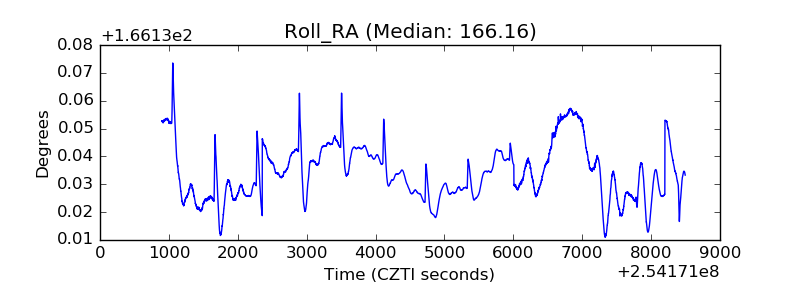 |
| Veto Counter | 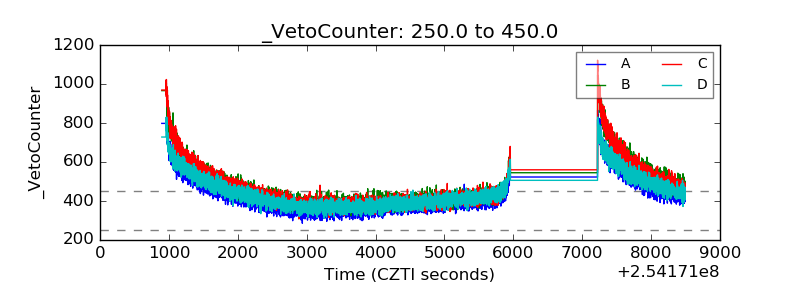 |