| Param | Original file | Final file |
|---|---|---|
| Filename | modeM0/AS1T01_218T01_9000001852_12520cztM0_level2.evt | modeM0/AS1T01_218T01_9000001852_12520cztM0_level2_quad_clean.evt |
| Size (bytes) | 451,635,840 | 96,788,160 |
| Size | 430.7 MB | 92.3 MB |
| Events in quadrant A | 3,219,163 | 627,182 |
| Events in quadrant B | 3,402,951 | 652,993 |
| Events in quadrant C | 2,947,258 | 638,354 |
| Events in quadrant D | 3,697,964 | 590,583 |
| Mode M0 | |||
|---|---|---|---|
| Quadrant | BADHDUFLAG | Total packets | Discarded packets |
| A | 0 | 13413 | 2 |
| B | 0 | 14062 | 2 |
| C | 0 | 12782 | 2 |
| D | 0 | 14907 | 2 |
| Mode SS | |||
|---|---|---|---|
| Quadrant | BADHDUFLAG | Total packets | Discarded packets |
| A | 0 | 126 | 0 |
| B | 0 | 126 | 0 |
| C | 0 | 126 | 0 |
| D | 0 | 126 | 0 |
| Mode M9 | |||
|---|---|---|---|
| Quadrant | BADHDUFLAG | Total packets | Discarded packets |
| A | 0 | 26 | 0 |
| B | 0 | 26 | 0 |
| C | 0 | 26 | 0 |
| D | 0 | 26 | 0 |
| Quadrant | Total seconds | Saturated seconds | Saturation percentage |
|---|---|---|---|
| A | 6040 | 30 | 0.496689% |
| B | 6040 | 123 | 2.036424% |
| C | 6040 | 24 | 0.397351% |
| D | 6040 | 84 | 1.390728% |
Noise dominated data is calculated using 1-second bins in cleaned event files. If a bin has >2000 counts, and if more than 50% of those come from <1% of pixels, then it is considered to be noise-dominated and hence unusable.
| Quadrant | # 1 sec bins | Bins with >0 counts | Bins with >2000 counts | High rate bins dominated by noise | Noise dominated (total time) | Noise dominated (detector-on time) | Marked lightcurve |
|---|---|---|---|---|---|---|---|
| A | 8641 | 6043 | 0 | 0 | 0.00% | 0.00% | 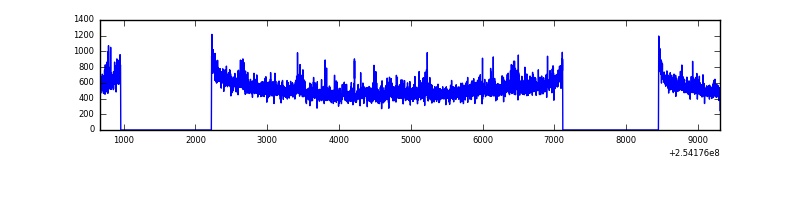 |
| B | 8641 | 6043 | 34 | 34 | 0.39% | 0.56% | 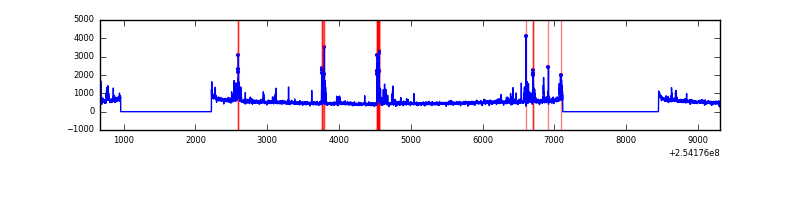 |
| C | 8641 | 6043 | 0 | 0 | 0.00% | 0.00% | 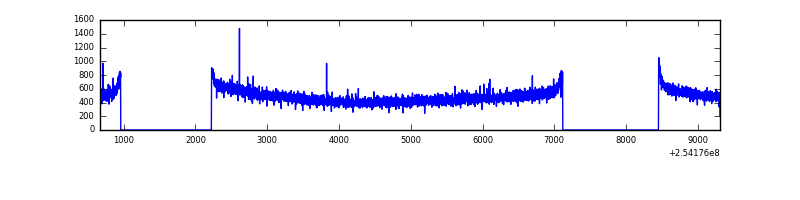 |
| D | 8641 | 6043 | 35 | 35 | 0.41% | 0.58% | 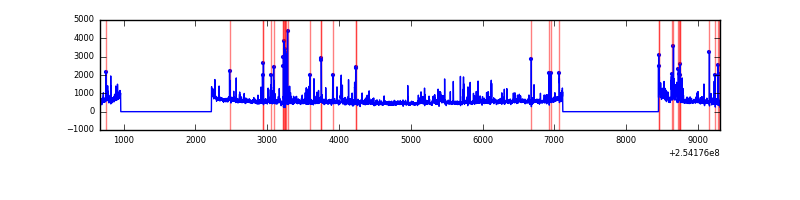 |
Top three noisy pixels from each quadrant. If the there are fewer than three noisy pixels in the level2.evt file, extra rows are filled as -1
| Pixel properties | Quadrant properties | ||||||
|---|---|---|---|---|---|---|---|
| Quadrant | DetID | PixID | Counts | Sigma | Mean | Median | Sigma |
| A | 12 | 189 | 122055 | 787.52 | 766 | 751 | 154.0 |
| A | 1 | 162 | 56787 | 363.79 | 766 | 751 | 154.0 |
| A | 1 | 178 | 31442 | 199.25 | 766 | 751 | 154.0 |
| B | 4 | 239 | 320405 | 2205.61 | 776 | 760 | 144.9 |
| B | 0 | 214 | 33756 | 227.68 | 776 | 760 | 144.9 |
| B | 12 | 111 | 15856 | 104.17 | 776 | 760 | 144.9 |
| C | 13 | 61 | 5507 | 27.21 | 755 | 760 | 174.4 |
| C | 14 | 234 | 2745 | 11.38 | 755 | 760 | 174.4 |
| C | 12 | 4 | 2555 | 10.29 | 755 | 760 | 174.4 |
| D | 1 | 52 | 748784 | 4248.82 | 735 | 714 | 176.1 |
| D | 2 | 14 | 47116 | 263.55 | 735 | 714 | 176.1 |
| D | 8 | 195 | 30320 | 168.15 | 735 | 714 | 176.1 |
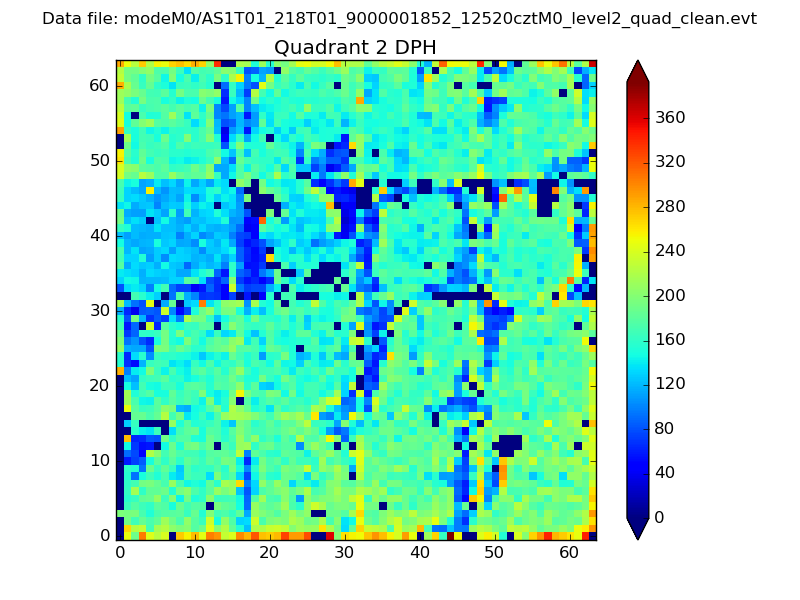
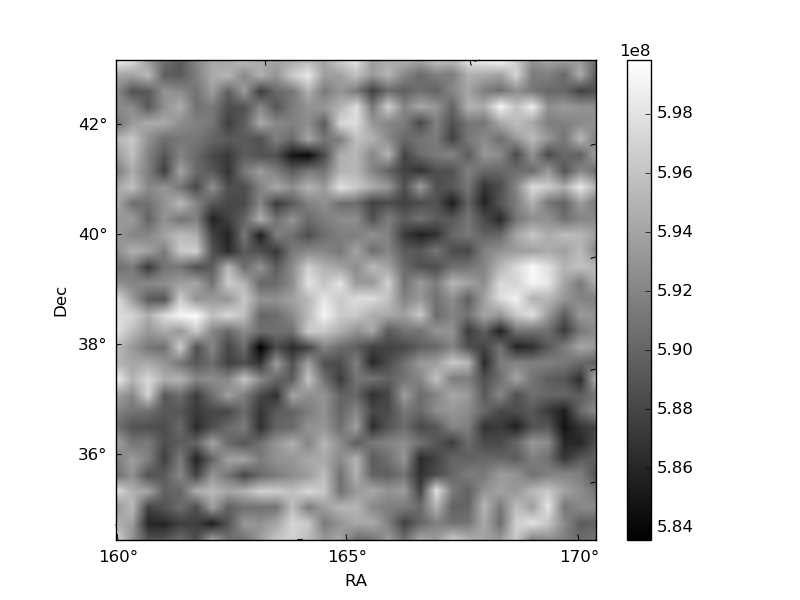
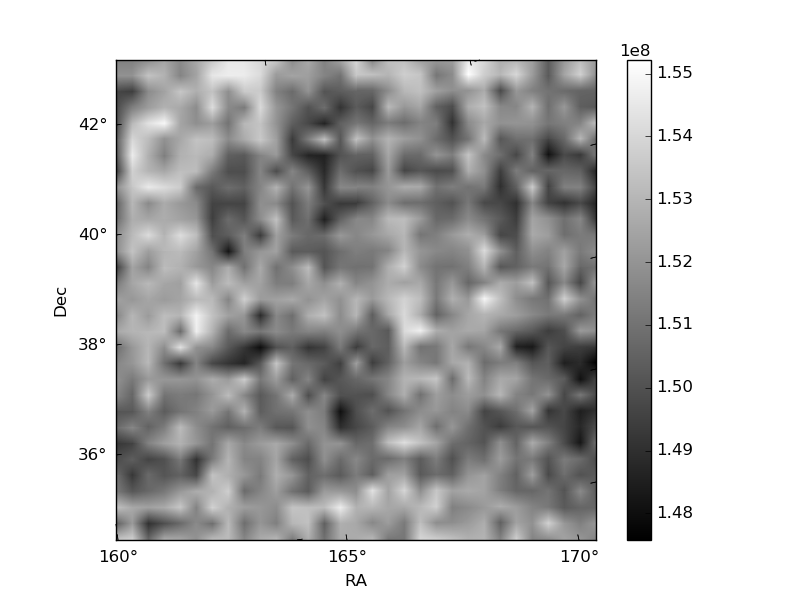
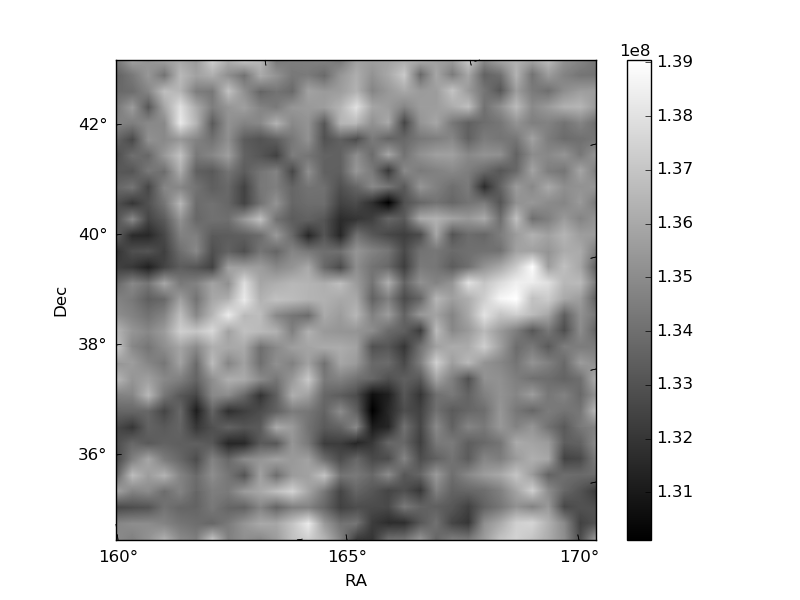
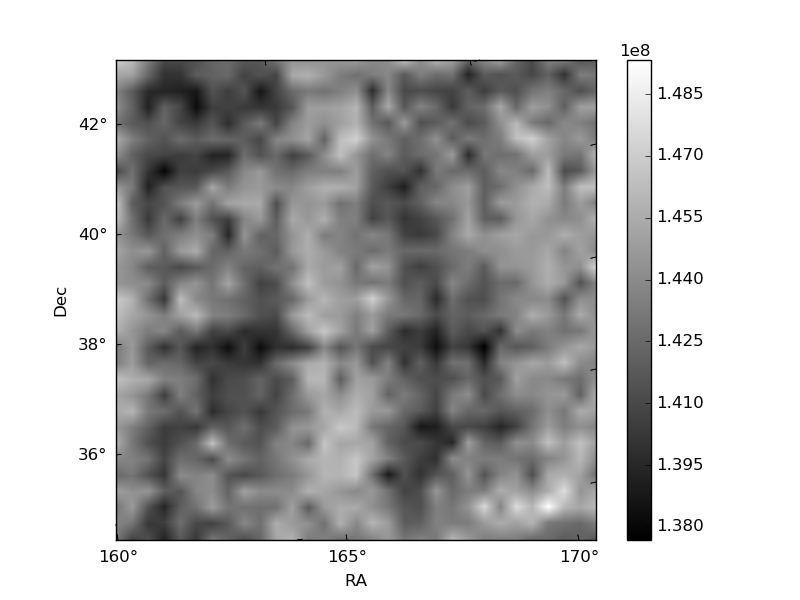
Histogram calculated using DETX and DETY for each event in the final _common_clean file
| Quadrant A | 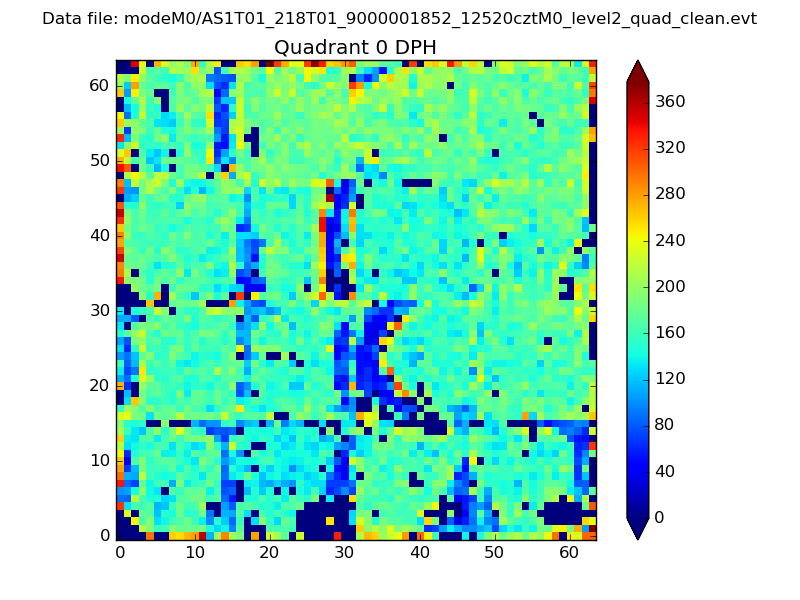 |
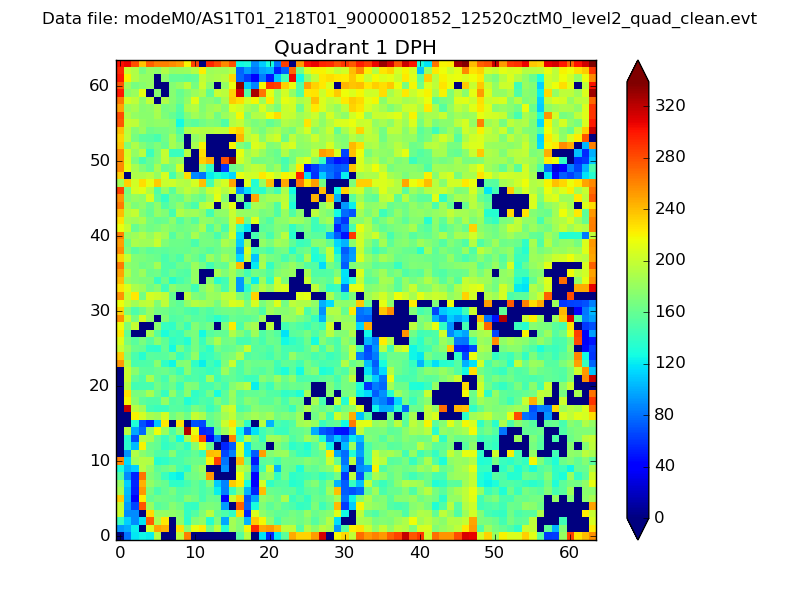 |
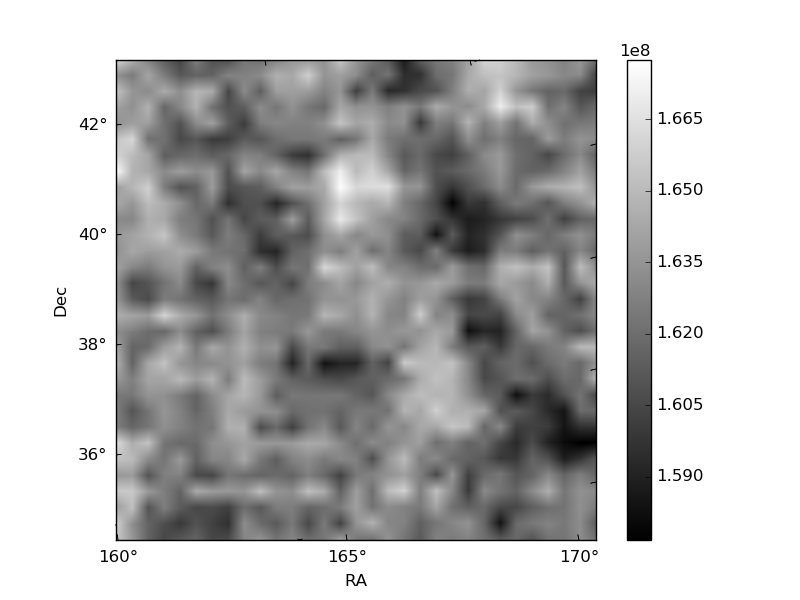
Quadrant B |
|---|---|---|---|
| Quadrant D | 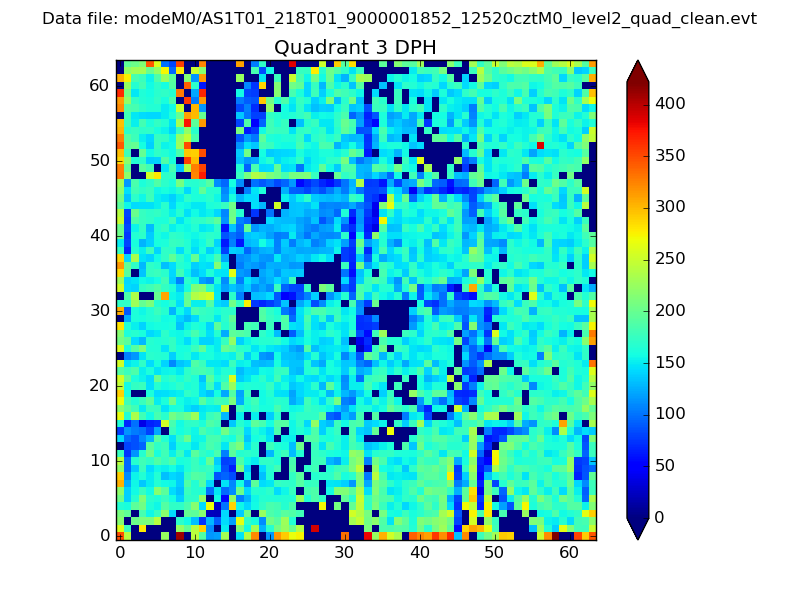 |
 |
Quadrant C |
| Plot type | Count rate plots | Images |
|---|---|---|
| Comparison with Poisson distribution Blue bars denote a histogram of data divided into 1 sec bins. Red curve is a Poisson curve with rate = median count rate of data. |
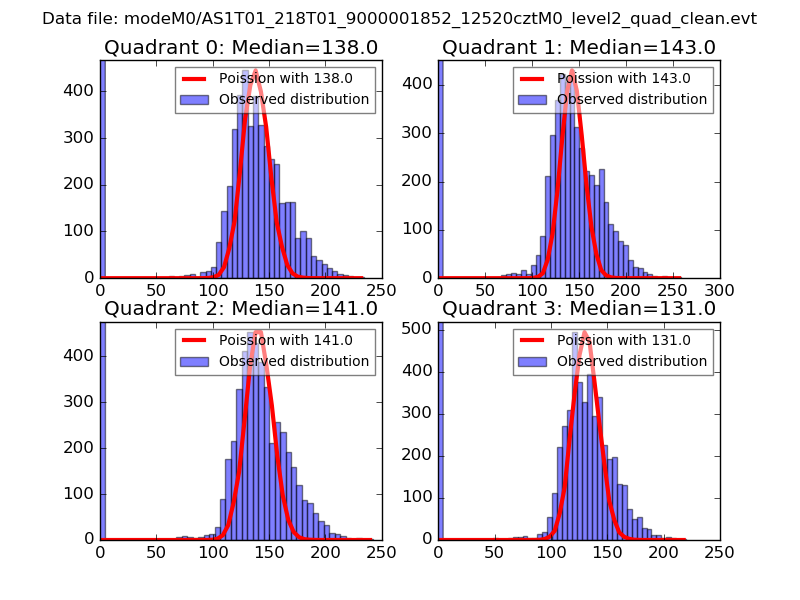 |
 |
| Quadrant-wise count rates Data is divided into 100 sec bins |
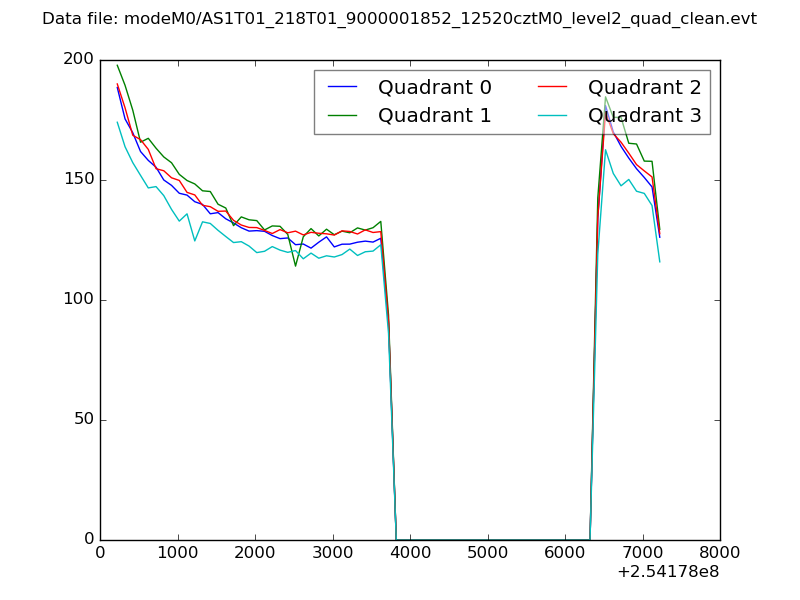 |
|
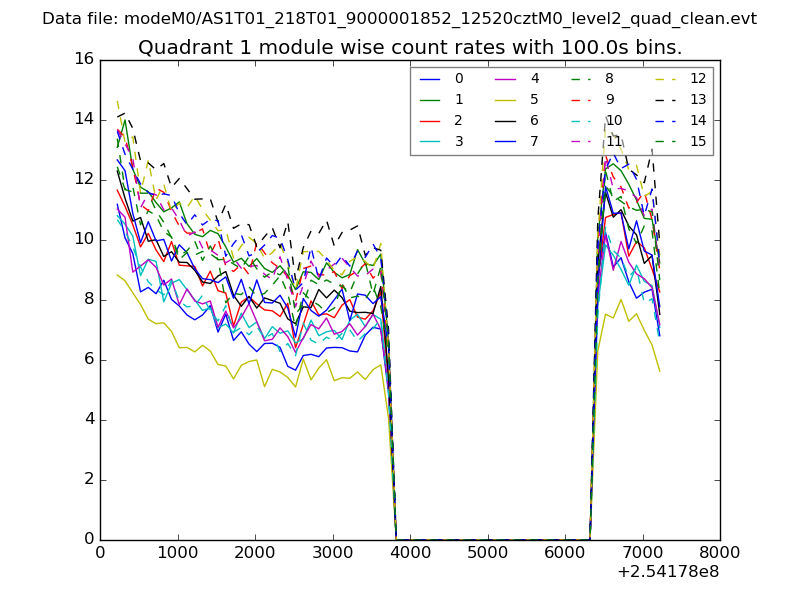
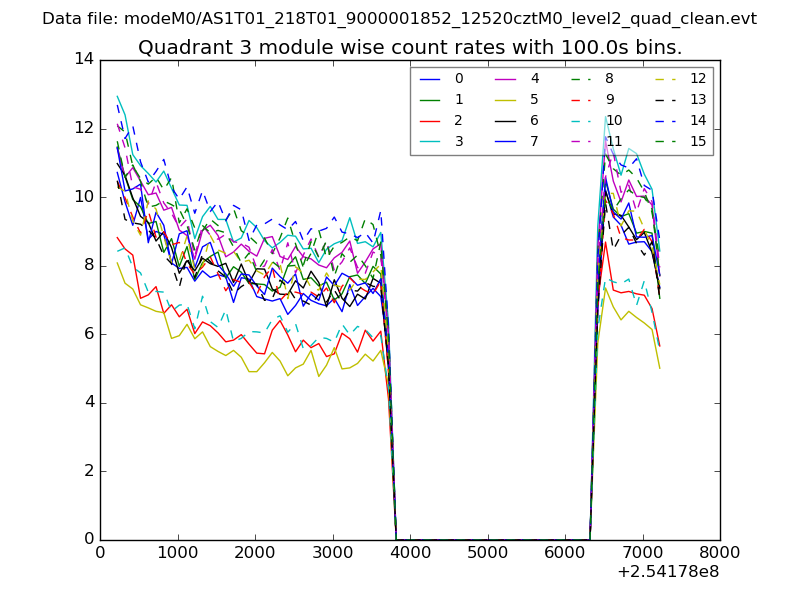
| Module-wise count rates for Quadrant A Data is divided into 100 sec bins |
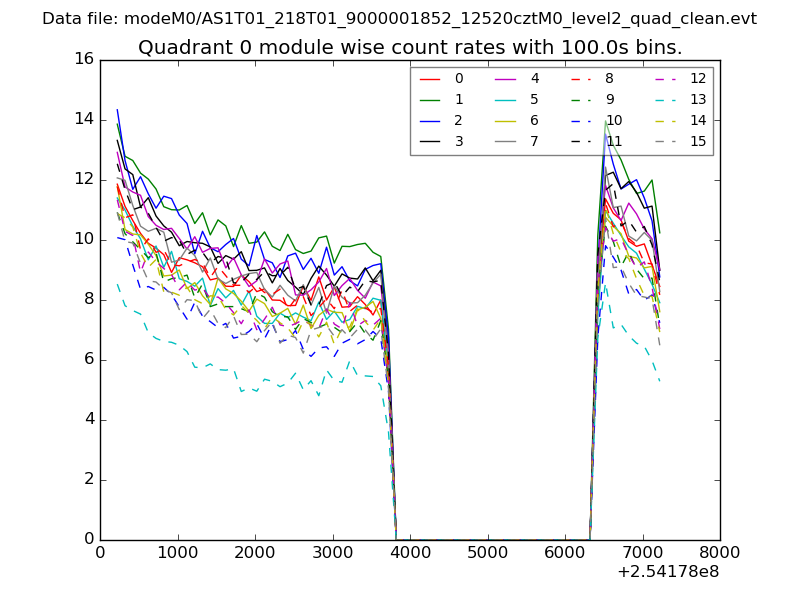 |
 |
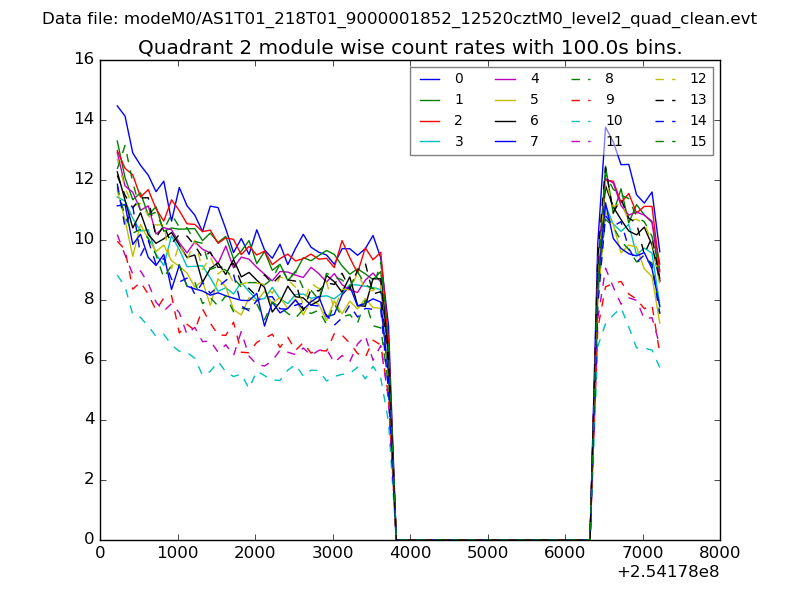
| Module-wise count rates for Quadrant B Data is divided into 100 sec bins |
 |
 |
| Module-wise count rates for Quadrant C Data is divided into 100 sec bins |
 |
 |
| Module-wise count rates for Quadrant D Data is divided into 100 sec bins |
 |
 |
| Parameter | Plot |
|---|---|
| CZT HV Monitor | 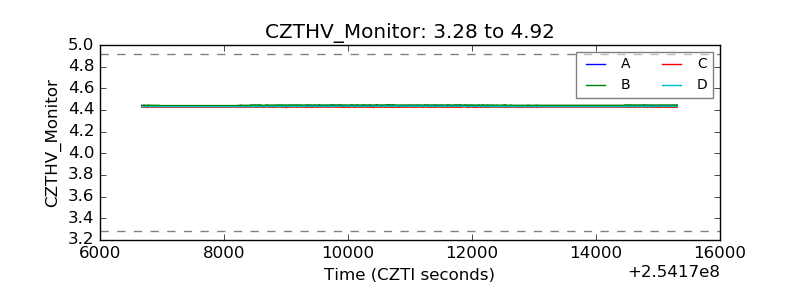 |
| D_VDD | 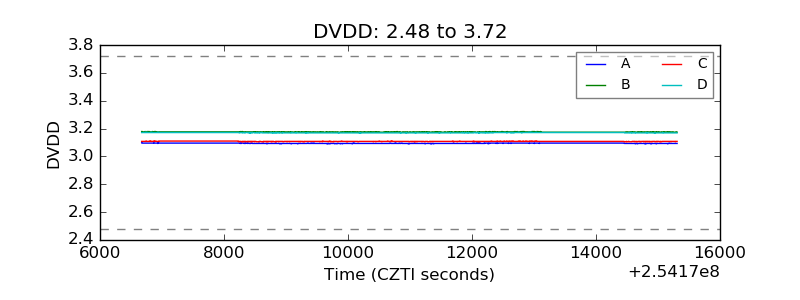 |
| Temperature 1 | 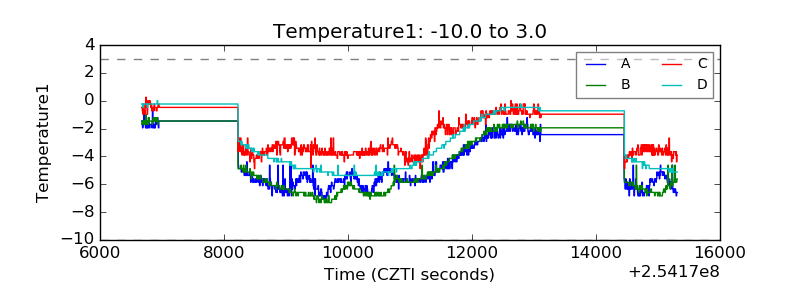 |
| Veto HV Monitor | 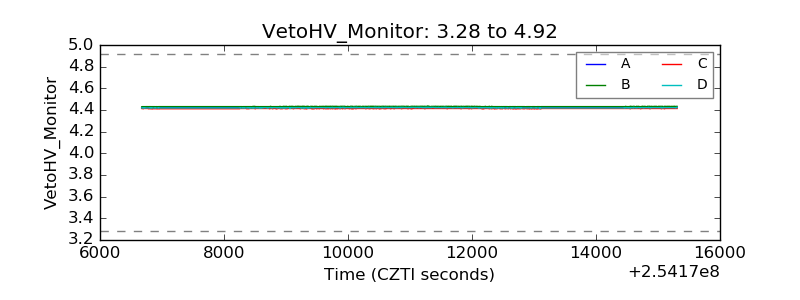 |
| Veto LLD | 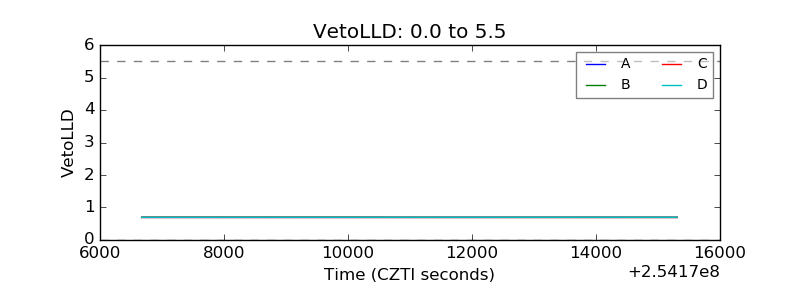 |
| Alpha Counter | 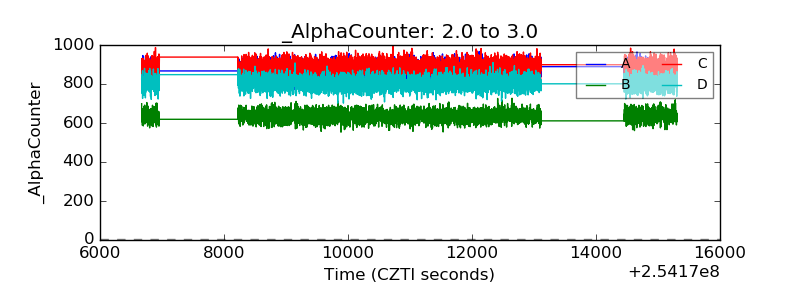 |
| _CPM_Rate | 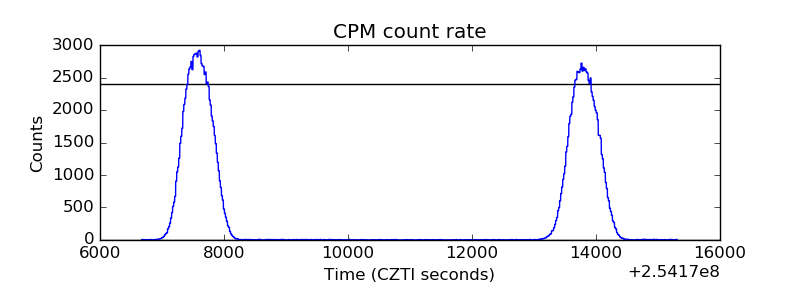 |
| CZT Counter | 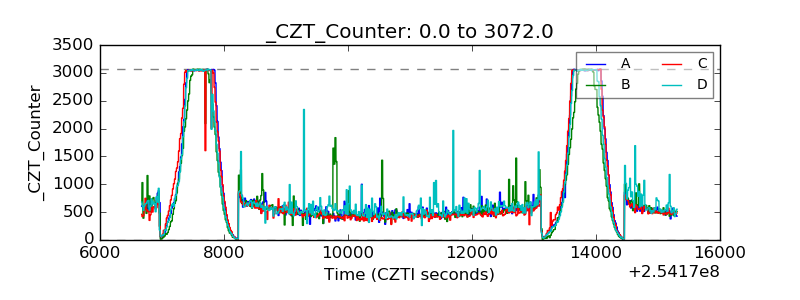 |
| +2.5 Volts monitor |  |
| +5 Volts monitor |  |
| _ROLL_ROT | 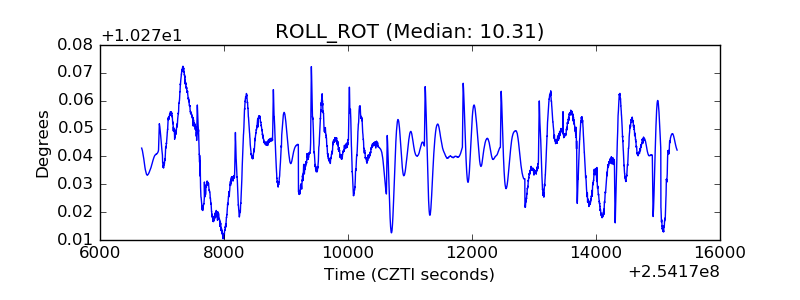 |
| _Roll_DEC | 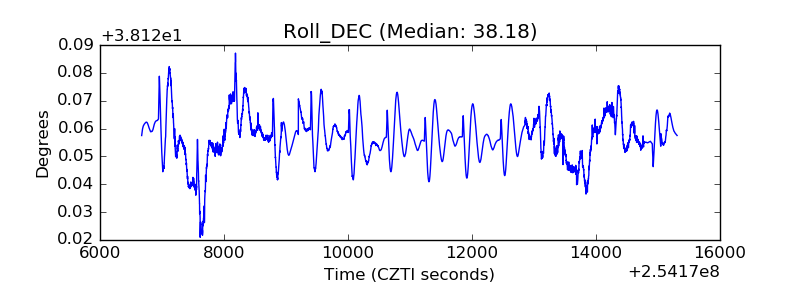 |
| _Roll_RA | 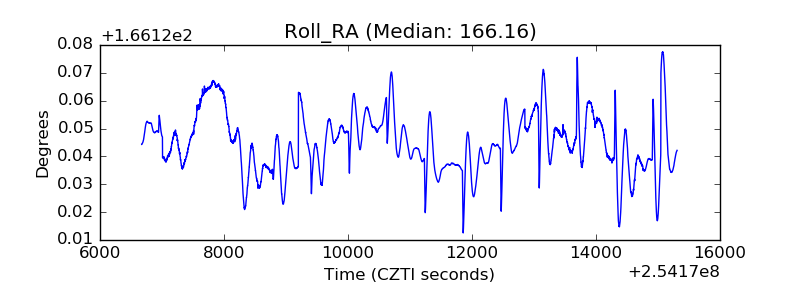 |
| Veto Counter | 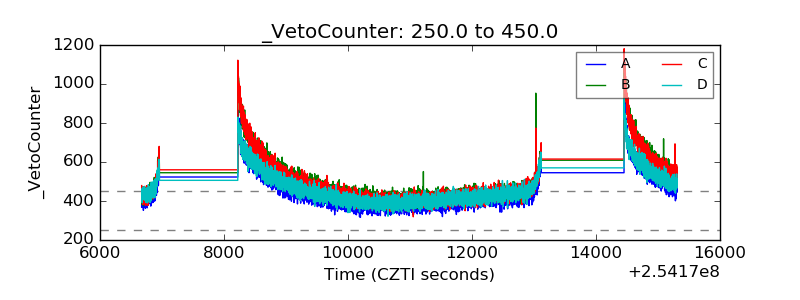 |