| Param | Original file | Final file |
|---|---|---|
| Filename | modeM0/AS1A04_230T01_9000001854_12523cztM0_level2.evt | modeM0/AS1A04_230T01_9000001854_12523cztM0_level2_quad_clean.evt |
| Size (bytes) | 431,196,480 | 86,503,680 |
| Size | 411.2 MB | 82.5 MB |
| Events in quadrant A | 3,317,457 | 547,843 |
| Events in quadrant B | 3,285,741 | 556,746 |
| Events in quadrant C | 2,927,086 | 543,442 |
| Events in quadrant D | 3,080,063 | 511,783 |
| Mode M9 | |||
|---|---|---|---|
| Quadrant | BADHDUFLAG | Total packets | Discarded packets |
| A | 0 | 6 | 0 |
| B | 0 | 6 | 0 |
| C | 0 | 6 | 0 |
| D | 0 | 6 | 0 |
| Mode SS | |||
|---|---|---|---|
| Quadrant | BADHDUFLAG | Total packets | Discarded packets |
| A | 0 | 134 | 0 |
| B | 0 | 134 | 0 |
| C | 0 | 134 | 0 |
| D | 0 | 134 | 0 |
| Mode M0 | |||
|---|---|---|---|
| Quadrant | BADHDUFLAG | Total packets | Discarded packets |
| A | 0 | 14252 | 2 |
| B | 0 | 14252 | 1 |
| C | 0 | 13458 | 1 |
| D | 0 | 14097 | 1 |
| Quadrant | Total seconds | Saturated seconds | Saturation percentage |
|---|---|---|---|
| A | 6592 | 36 | 0.546117% |
| B | 6592 | 81 | 1.228762% |
| C | 6592 | 11 | 0.166869% |
| D | 6592 | 51 | 0.773665% |
Noise dominated data is calculated using 1-second bins in cleaned event files. If a bin has >2000 counts, and if more than 50% of those come from <1% of pixels, then it is considered to be noise-dominated and hence unusable.
| Quadrant | # 1 sec bins | Bins with >0 counts | Bins with >2000 counts | High rate bins dominated by noise | Noise dominated (total time) | Noise dominated (detector-on time) | Marked lightcurve |
|---|---|---|---|---|---|---|---|
| A | 7233 | 6594 | 0 | 0 | 0.00% | 0.00% | 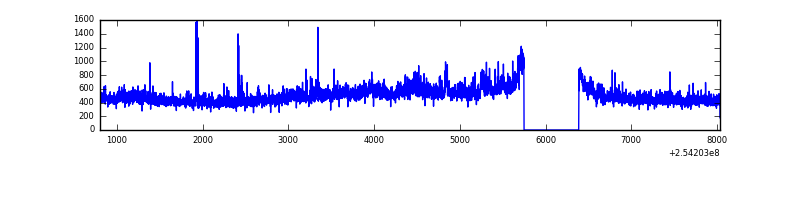 |
| B | 7233 | 6594 | 14 | 14 | 0.19% | 0.21% |  |
| C | 7233 | 6594 | 1 | 1 | 0.01% | 0.02% | 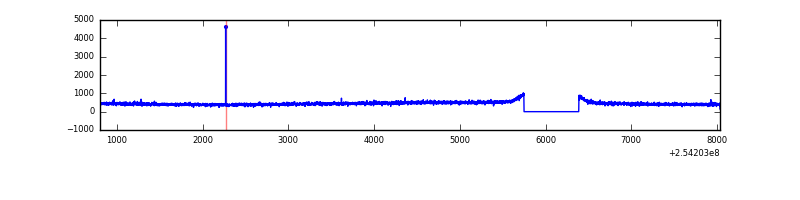 |
| D | 7233 | 6594 | 33 | 33 | 0.46% | 0.50% | 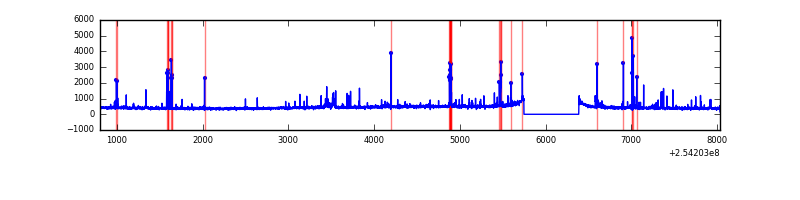 |
Top three noisy pixels from each quadrant. If the there are fewer than three noisy pixels in the level2.evt file, extra rows are filled as -1
| Pixel properties | Quadrant properties | ||||||
|---|---|---|---|---|---|---|---|
| Quadrant | DetID | PixID | Counts | Sigma | Mean | Median | Sigma |
| A | 12 | 189 | 89859 | 561.89 | 776 | 761 | 158.6 |
| A | 1 | 162 | 63267 | 394.19 | 776 | 761 | 158.6 |
| A | 8 | 15 | 52301 | 325.04 | 776 | 761 | 158.6 |
| B | 4 | 239 | 189526 | 1251.83 | 778 | 759 | 150.8 |
| B | 3 | 64 | 26719 | 172.16 | 778 | 759 | 150.8 |
| B | 0 | 214 | 22490 | 144.11 | 778 | 759 | 150.8 |
| C | 14 | 234 | 7038 | 35.92 | 749 | 753 | 175.0 |
| C | 13 | 61 | 5446 | 26.82 | 749 | 753 | 175.0 |
| C | 3 | 233 | 2366 | 9.22 | 749 | 753 | 175.0 |
| D | 1 | 52 | 68057 | 378.88 | 737 | 715 | 177.7 |
| D | 13 | 104 | 67543 | 375.99 | 737 | 715 | 177.7 |
| D | 13 | 249 | 50656 | 280.98 | 737 | 715 | 177.7 |
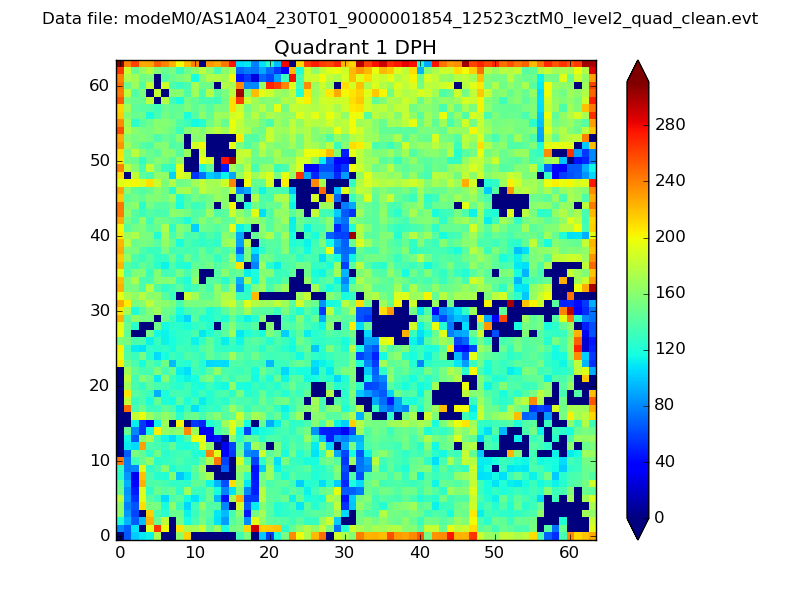
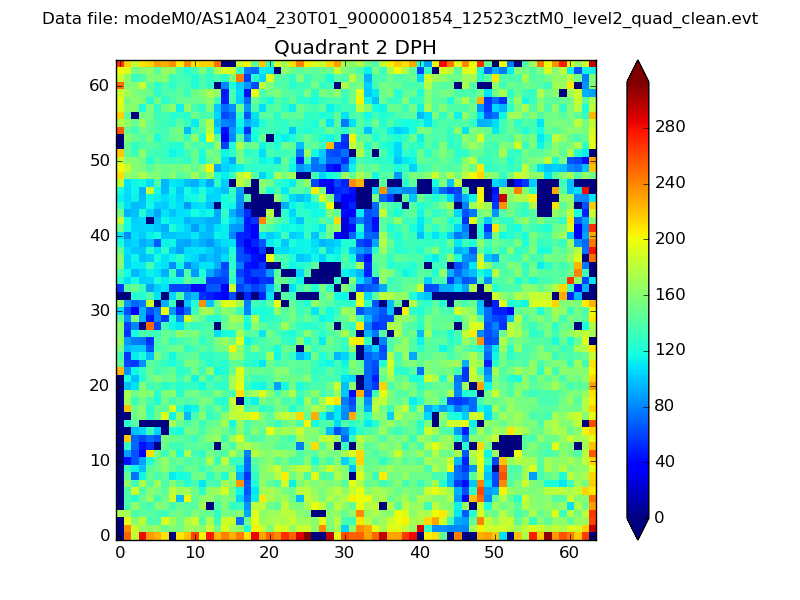
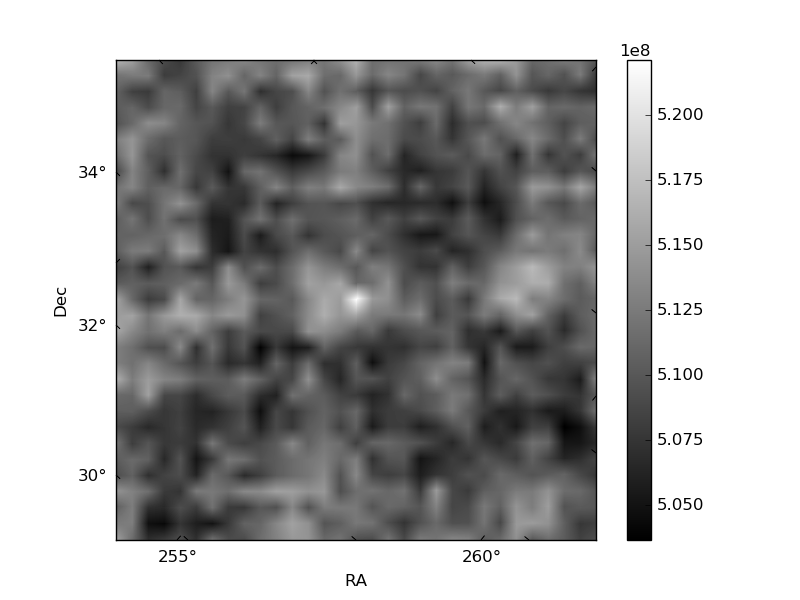
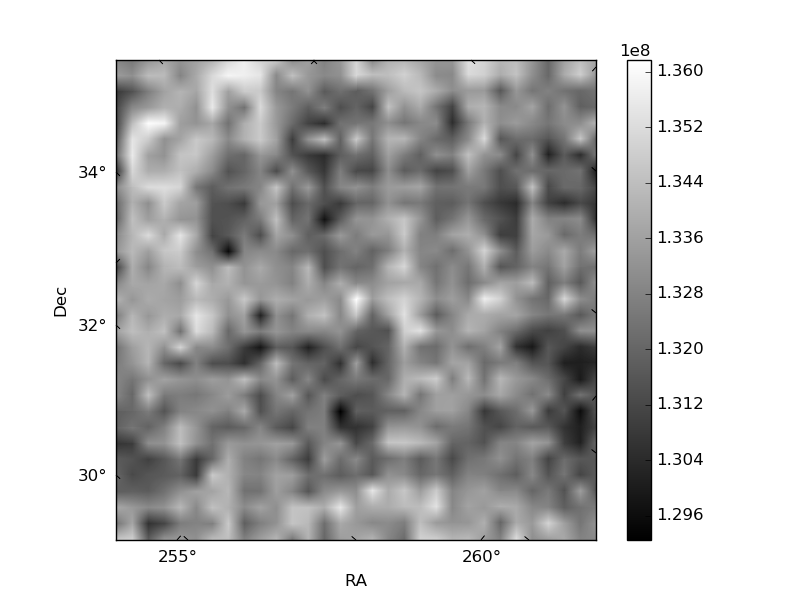
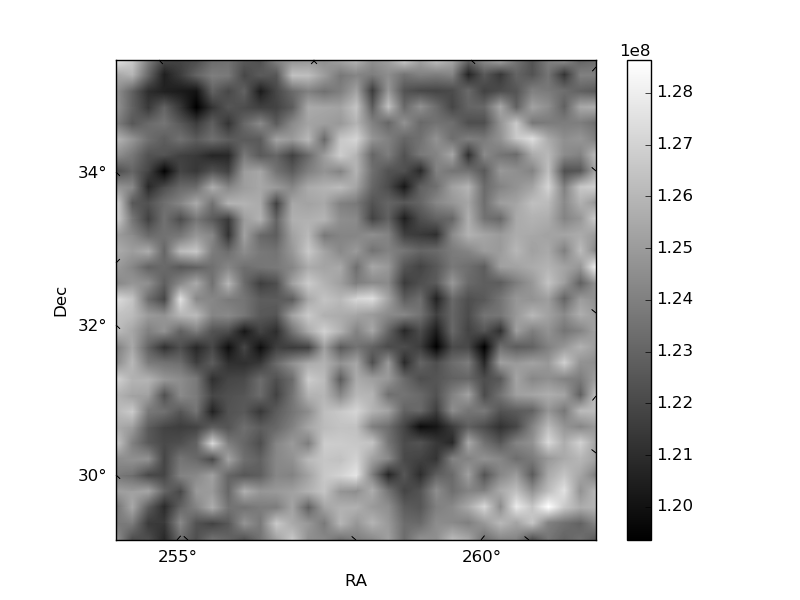
Histogram calculated using DETX and DETY for each event in the final _common_clean file
| Quadrant A | 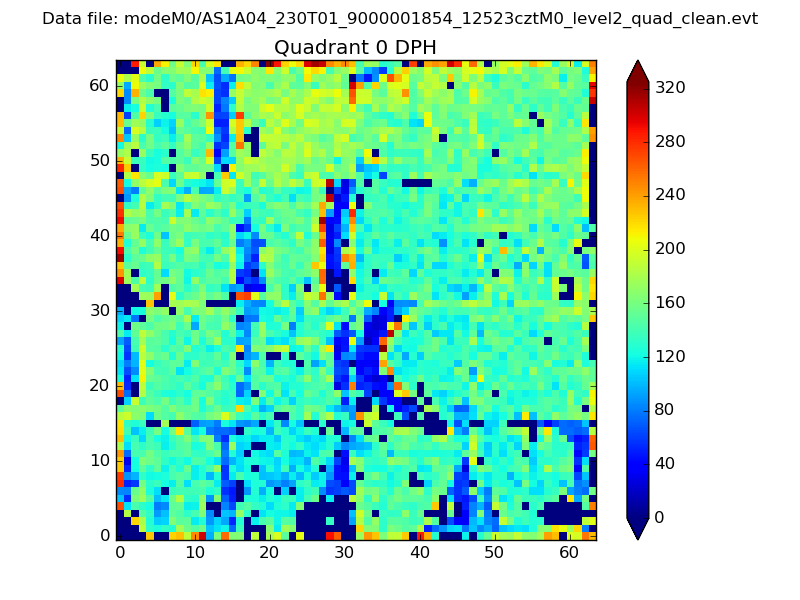 |
 |
Quadrant B |
|---|---|---|---|
| Quadrant D | 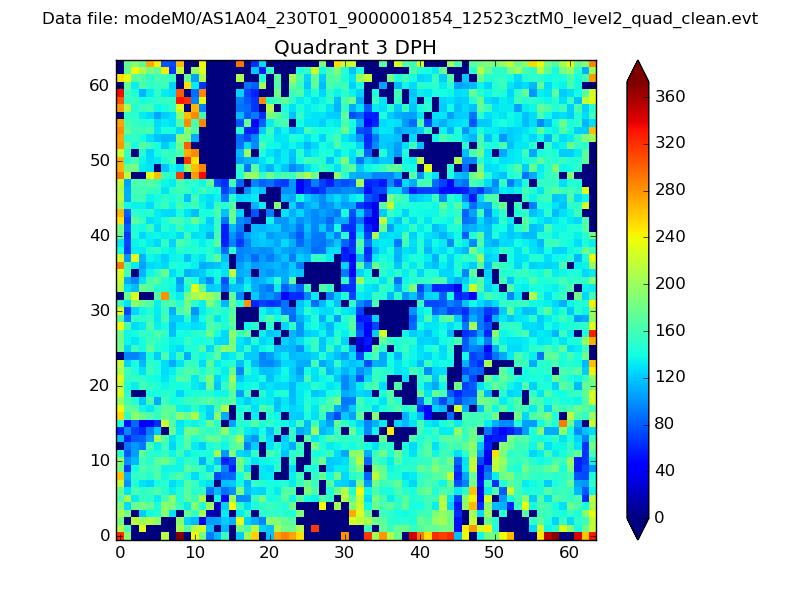 |
 |
Quadrant C |
| Plot type | Count rate plots | Images |
|---|---|---|
| Comparison with Poisson distribution Blue bars denote a histogram of data divided into 1 sec bins. Red curve is a Poisson curve with rate = median count rate of data. |
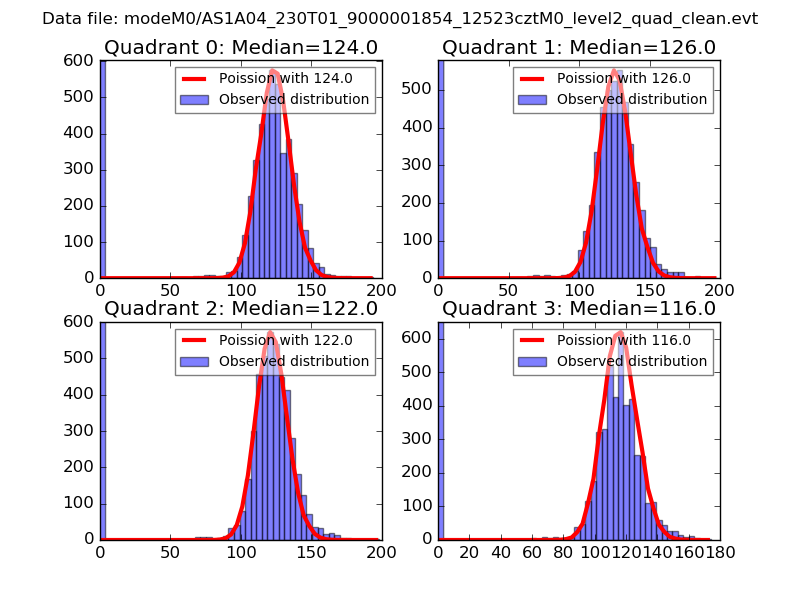 |
 |
| Quadrant-wise count rates Data is divided into 100 sec bins |
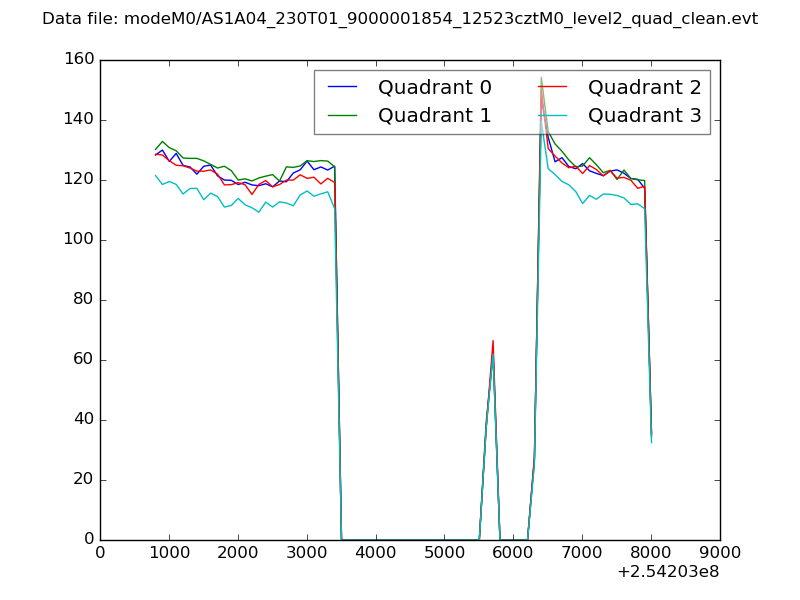 |
|
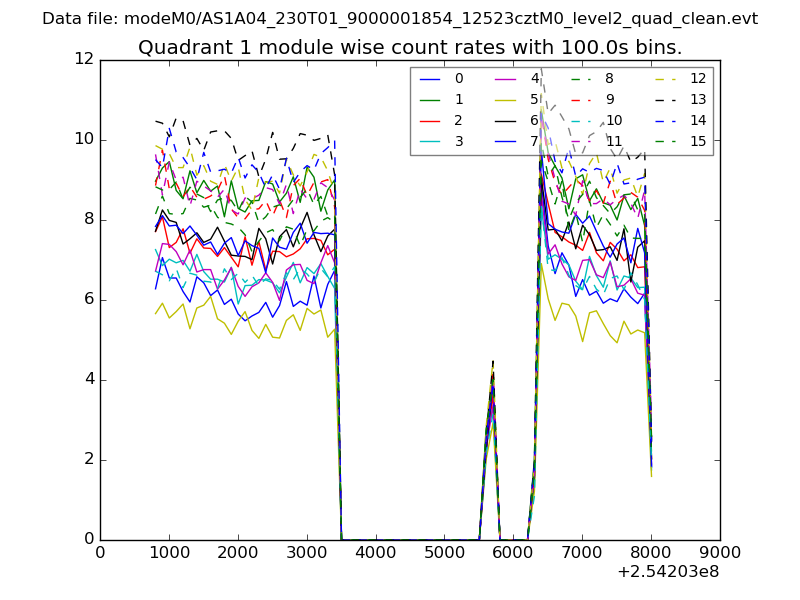
| Module-wise count rates for Quadrant A Data is divided into 100 sec bins |
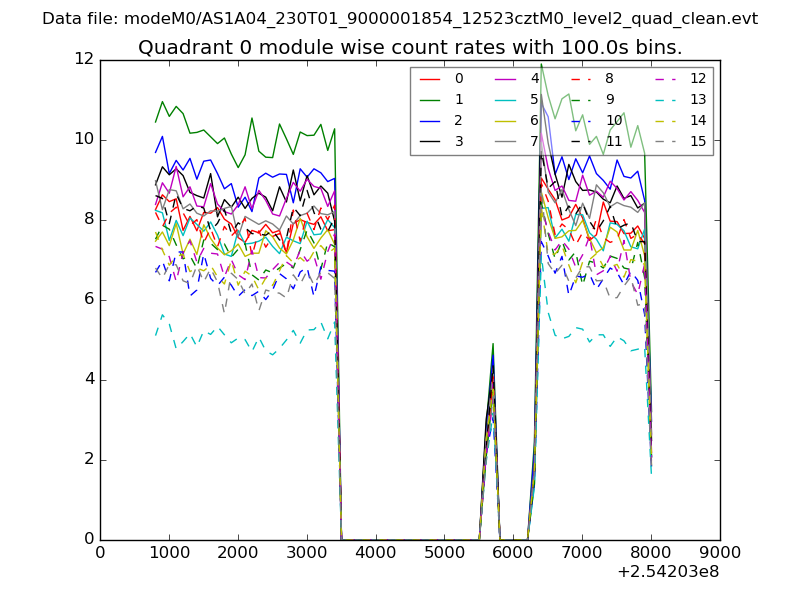 |
 |
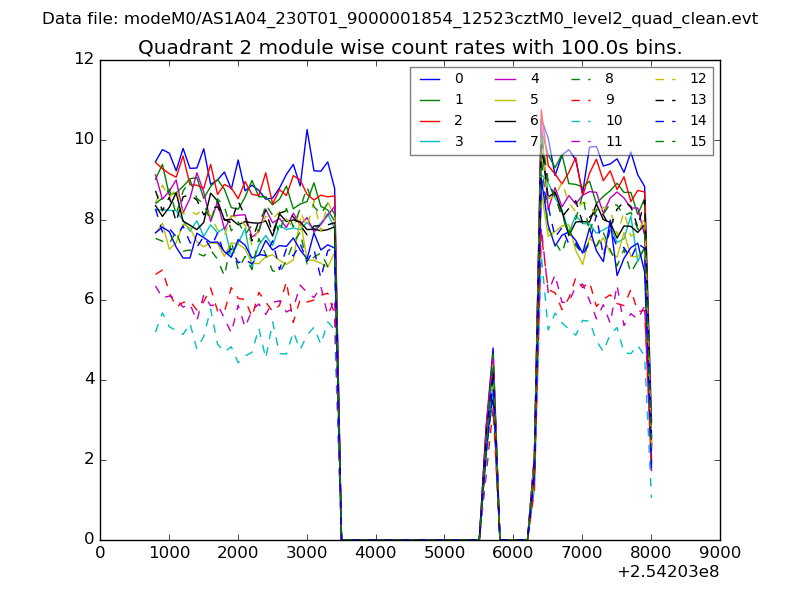
| Module-wise count rates for Quadrant B Data is divided into 100 sec bins |
 |
 |
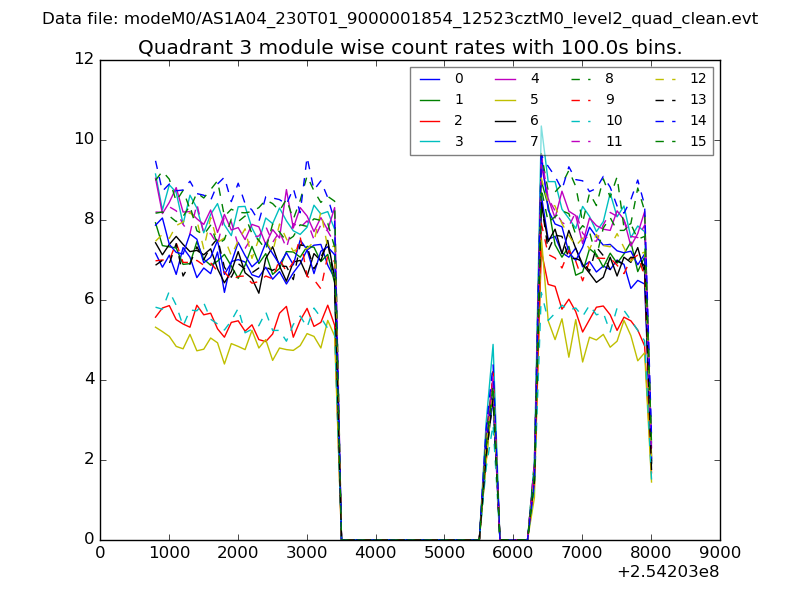
| Module-wise count rates for Quadrant C Data is divided into 100 sec bins |
 |
 |
| Module-wise count rates for Quadrant D Data is divided into 100 sec bins |
 |
 |
| Parameter | Plot |
|---|---|
| CZT HV Monitor | 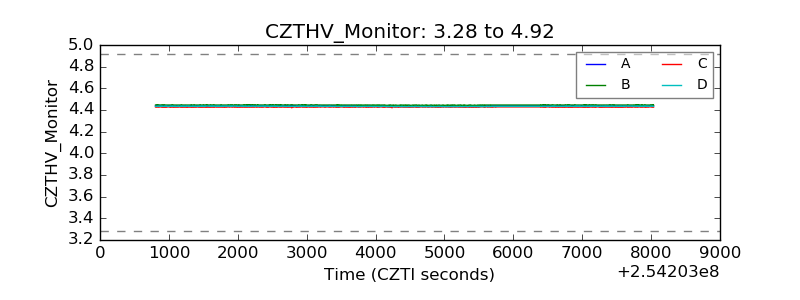 |
| D_VDD |  |
| Temperature 1 | 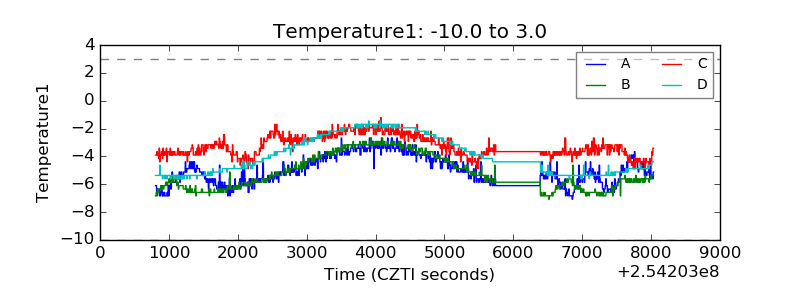 |
| Veto HV Monitor | 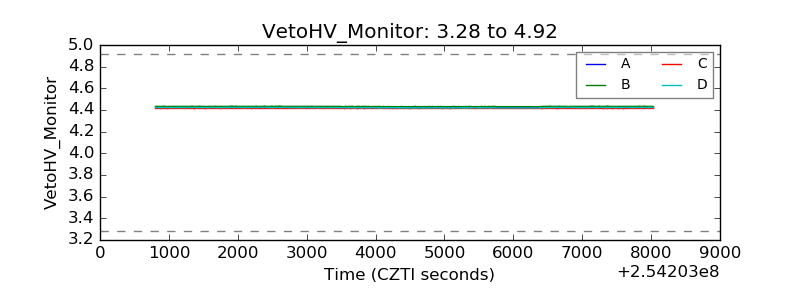 |
| Veto LLD | 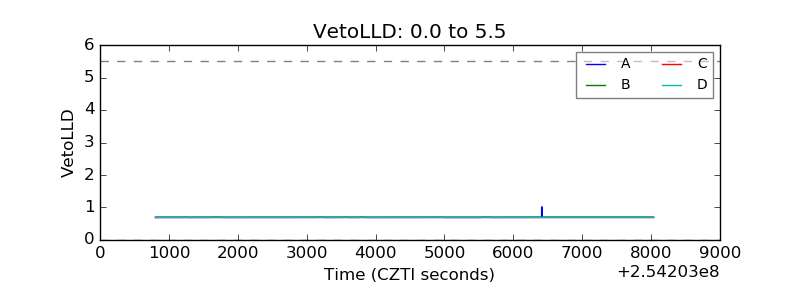 |
| Alpha Counter | 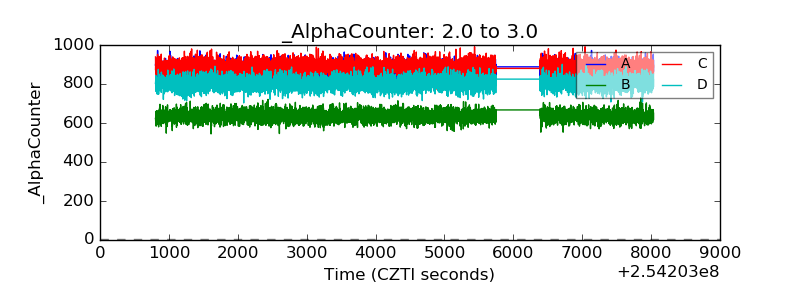 |
| _CPM_Rate | 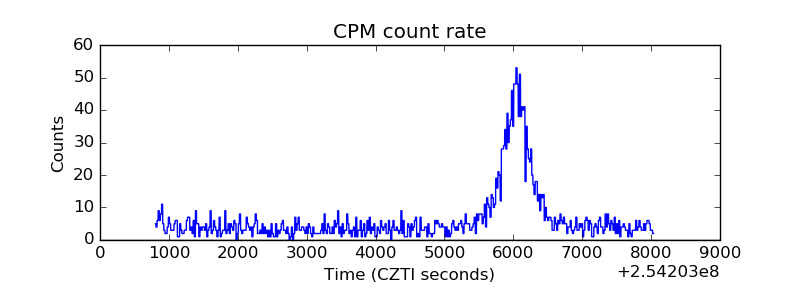 |
| CZT Counter | 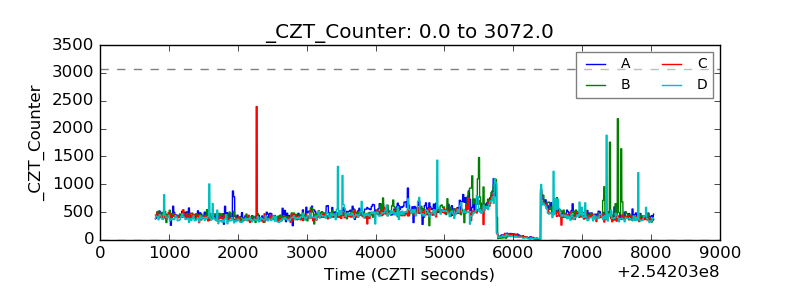 |
| +2.5 Volts monitor | 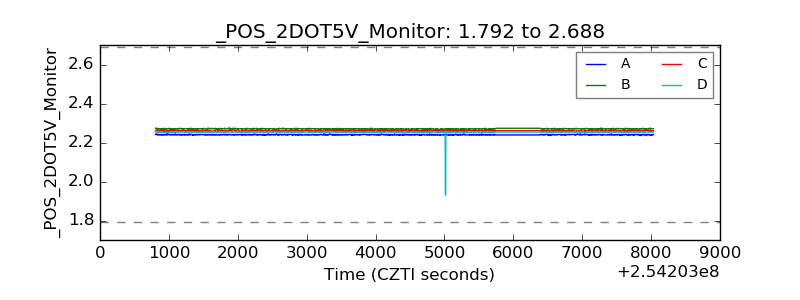 |
| +5 Volts monitor |  |
| _ROLL_ROT | 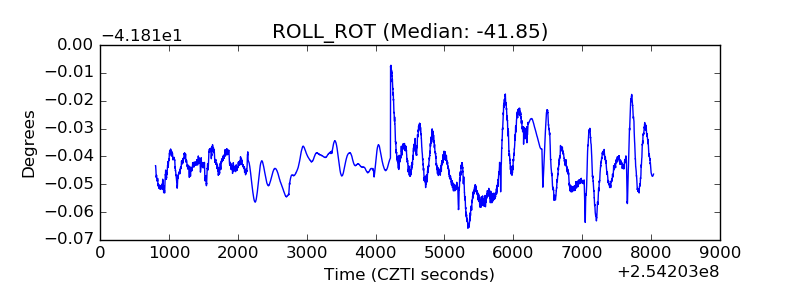 |
| _Roll_DEC | 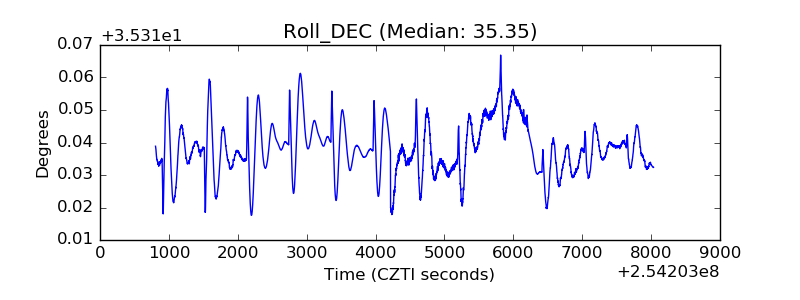 |
| _Roll_RA | 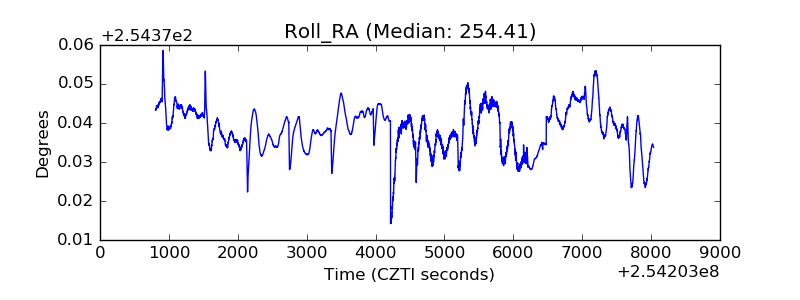 |
| Veto Counter | 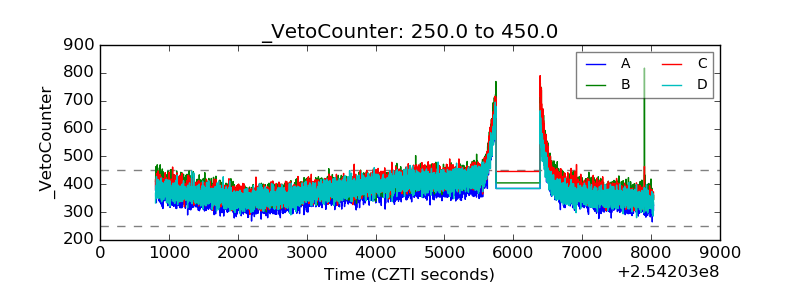 |