| Param | Original file | Final file |
|---|---|---|
| Filename | modeM0/AS1A04_230T01_9000001854_12524cztM0_level2.evt | modeM0/AS1A04_230T01_9000001854_12524cztM0_level2_quad_clean.evt |
| Size (bytes) | 497,373,120 | 102,680,640 |
| Size | 474.3 MB | 97.9 MB |
| Events in quadrant A | 3,793,059 | 656,848 |
| Events in quadrant B | 3,764,943 | 664,553 |
| Events in quadrant C | 3,429,257 | 653,025 |
| Events in quadrant D | 3,570,196 | 617,488 |
| Mode SS | |||
|---|---|---|---|
| Quadrant | BADHDUFLAG | Total packets | Discarded packets |
| A | 0 | 150 | 0 |
| B | 0 | 150 | 0 |
| C | 0 | 150 | 0 |
| D | 0 | 150 | 0 |
| Mode M0 | |||
|---|---|---|---|
| Quadrant | BADHDUFLAG | Total packets | Discarded packets |
| A | 0 | 16117 | 2 |
| B | 0 | 16202 | 1 |
| C | 0 | 15510 | 1 |
| D | 0 | 16144 | 1 |
| Quadrant | Total seconds | Saturated seconds | Saturation percentage |
|---|---|---|---|
| A | 7433 | 172 | 2.314005% |
| B | 7433 | 243 | 3.269205% |
| C | 7433 | 115 | 1.547155% |
| D | 7433 | 102 | 1.372259% |
Noise dominated data is calculated using 1-second bins in cleaned event files. If a bin has >2000 counts, and if more than 50% of those come from <1% of pixels, then it is considered to be noise-dominated and hence unusable.
| Quadrant | # 1 sec bins | Bins with >0 counts | Bins with >2000 counts | High rate bins dominated by noise | Noise dominated (total time) | Noise dominated (detector-on time) | Marked lightcurve |
|---|---|---|---|---|---|---|---|
| A | 7479 | 7435 | 0 | 0 | 0.00% | 0.00% | 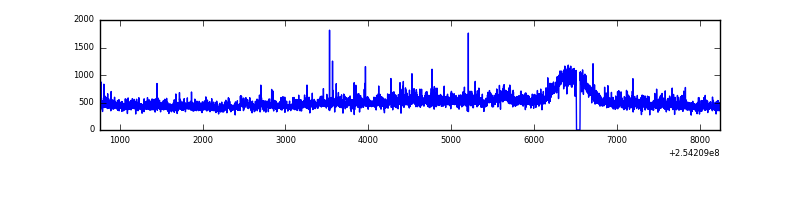 |
| B | 7479 | 7435 | 25 | 25 | 0.33% | 0.34% | 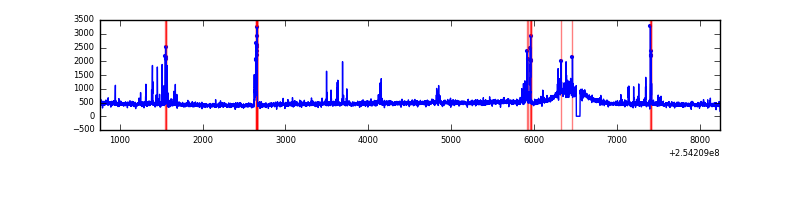 |
| C | 7479 | 7435 | 0 | 0 | 0.00% | 0.00% | 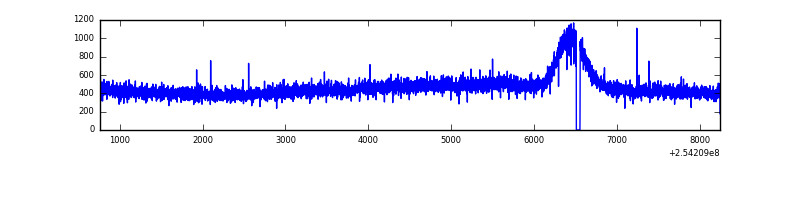 |
| D | 7479 | 7435 | 33 | 33 | 0.44% | 0.44% | 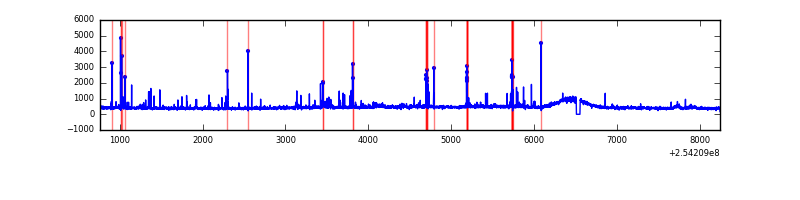 |
Top three noisy pixels from each quadrant. If the there are fewer than three noisy pixels in the level2.evt file, extra rows are filled as -1
| Pixel properties | Quadrant properties | ||||||
|---|---|---|---|---|---|---|---|
| Quadrant | DetID | PixID | Counts | Sigma | Mean | Median | Sigma |
| A | 1 | 162 | 100465 | 539.63 | 899 | 881 | 184.5 |
| A | 12 | 189 | 59503 | 317.66 | 899 | 881 | 184.5 |
| A | 1 | 178 | 55387 | 295.36 | 899 | 881 | 184.5 |
| B | 4 | 239 | 243516 | 1385.5 | 897 | 873 | 175.1 |
| B | 12 | 111 | 20694 | 113.18 | 897 | 873 | 175.1 |
| B | 11 | 111 | 17364 | 94.16 | 897 | 873 | 175.1 |
| C | 3 | 233 | 24593 | 116.06 | 872 | 877 | 204.3 |
| C | 13 | 61 | 6427 | 27.16 | 872 | 877 | 204.3 |
| C | 8 | 128 | 4086 | 15.7 | 872 | 877 | 204.3 |
| D | 13 | 249 | 91243 | 430.85 | 860 | 836 | 209.8 |
| D | 1 | 52 | 76122 | 358.79 | 860 | 836 | 209.8 |
| D | 13 | 104 | 50561 | 236.97 | 860 | 836 | 209.8 |
Histogram calculated using DETX and DETY for each event in the final _common_clean file
| Quadrant A |  |
 |
Quadrant B |
|---|---|---|---|
| Quadrant D | 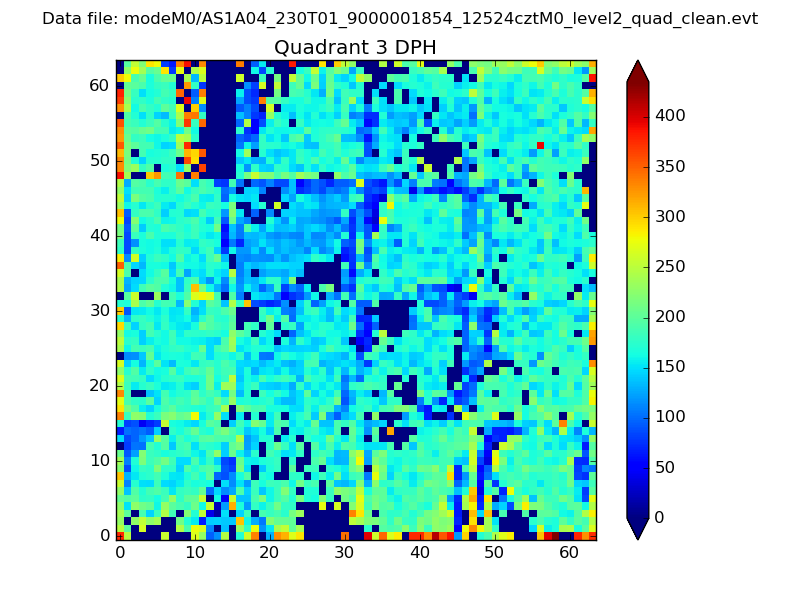 |
 |
Quadrant C |
| Plot type | Count rate plots | Images |
|---|---|---|
| Comparison with Poisson distribution Blue bars denote a histogram of data divided into 1 sec bins. Red curve is a Poisson curve with rate = median count rate of data. |
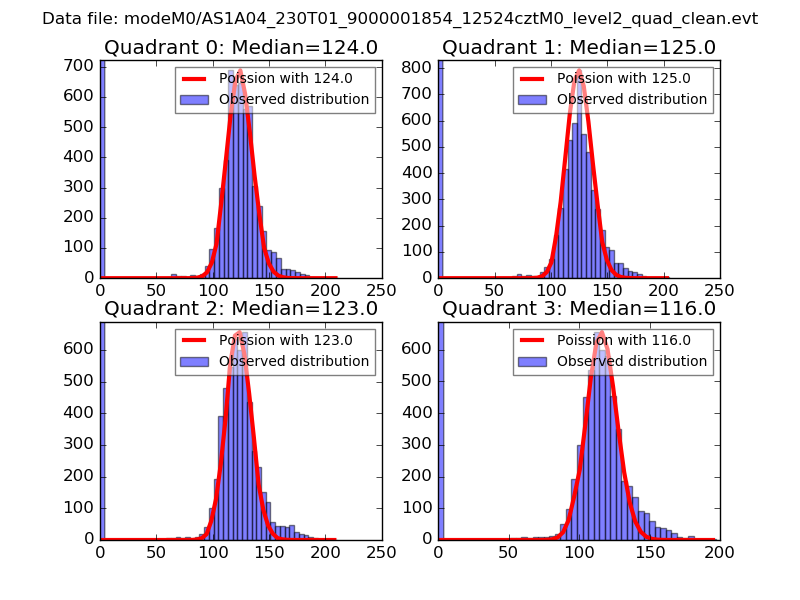 |
 |
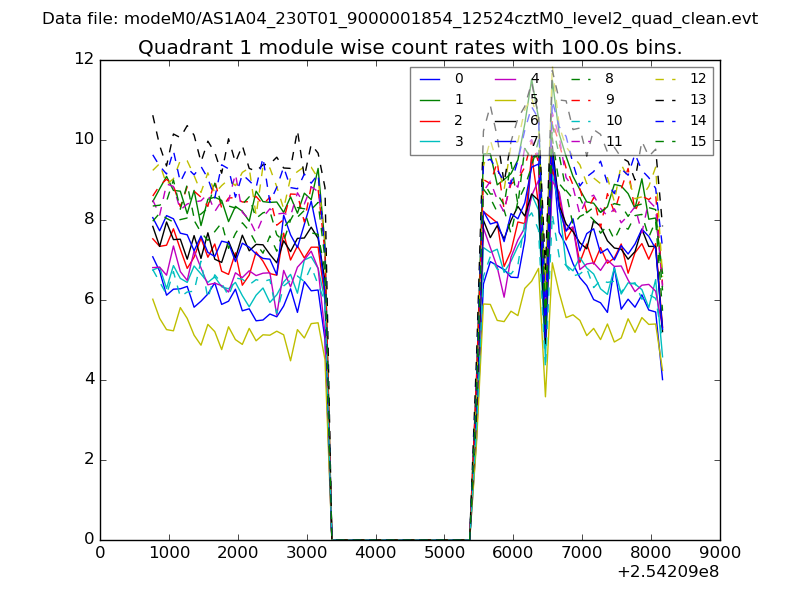
| Quadrant-wise count rates Data is divided into 100 sec bins |
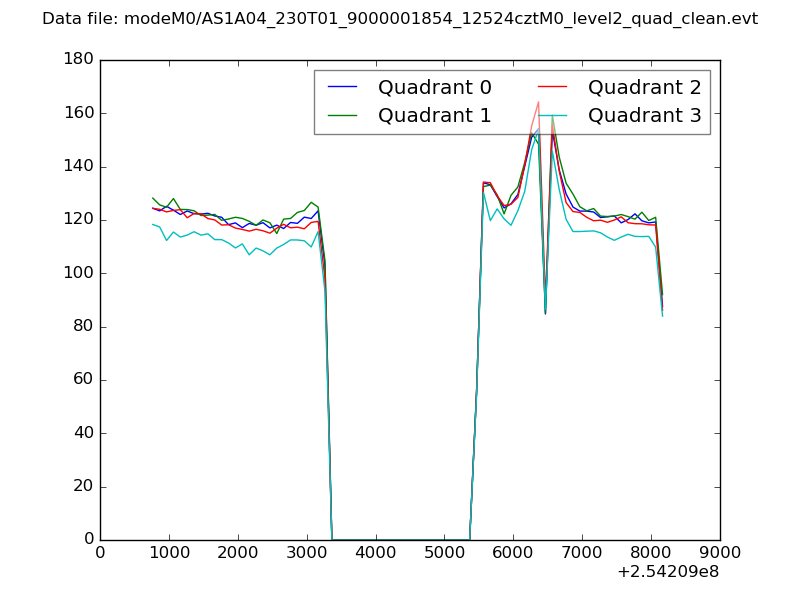 |
|
| Module-wise count rates for Quadrant A Data is divided into 100 sec bins |
 |
 |
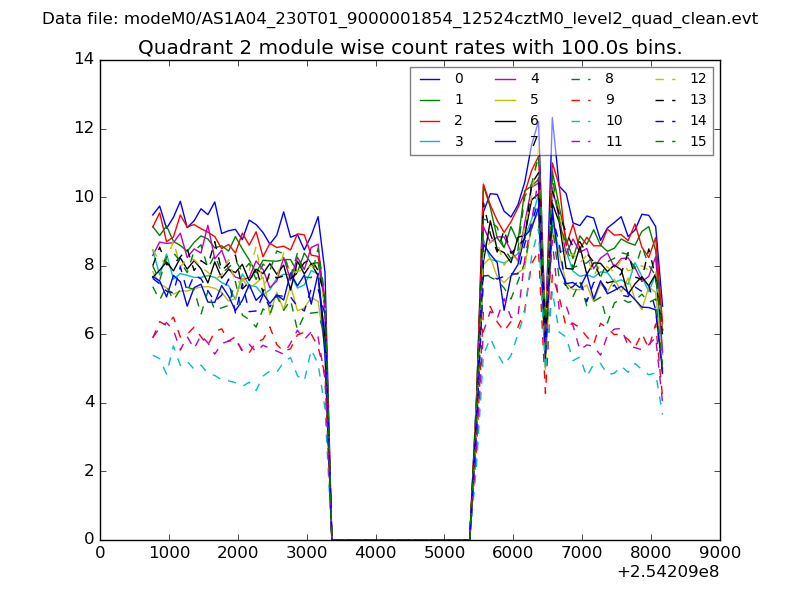
| Module-wise count rates for Quadrant B Data is divided into 100 sec bins |
 |
 |
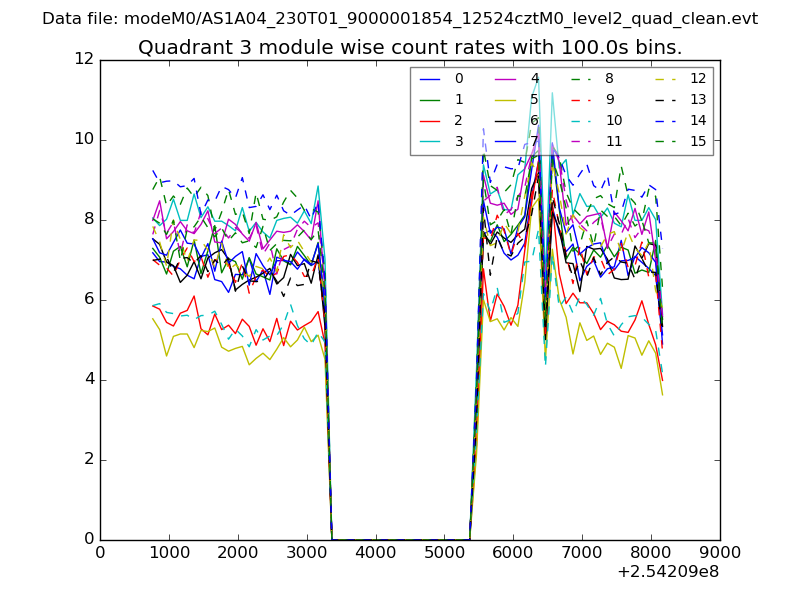
| Module-wise count rates for Quadrant C Data is divided into 100 sec bins |
 |
 |
| Module-wise count rates for Quadrant D Data is divided into 100 sec bins |
 |
 |
| Parameter | Plot |
|---|---|
| CZT HV Monitor |  |
| D_VDD | 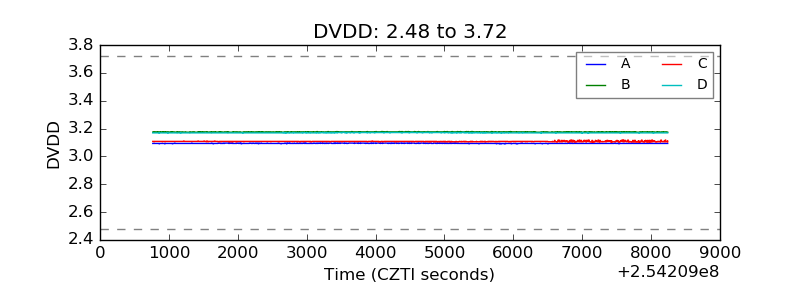 |
| Temperature 1 | 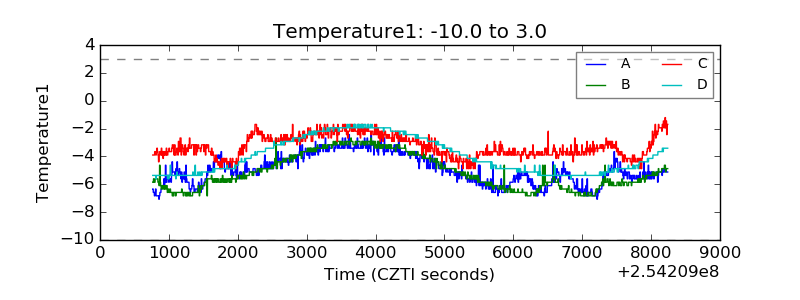 |
| Veto HV Monitor | 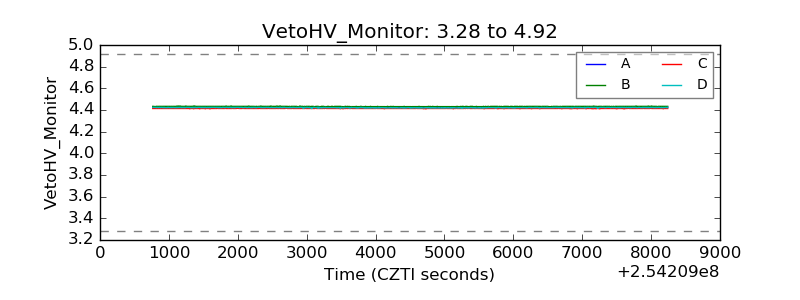 |
| Veto LLD | 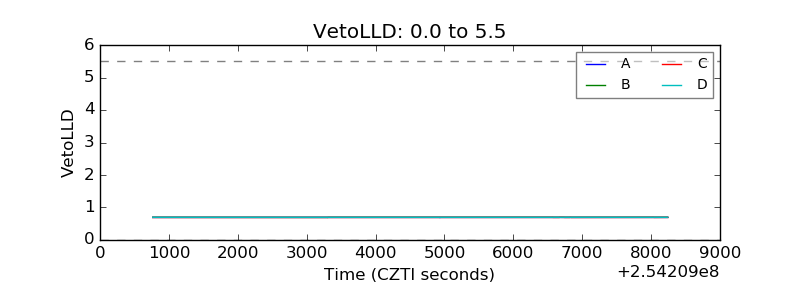 |
| Alpha Counter | 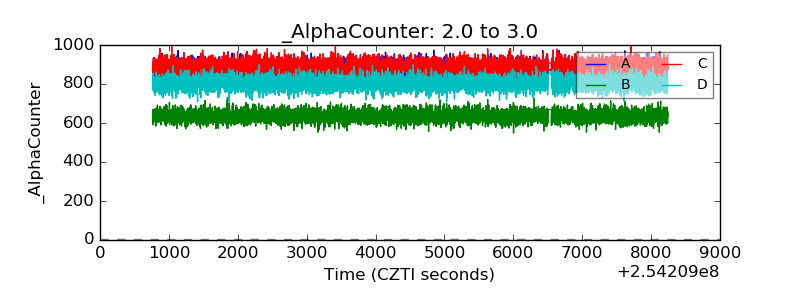 |
| _CPM_Rate | 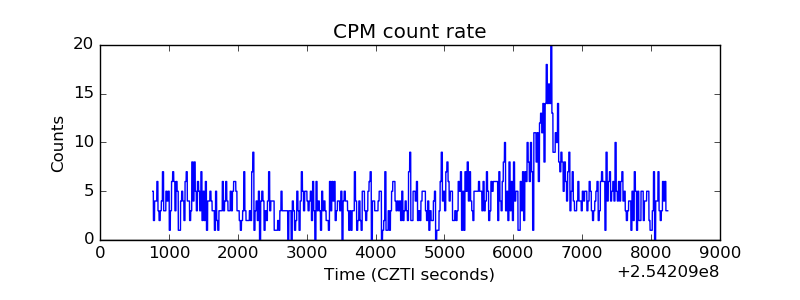 |
| CZT Counter |  |
| +2.5 Volts monitor |  |
| +5 Volts monitor | 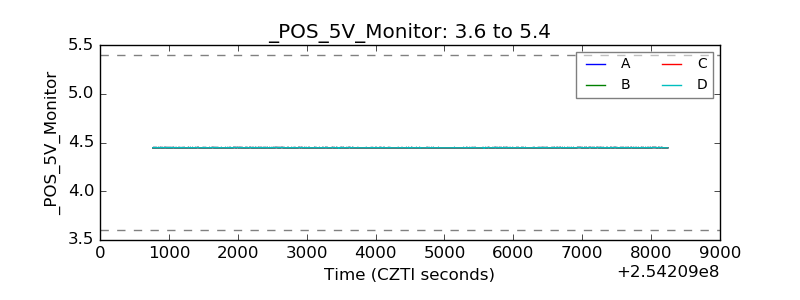 |
| _ROLL_ROT | 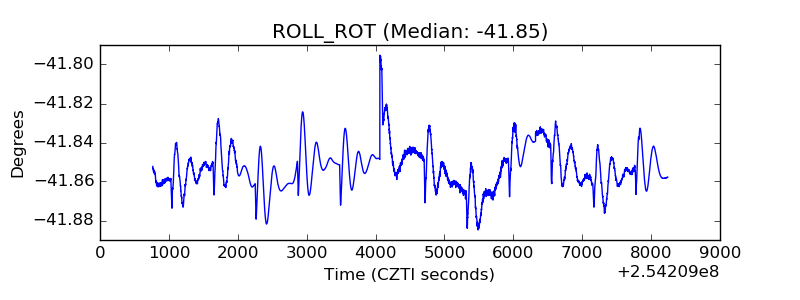 |
| _Roll_DEC | 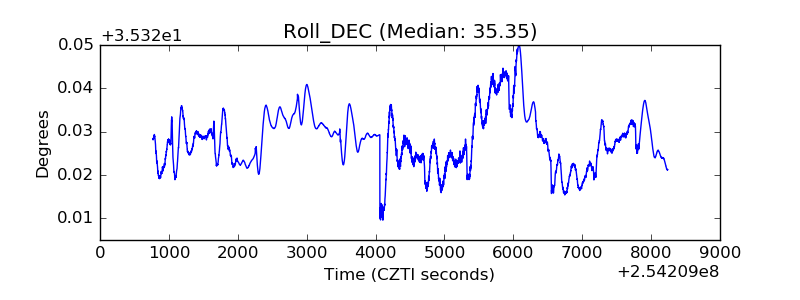 |
| _Roll_RA | 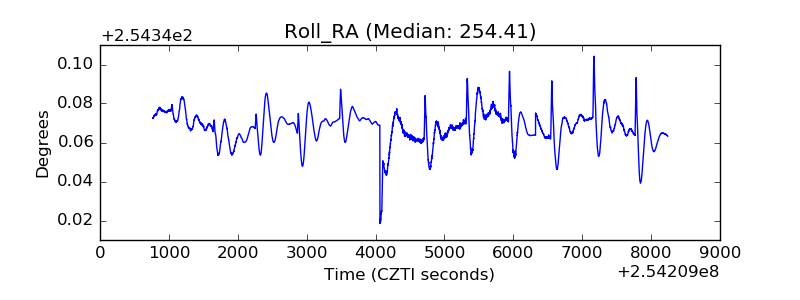 |
| Veto Counter |  |