| Param | Original file | Final file |
|---|---|---|
| Filename | modeM0/AS1A04_230T01_9000001854_12525cztM0_level2.evt | modeM0/AS1A04_230T01_9000001854_12525cztM0_level2_quad_clean.evt |
| Size (bytes) | 488,197,440 | 97,752,960 |
| Size | 465.6 MB | 93.2 MB |
| Events in quadrant A | 3,772,382 | 622,397 |
| Events in quadrant B | 3,550,358 | 632,348 |
| Events in quadrant C | 3,305,385 | 618,592 |
| Events in quadrant D | 3,668,604 | 586,655 |
| Mode SS | |||
|---|---|---|---|
| Quadrant | BADHDUFLAG | Total packets | Discarded packets |
| A | 0 | 144 | 0 |
| B | 0 | 144 | 0 |
| C | 0 | 144 | 0 |
| D | 0 | 144 | 0 |
| Mode M0 | |||
|---|---|---|---|
| Quadrant | BADHDUFLAG | Total packets | Discarded packets |
| A | 0 | 15781 | 2 |
| B | 0 | 15349 | 1 |
| C | 0 | 14834 | 1 |
| D | 0 | 16146 | 1 |
| Quadrant | Total seconds | Saturated seconds | Saturation percentage |
|---|---|---|---|
| A | 7180 | 204 | 2.841226% |
| B | 7180 | 222 | 3.091922% |
| C | 7180 | 121 | 1.685237% |
| D | 7180 | 198 | 2.757660% |
Noise dominated data is calculated using 1-second bins in cleaned event files. If a bin has >2000 counts, and if more than 50% of those come from <1% of pixels, then it is considered to be noise-dominated and hence unusable.
| Quadrant | # 1 sec bins | Bins with >0 counts | Bins with >2000 counts | High rate bins dominated by noise | Noise dominated (total time) | Noise dominated (detector-on time) | Marked lightcurve |
|---|---|---|---|---|---|---|---|
| A | 7196 | 7182 | 0 | 0 | 0.00% | 0.00% | 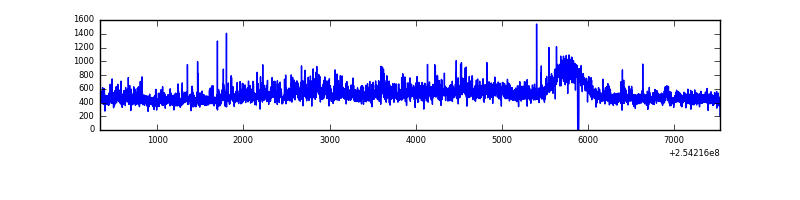 |
| B | 7196 | 7182 | 20 | 20 | 0.28% | 0.28% | 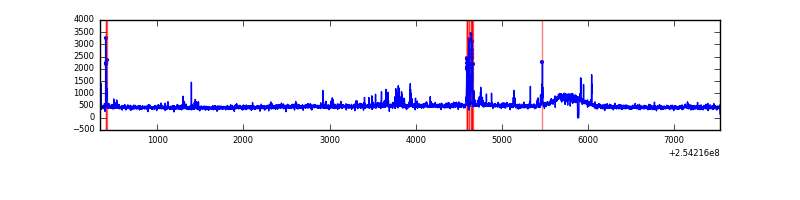 |
| C | 7196 | 7182 | 0 | 0 | 0.00% | 0.00% | 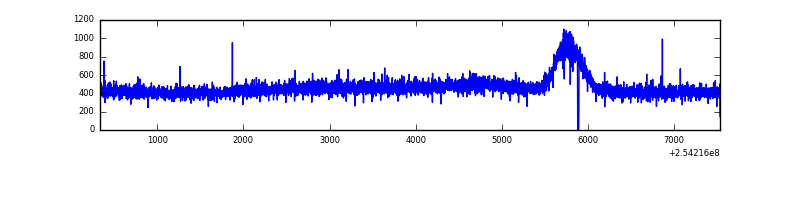 |
| D | 7196 | 7182 | 47 | 47 | 0.65% | 0.65% | 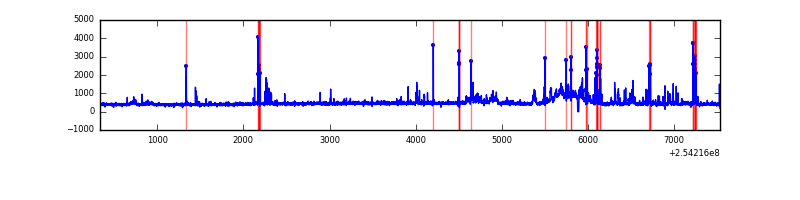 |
Top three noisy pixels from each quadrant. If the there are fewer than three noisy pixels in the level2.evt file, extra rows are filled as -1
| Pixel properties | Quadrant properties | ||||||
|---|---|---|---|---|---|---|---|
| Quadrant | DetID | PixID | Counts | Sigma | Mean | Median | Sigma |
| A | 1 | 162 | 138837 | 784.75 | 859 | 840 | 175.8 |
| A | 1 | 178 | 82915 | 466.74 | 859 | 840 | 175.8 |
| A | 12 | 189 | 77390 | 435.32 | 859 | 840 | 175.8 |
| B | 4 | 239 | 148698 | 894.39 | 856 | 835 | 165.3 |
| B | 3 | 64 | 32860 | 193.71 | 856 | 835 | 165.3 |
| B | 12 | 111 | 19326 | 111.85 | 856 | 835 | 165.3 |
| C | 3 | 233 | 37805 | 189.28 | 834 | 836 | 195.3 |
| C | 8 | 128 | 9049 | 42.05 | 834 | 836 | 195.3 |
| C | 13 | 61 | 6033 | 26.61 | 834 | 836 | 195.3 |
| D | 1 | 52 | 336962 | 1678.57 | 826 | 801 | 200.3 |
| D | 13 | 249 | 65425 | 322.69 | 826 | 801 | 200.3 |
| D | 2 | 14 | 54865 | 269.96 | 826 | 801 | 200.3 |
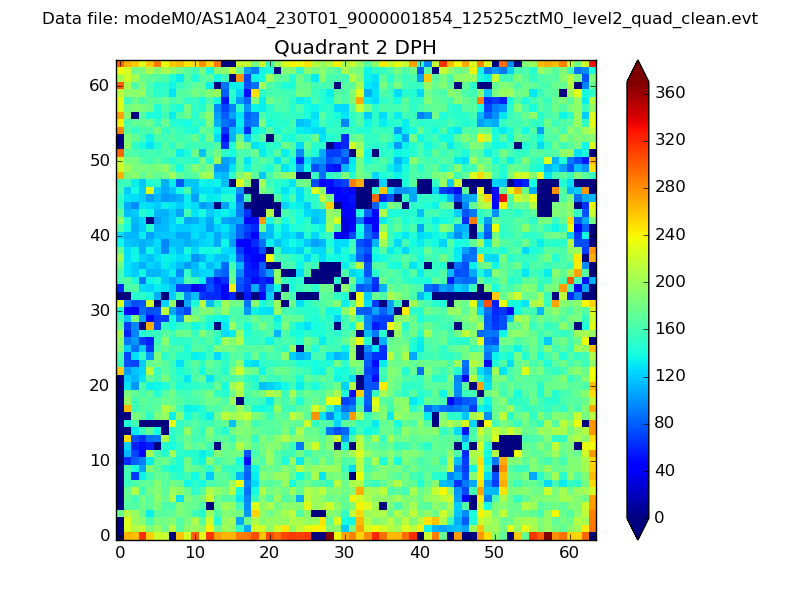
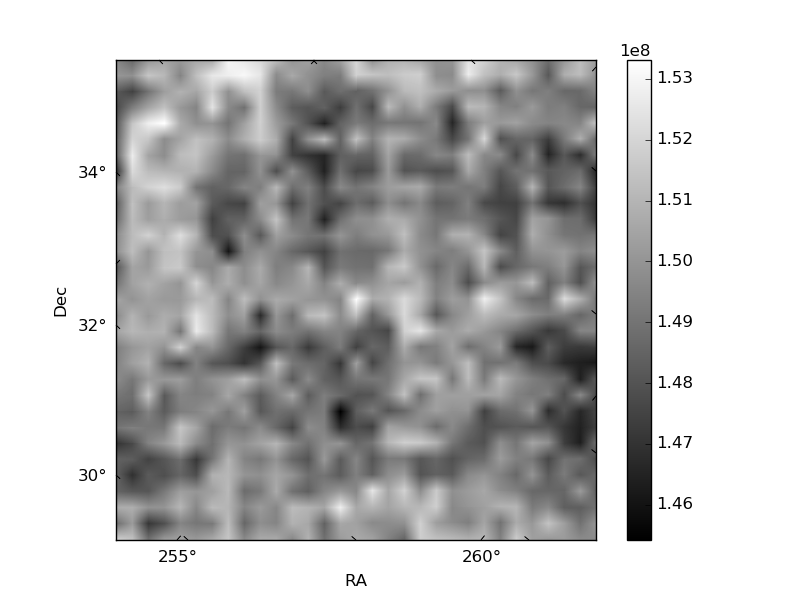
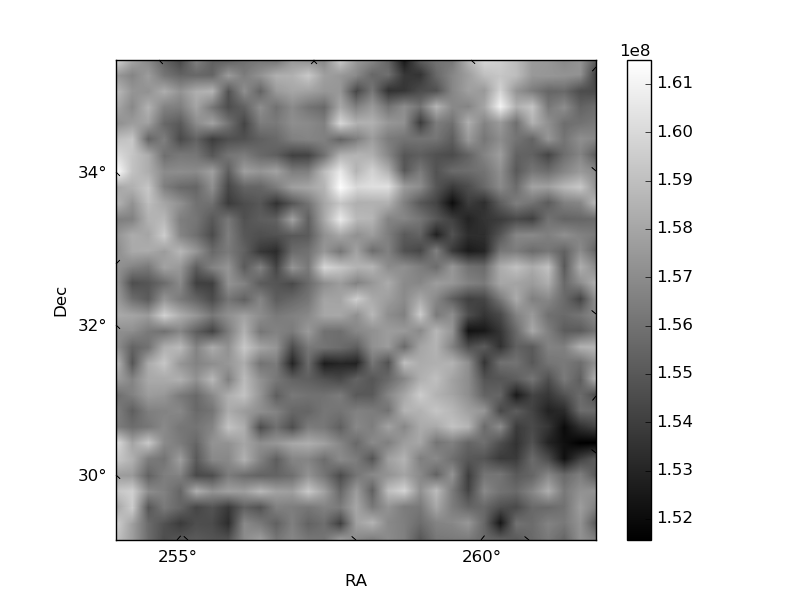
Histogram calculated using DETX and DETY for each event in the final _common_clean file
| Quadrant A | 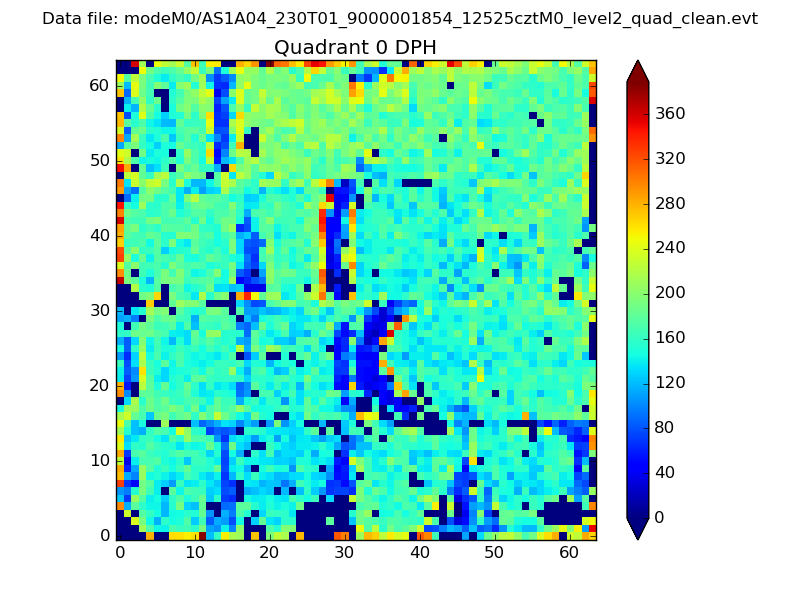 |
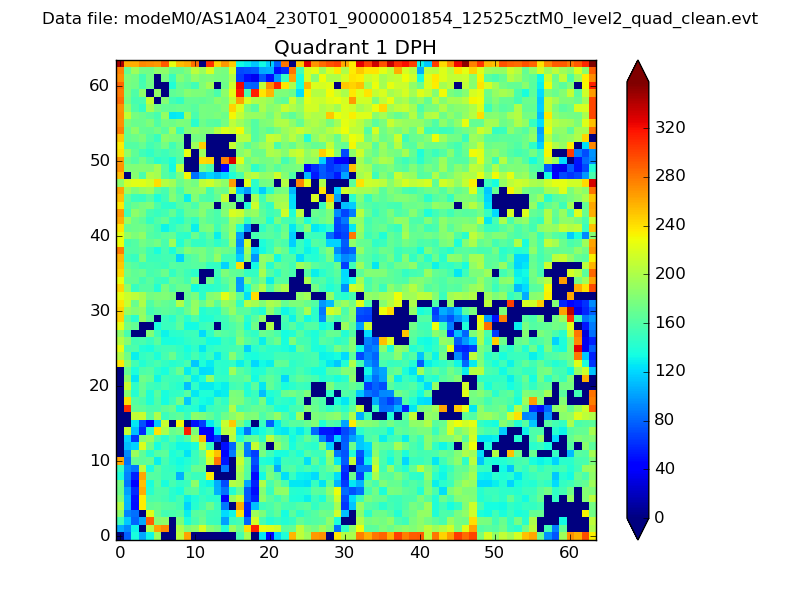 |
Quadrant B |
|---|---|---|---|
| Quadrant D | 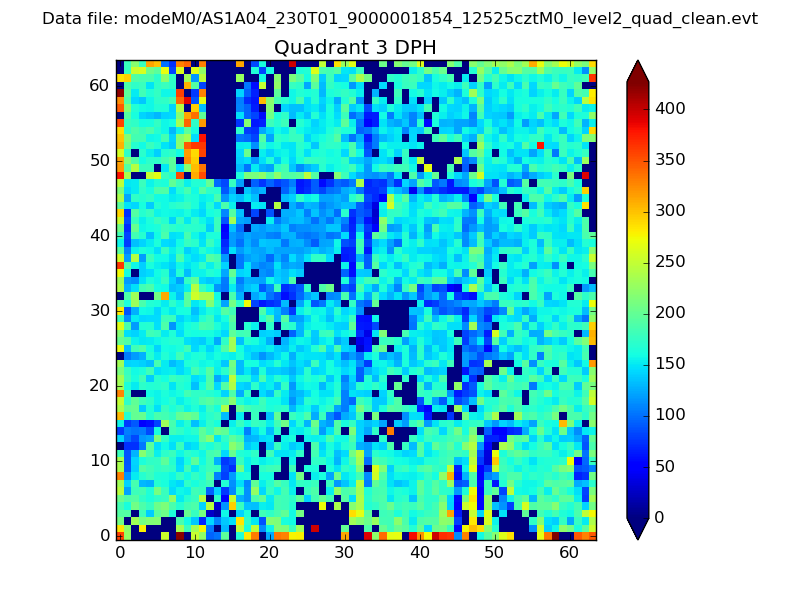 |
 |
Quadrant C |
| Plot type | Count rate plots | Images |
|---|---|---|
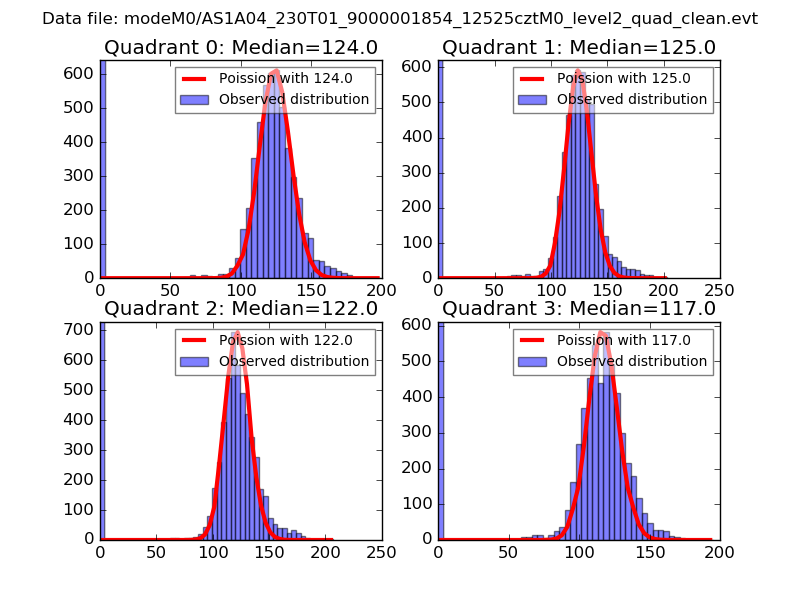
| Comparison with Poisson distribution Blue bars denote a histogram of data divided into 1 sec bins. Red curve is a Poisson curve with rate = median count rate of data. |
 |
 |
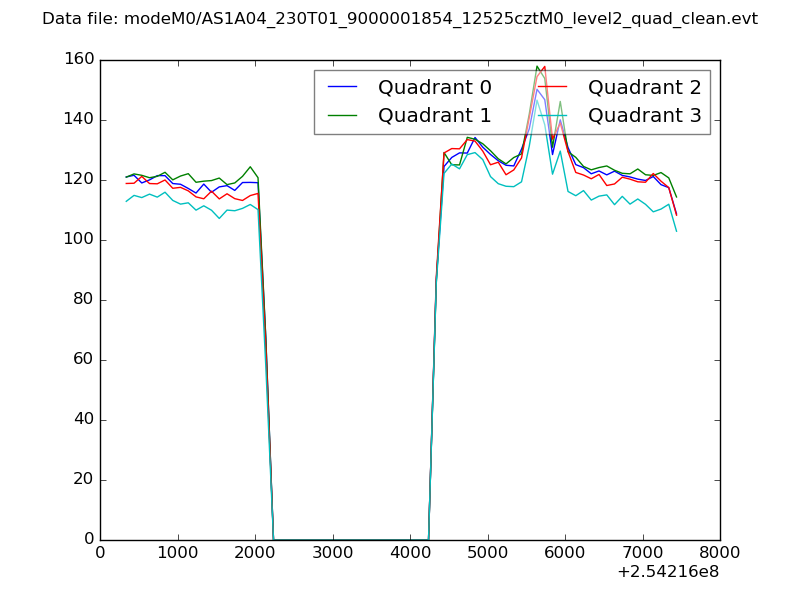
| Quadrant-wise count rates Data is divided into 100 sec bins |
 |
|
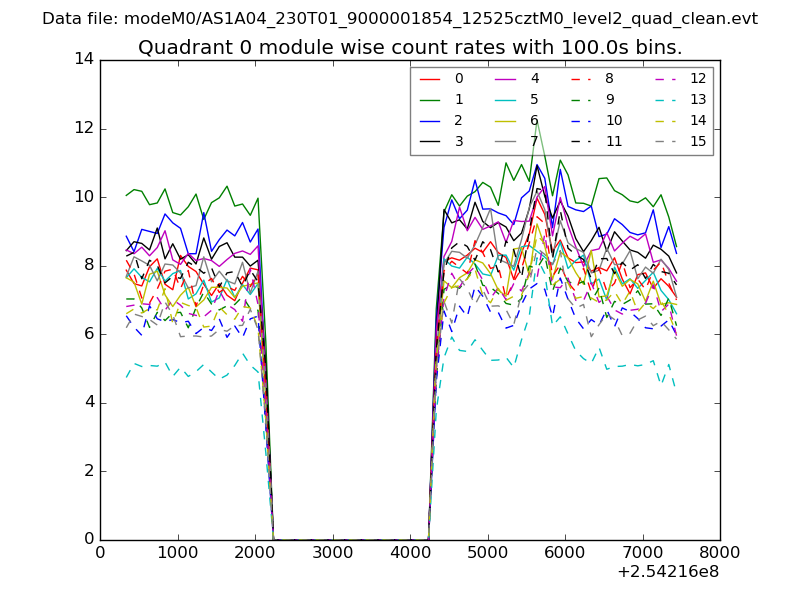
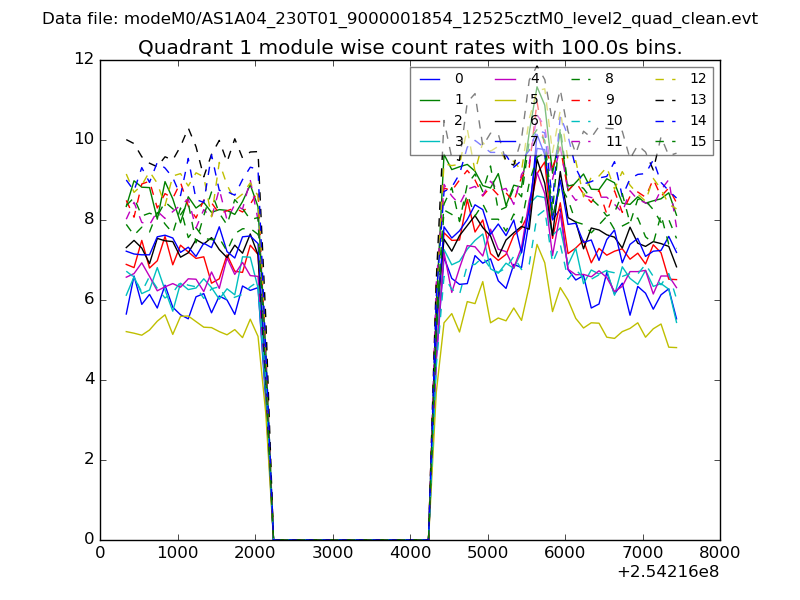
| Module-wise count rates for Quadrant A Data is divided into 100 sec bins |
 |
 |
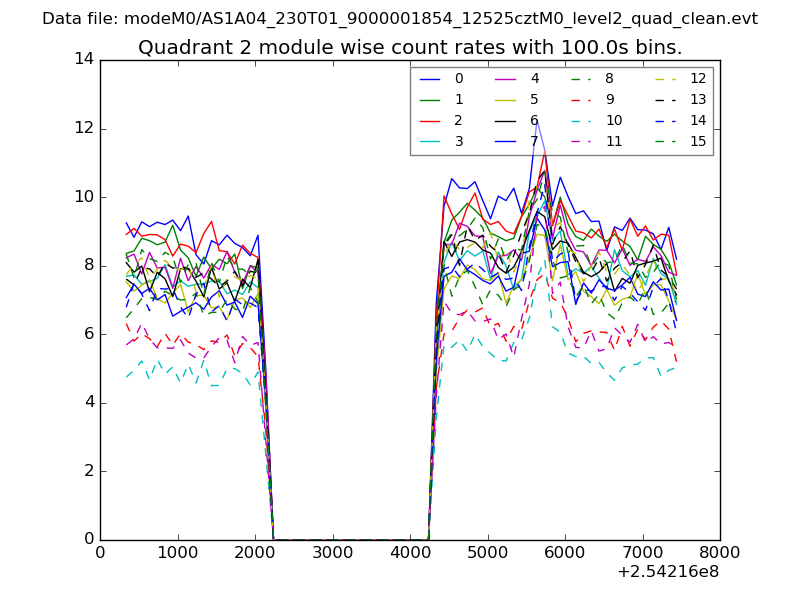
| Module-wise count rates for Quadrant B Data is divided into 100 sec bins |
 |
 |
| Module-wise count rates for Quadrant C Data is divided into 100 sec bins |
 |
 |
| Module-wise count rates for Quadrant D Data is divided into 100 sec bins |
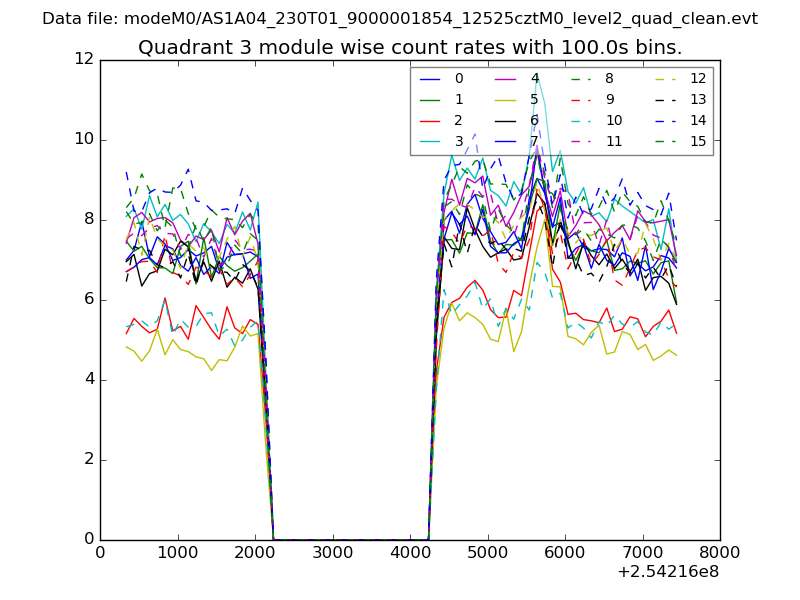 |
 |
| Parameter | Plot |
|---|---|
| CZT HV Monitor | 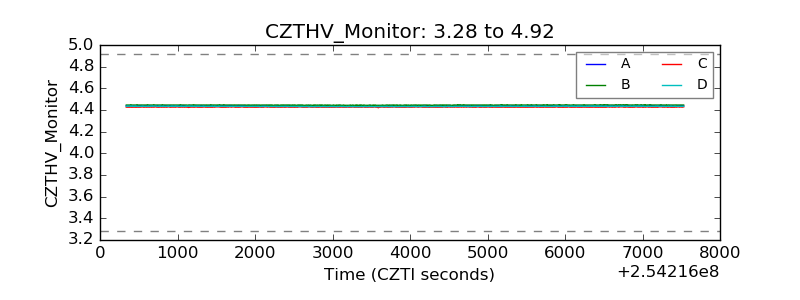 |
| D_VDD | 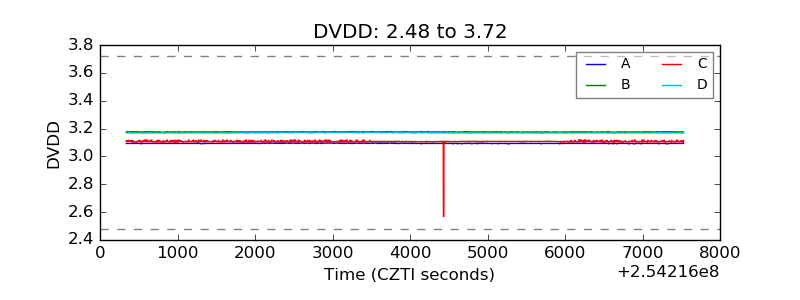 |
| Temperature 1 | 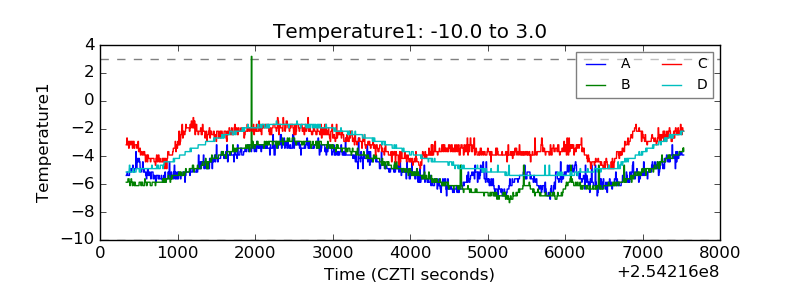 |
| Veto HV Monitor | 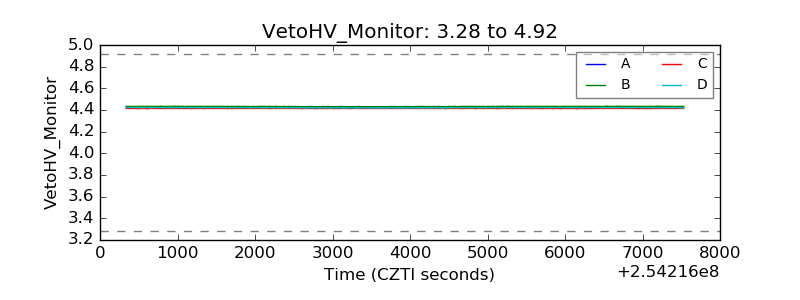 |
| Veto LLD | 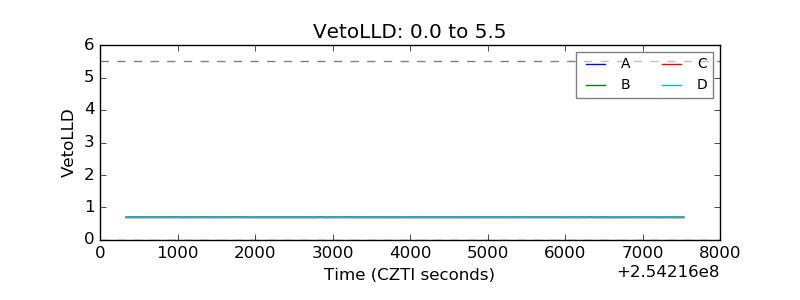 |
| Alpha Counter | 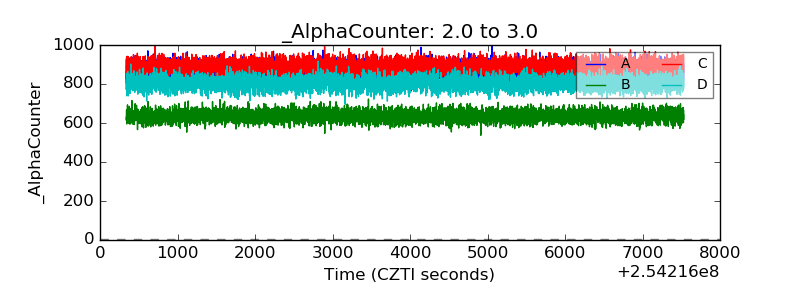 |
| _CPM_Rate | 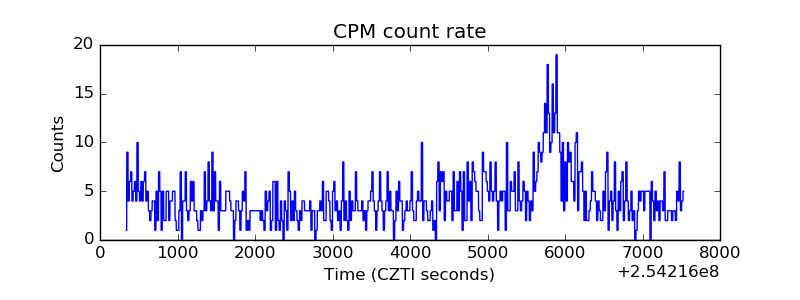 |
| CZT Counter | 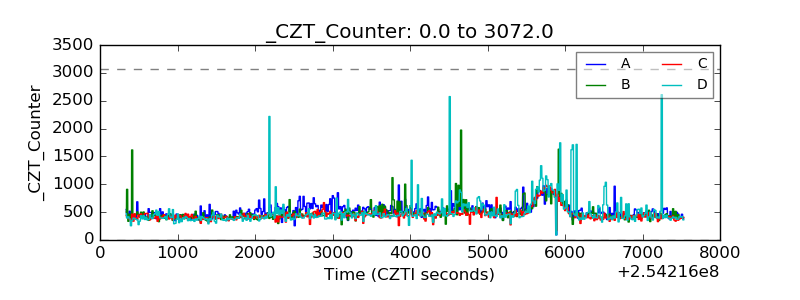 |
| +2.5 Volts monitor |  |
| +5 Volts monitor | 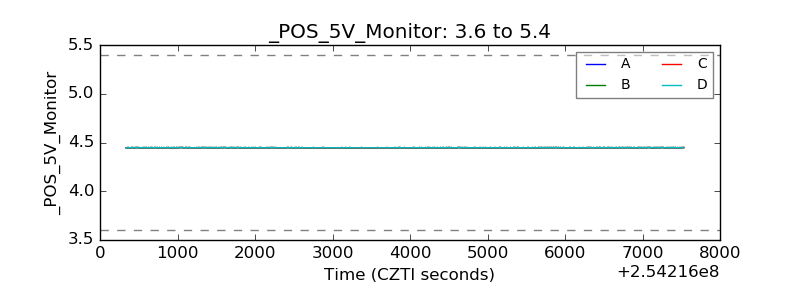 |
| _ROLL_ROT | 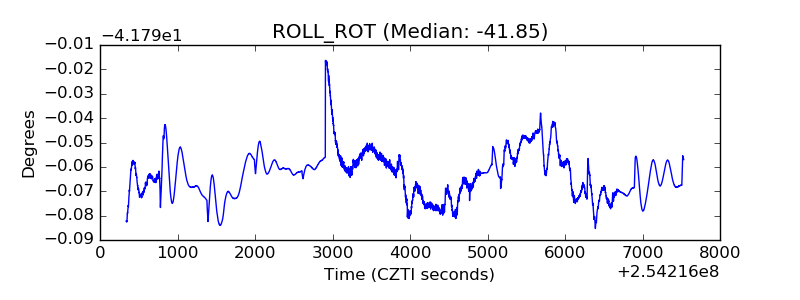 |
| _Roll_DEC | 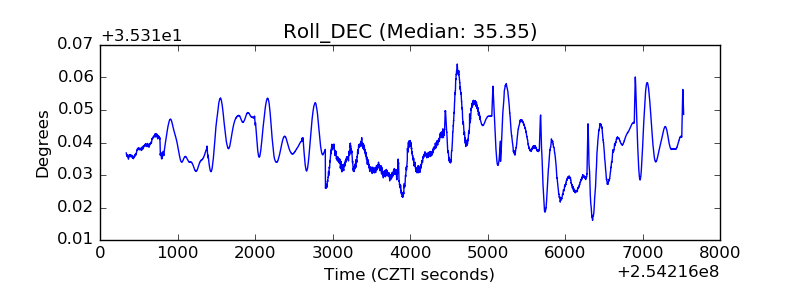 |
| _Roll_RA | 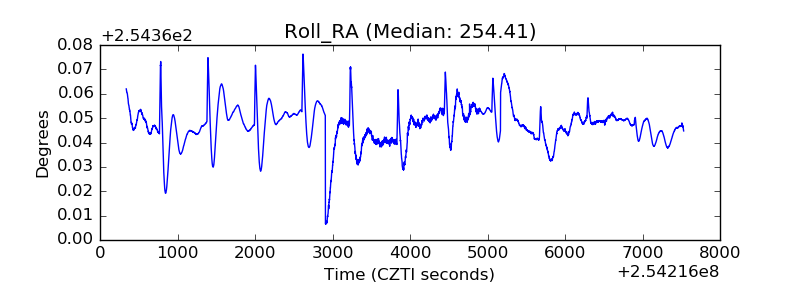 |
| Veto Counter | 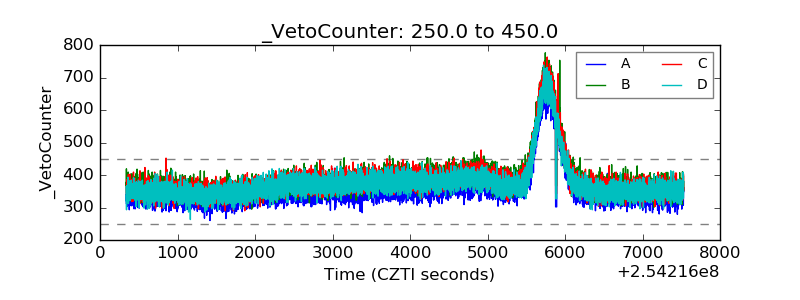 |