| Param | Original file | Final file |
|---|---|---|
| Filename | modeM0/AS1A04_230T01_9000001854_12528cztM0_level2.evt | modeM0/AS1A04_230T01_9000001854_12528cztM0_level2_quad_clean.evt |
| Size (bytes) | 950,201,280 | 145,638,720 |
| Size | 906.2 MB | 138.9 MB |
| Events in quadrant A | 6,413,288 | 913,746 |
| Events in quadrant B | 6,175,956 | 923,984 |
| Events in quadrant C | 5,565,383 | 904,695 |
| Events in quadrant D | 9,787,244 | 814,100 |
| Mode M9 | |||
|---|---|---|---|
| Quadrant | BADHDUFLAG | Total packets | Discarded packets |
| A | 0 | 12 | 0 |
| B | 0 | 12 | 0 |
| C | 0 | 12 | 0 |
| D | 0 | 12 | 0 |
| Mode SS | |||
|---|---|---|---|
| Quadrant | BADHDUFLAG | Total packets | Discarded packets |
| A | 0 | 252 | 0 |
| B | 0 | 252 | 0 |
| C | 0 | 252 | 0 |
| D | 0 | 252 | 0 |
| Mode M0 | |||
|---|---|---|---|
| Quadrant | BADHDUFLAG | Total packets | Discarded packets |
| A | 0 | 26520 | 3 |
| B | 0 | 26195 | 2 |
| C | 0 | 25043 | 2 |
| D | 0 | 37442 | 2 |
| Quadrant | Total seconds | Saturated seconds | Saturation percentage |
|---|---|---|---|
| A | 12343 | 143 | 1.158551% |
| B | 12343 | 159 | 1.288180% |
| C | 12343 | 109 | 0.883092% |
| D | 12343 | 1063 | 8.612169% |
Noise dominated data is calculated using 1-second bins in cleaned event files. If a bin has >2000 counts, and if more than 50% of those come from <1% of pixels, then it is considered to be noise-dominated and hence unusable.
| Quadrant | # 1 sec bins | Bins with >0 counts | Bins with >2000 counts | High rate bins dominated by noise | Noise dominated (total time) | Noise dominated (detector-on time) | Marked lightcurve |
|---|---|---|---|---|---|---|---|
| A | 13614 | 12345 | 0 | 0 | 0.00% | 0.00% | 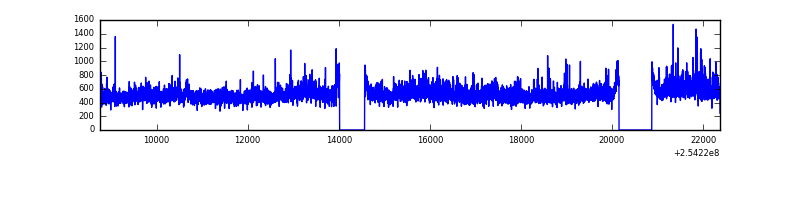 |
| B | 13614 | 12344 | 15 | 15 | 0.11% | 0.12% | 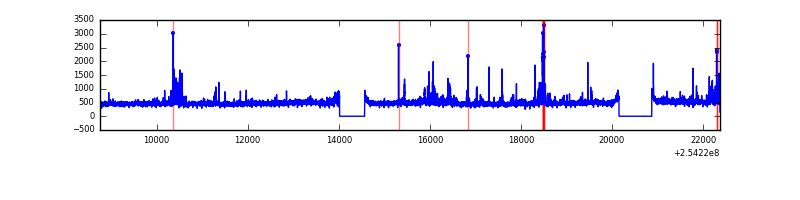 |
| C | 13614 | 12345 | 4 | 4 | 0.03% | 0.03% | 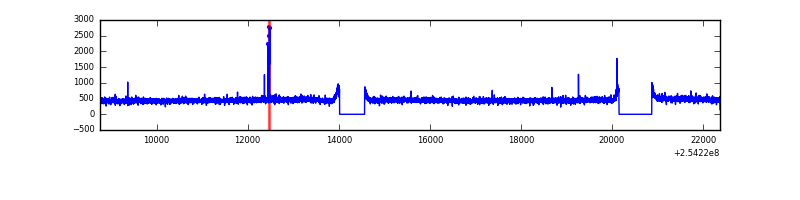 |
| D | 13614 | 12344 | 930 | 930 | 6.83% | 7.53% | 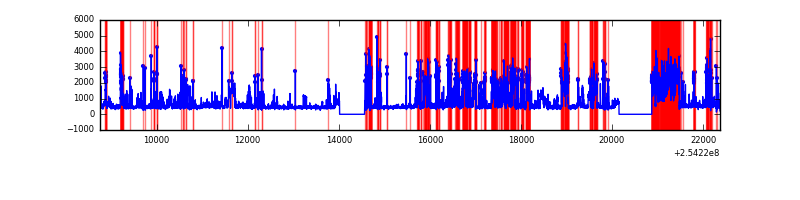 |
Top three noisy pixels from each quadrant. If the there are fewer than three noisy pixels in the level2.evt file, extra rows are filled as -1
| Pixel properties | Quadrant properties | ||||||
|---|---|---|---|---|---|---|---|
| Quadrant | DetID | PixID | Counts | Sigma | Mean | Median | Sigma |
| A | 1 | 162 | 203093 | 674.92 | 1467 | 1437 | 298.8 |
| A | 8 | 15 | 137666 | 455.95 | 1467 | 1437 | 298.8 |
| A | 1 | 178 | 125712 | 415.94 | 1467 | 1437 | 298.8 |
| B | 4 | 239 | 290348 | 1033.41 | 1463 | 1427 | 279.6 |
| B | 0 | 214 | 56903 | 198.43 | 1463 | 1427 | 279.6 |
| B | 11 | 51 | 45043 | 156.01 | 1463 | 1427 | 279.6 |
| C | 15 | 208 | 25880 | 73.94 | 1420 | 1426 | 330.7 |
| C | 13 | 61 | 10235 | 26.64 | 1420 | 1426 | 330.7 |
| C | 3 | 202 | 3562 | 6.46 | 1420 | 1426 | 330.7 |
| D | 1 | 52 | 3870644 | 11644.62 | 1370 | 1331 | 332.3 |
| D | 14 | 34 | 175228 | 523.34 | 1370 | 1331 | 332.3 |
| D | 8 | 195 | 158580 | 473.24 | 1370 | 1331 | 332.3 |
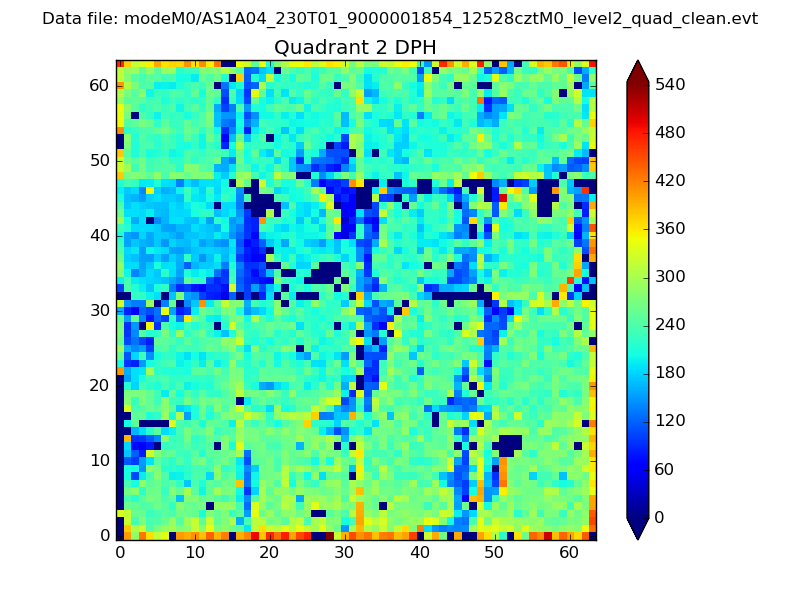
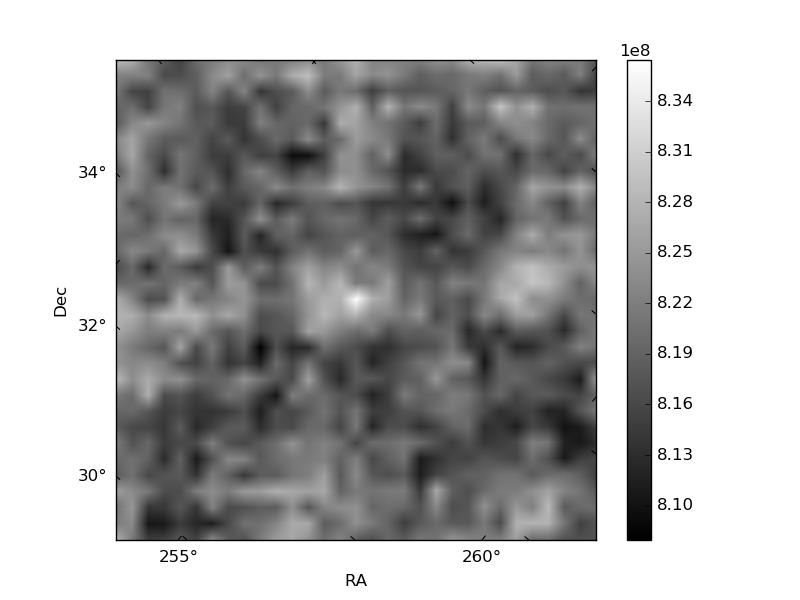
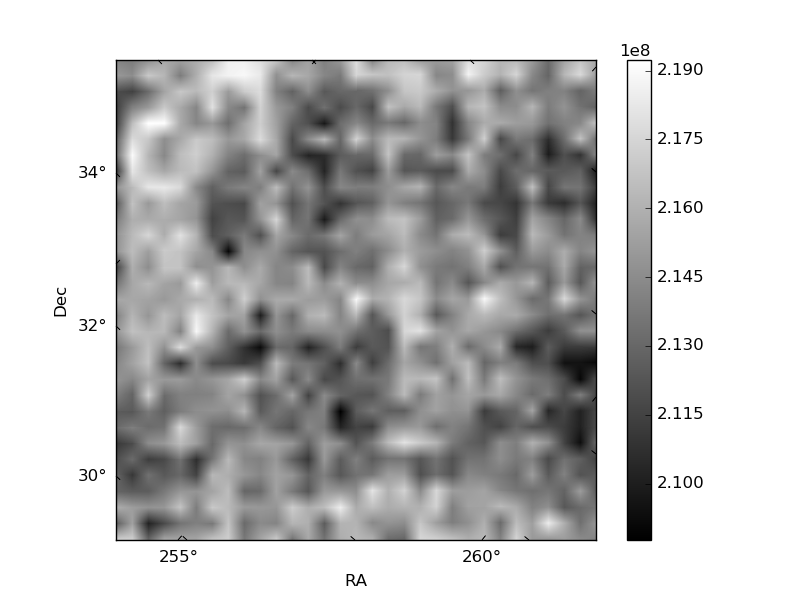
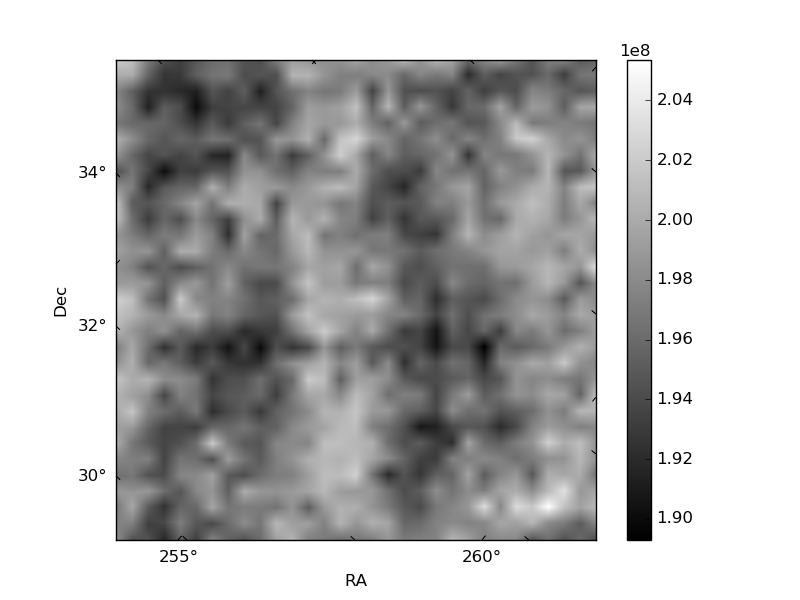
Histogram calculated using DETX and DETY for each event in the final _common_clean file
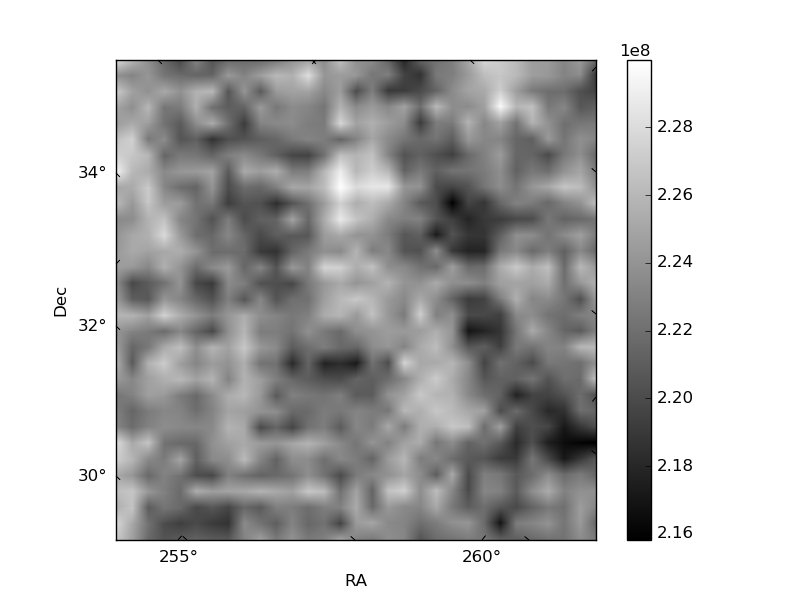
| Quadrant A | 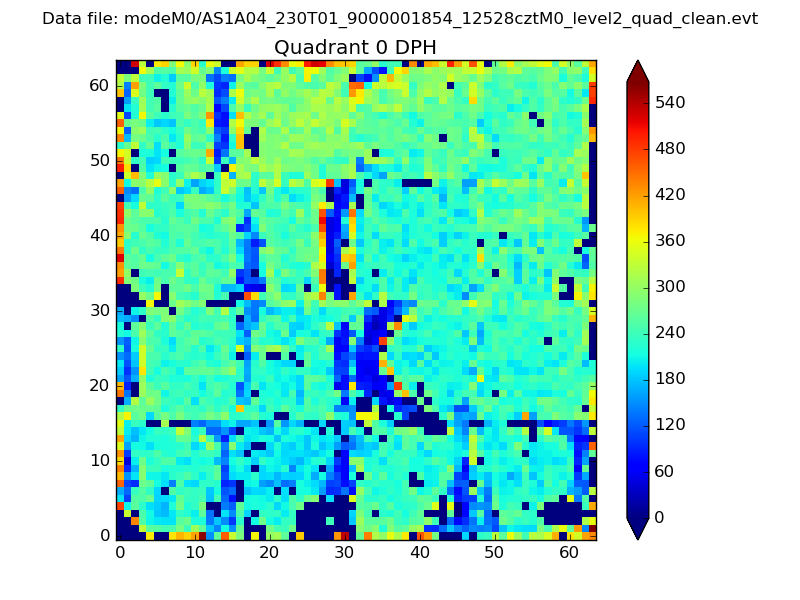 |
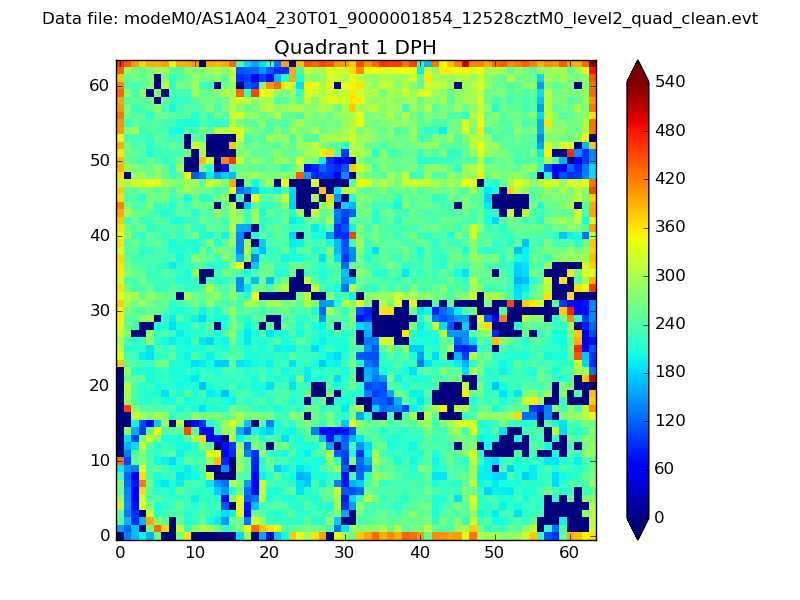 |
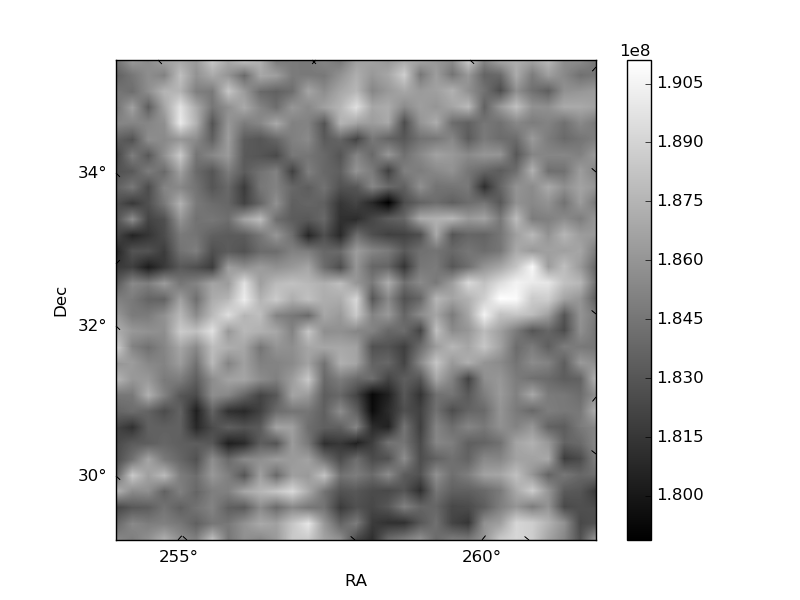
Quadrant B |
|---|---|---|---|
| Quadrant D | 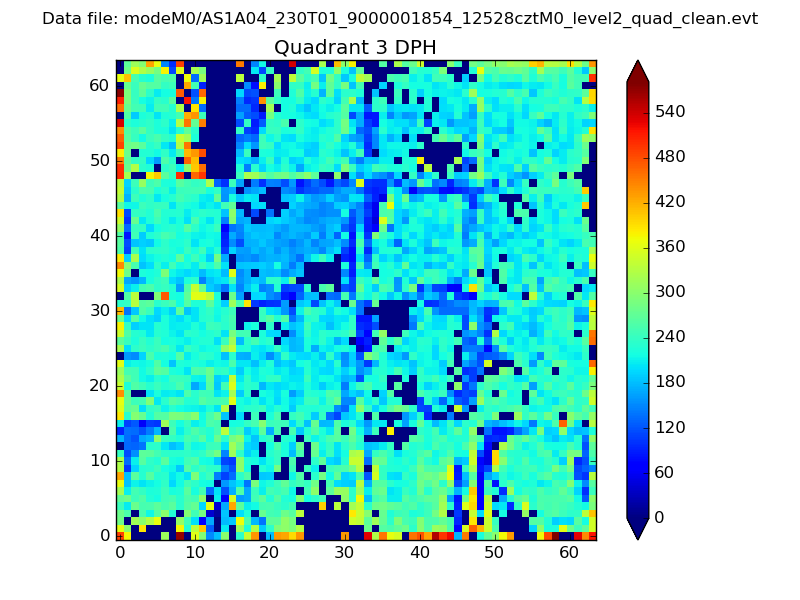 |
 |
Quadrant C |
| Plot type | Count rate plots | Images |
|---|---|---|
| Comparison with Poisson distribution Blue bars denote a histogram of data divided into 1 sec bins. Red curve is a Poisson curve with rate = median count rate of data. |
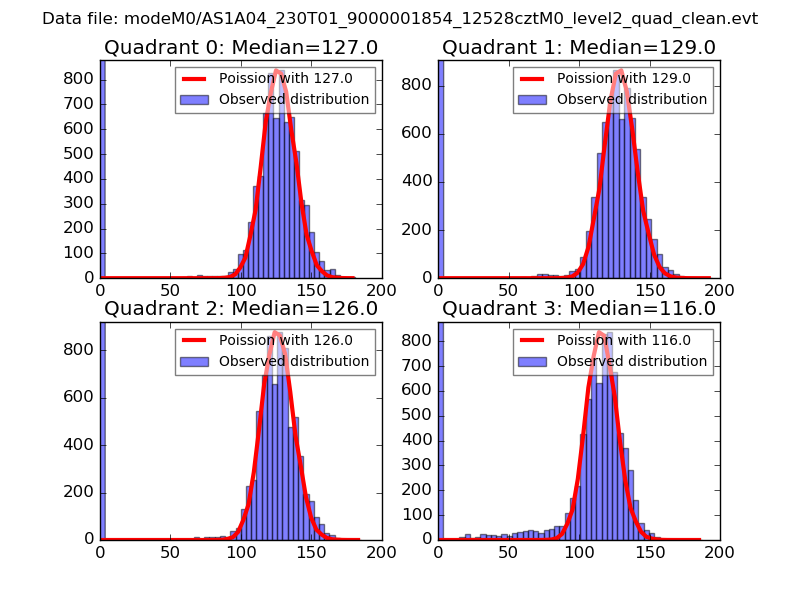 |
 |
| Quadrant-wise count rates Data is divided into 100 sec bins |
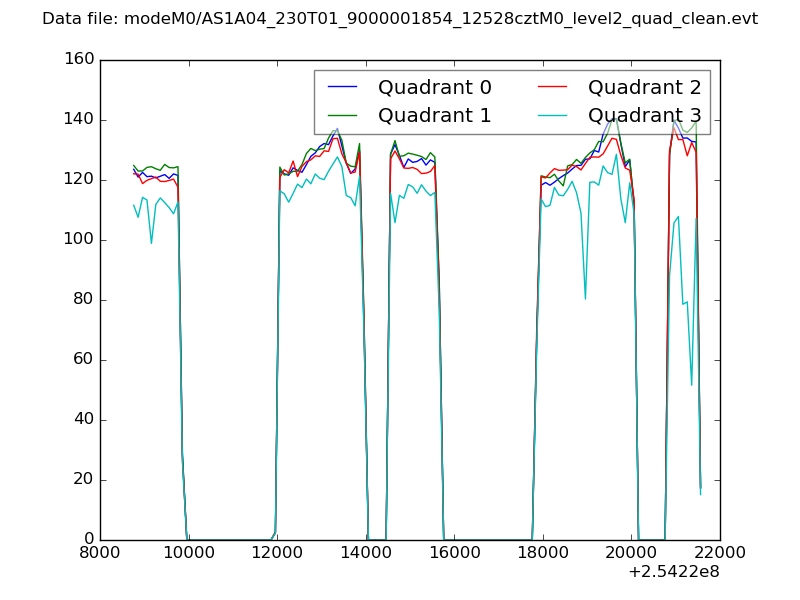 |
|
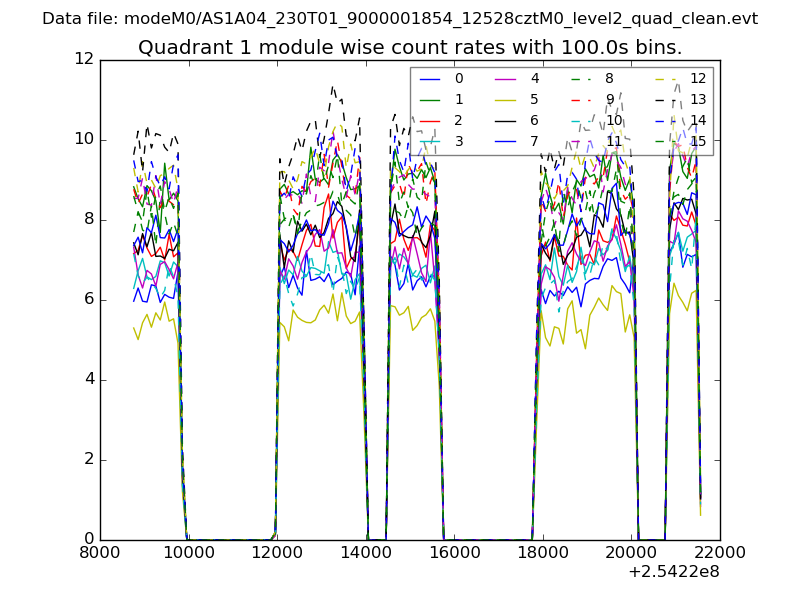
| Module-wise count rates for Quadrant A Data is divided into 100 sec bins |
 |
 |
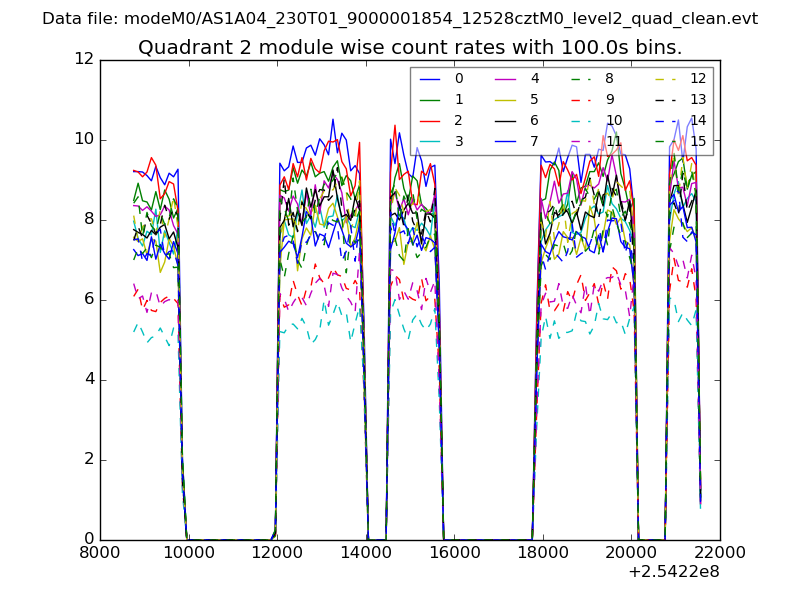
| Module-wise count rates for Quadrant B Data is divided into 100 sec bins |
 |
 |
| Module-wise count rates for Quadrant C Data is divided into 100 sec bins |
 |
 |
| Module-wise count rates for Quadrant D Data is divided into 100 sec bins |
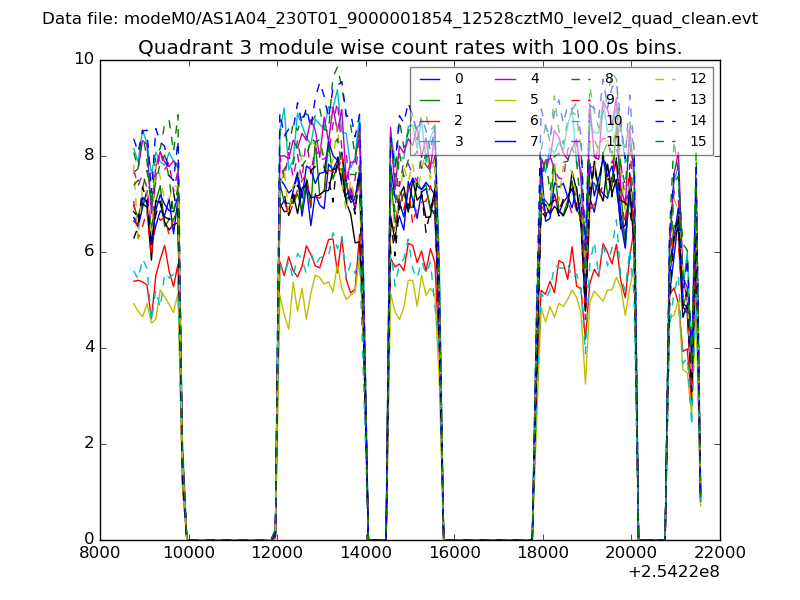 |
 |
| Parameter | Plot |
|---|---|
| CZT HV Monitor | 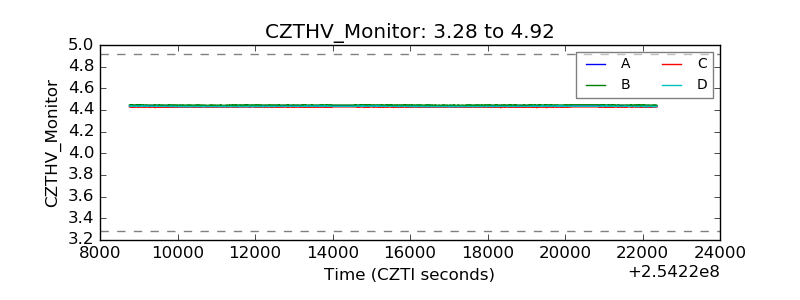 |
| D_VDD | 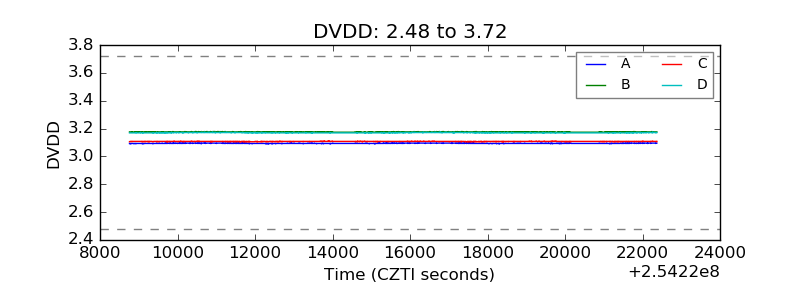 |
| Temperature 1 | 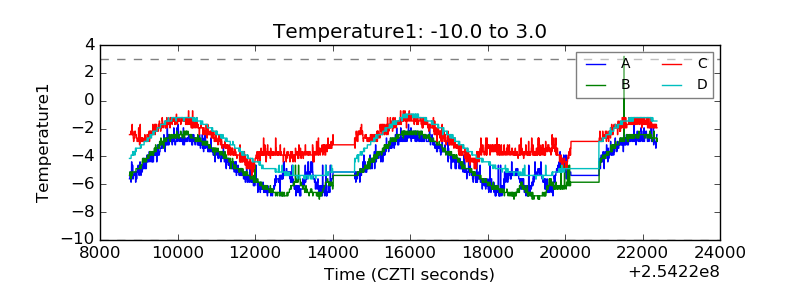 |
| Veto HV Monitor | 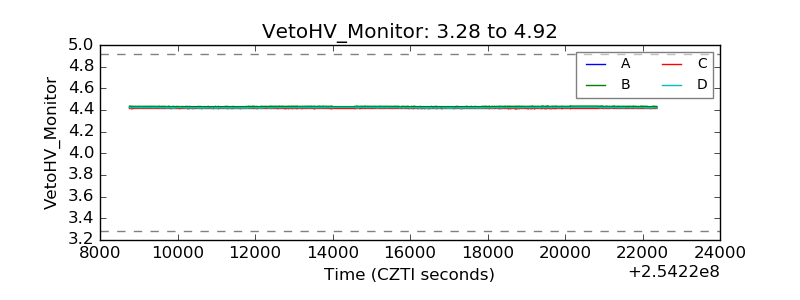 |
| Veto LLD |  |
| Alpha Counter | 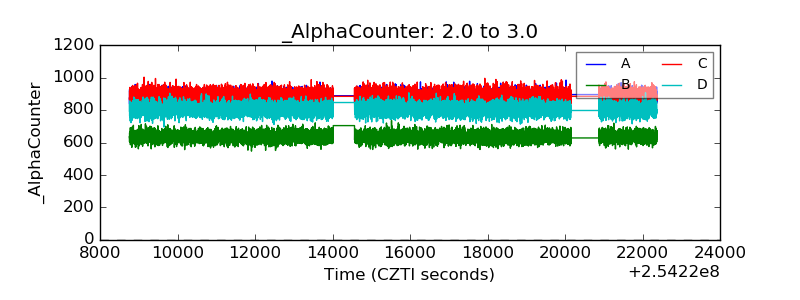 |
| _CPM_Rate | 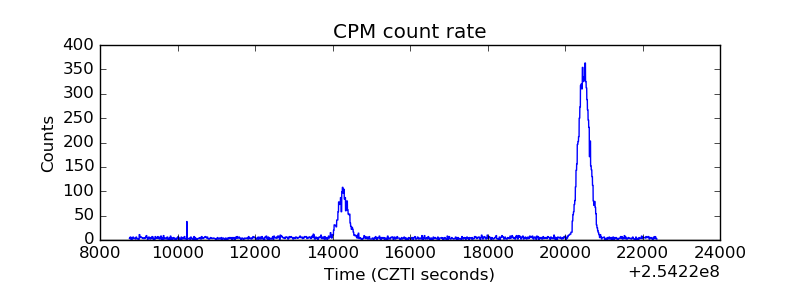 |
| CZT Counter | 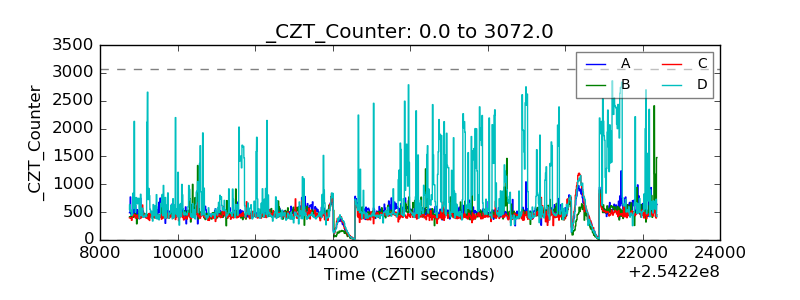 |
| +2.5 Volts monitor |  |
| +5 Volts monitor |  |
| _ROLL_ROT | 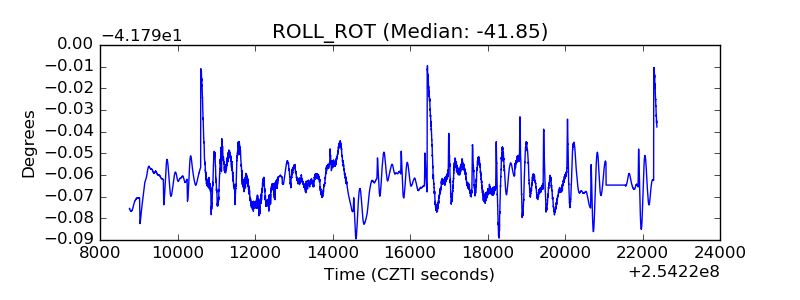 |
| _Roll_DEC | 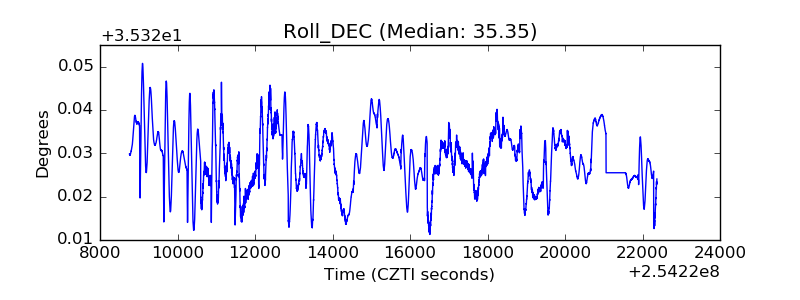 |
| _Roll_RA | 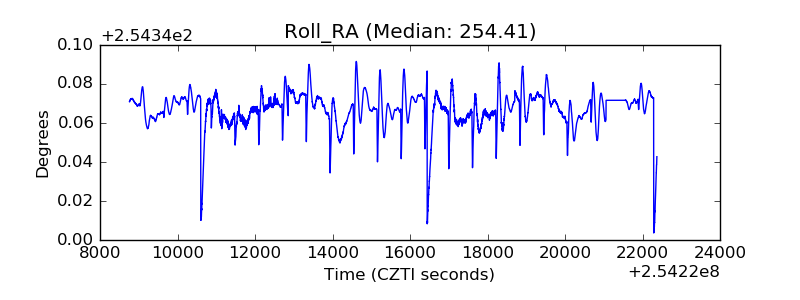 |
| Veto Counter |  |