| Param | Original file | Final file |
|---|---|---|
| Filename | modeM0/AS1A04_230T01_9000001854_12529cztM0_level2.evt | modeM0/AS1A04_230T01_9000001854_12529cztM0_level2_quad_clean.evt |
| Size (bytes) | 491,693,760 | 64,719,360 |
| Size | 468.9 MB | 61.7 MB |
| Events in quadrant A | 3,526,245 | 386,259 |
| Events in quadrant B | 3,556,129 | 389,913 |
| Events in quadrant C | 2,937,663 | 386,150 |
| Events in quadrant D | 4,438,397 | 352,494 |
| Mode M9 | |||
|---|---|---|---|
| Quadrant | BADHDUFLAG | Total packets | Discarded packets |
| A | 0 | 9 | 0 |
| B | 0 | 9 | 0 |
| C | 0 | 9 | 0 |
| D | 0 | 9 | 0 |
| Mode SS | |||
|---|---|---|---|
| Quadrant | BADHDUFLAG | Total packets | Discarded packets |
| A | 0 | 130 | 0 |
| B | 0 | 130 | 0 |
| C | 0 | 130 | 0 |
| D | 0 | 130 | 0 |
| Mode M0 | |||
|---|---|---|---|
| Quadrant | BADHDUFLAG | Total packets | Discarded packets |
| A | 0 | 14412 | 2 |
| B | 0 | 14538 | 1 |
| C | 0 | 12973 | 1 |
| D | 0 | 17543 | 1 |
| Quadrant | Total seconds | Saturated seconds | Saturation percentage |
|---|---|---|---|
| A | 6371 | 82 | 1.287082% |
| B | 6371 | 95 | 1.491132% |
| C | 6371 | 47 | 0.737718% |
| D | 6371 | 446 | 7.000471% |
Noise dominated data is calculated using 1-second bins in cleaned event files. If a bin has >2000 counts, and if more than 50% of those come from <1% of pixels, then it is considered to be noise-dominated and hence unusable.
| Quadrant | # 1 sec bins | Bins with >0 counts | Bins with >2000 counts | High rate bins dominated by noise | Noise dominated (total time) | Noise dominated (detector-on time) | Marked lightcurve |
|---|---|---|---|---|---|---|---|
| A | 7282 | 6372 | 1 | 1 | 0.01% | 0.02% |  |
| B | 7282 | 6372 | 28 | 28 | 0.38% | 0.44% | 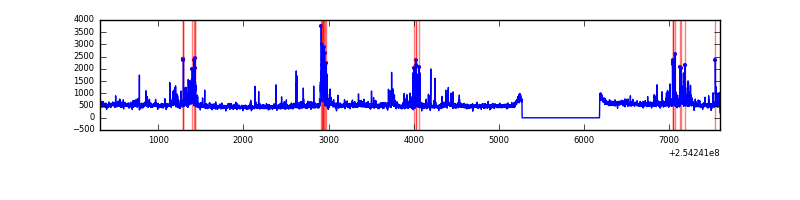 |
| C | 7282 | 6372 | 0 | 0 | 0.00% | 0.00% | 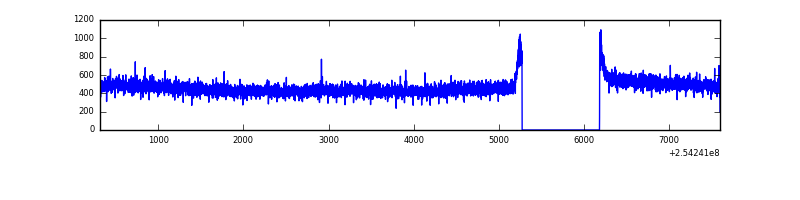 |
| D | 7282 | 6372 | 350 | 350 | 4.81% | 5.49% | 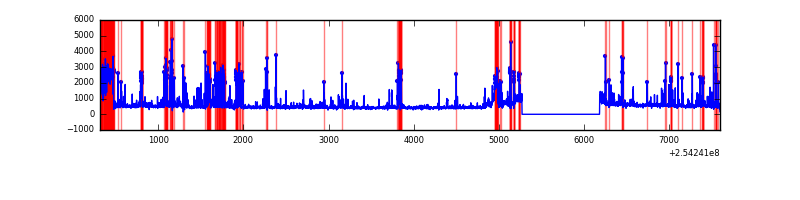 |
Top three noisy pixels from each quadrant. If the there are fewer than three noisy pixels in the level2.evt file, extra rows are filled as -1
| Pixel properties | Quadrant properties | ||||||
|---|---|---|---|---|---|---|---|
| Quadrant | DetID | PixID | Counts | Sigma | Mean | Median | Sigma |
| A | 1 | 162 | 160786 | 1000.86 | 775 | 759 | 159.9 |
| A | 1 | 178 | 100300 | 622.56 | 775 | 759 | 159.9 |
| A | 1 | 161 | 83907 | 520.04 | 775 | 759 | 159.9 |
| B | 4 | 239 | 369875 | 2500.06 | 771 | 755 | 147.6 |
| B | 0 | 205 | 58031 | 387.93 | 771 | 755 | 147.6 |
| B | 11 | 51 | 49768 | 331.97 | 771 | 755 | 147.6 |
| C | 13 | 61 | 5400 | 26.52 | 753 | 757 | 175.1 |
| C | 3 | 202 | 1907 | 6.57 | 753 | 757 | 175.1 |
| C | 14 | 234 | 1739 | 5.61 | 753 | 757 | 175.1 |
| D | 1 | 52 | 1359405 | 7665.61 | 731 | 710 | 177.2 |
| D | 8 | 195 | 164995 | 926.88 | 731 | 710 | 177.2 |
| D | 13 | 104 | 63709 | 355.43 | 731 | 710 | 177.2 |
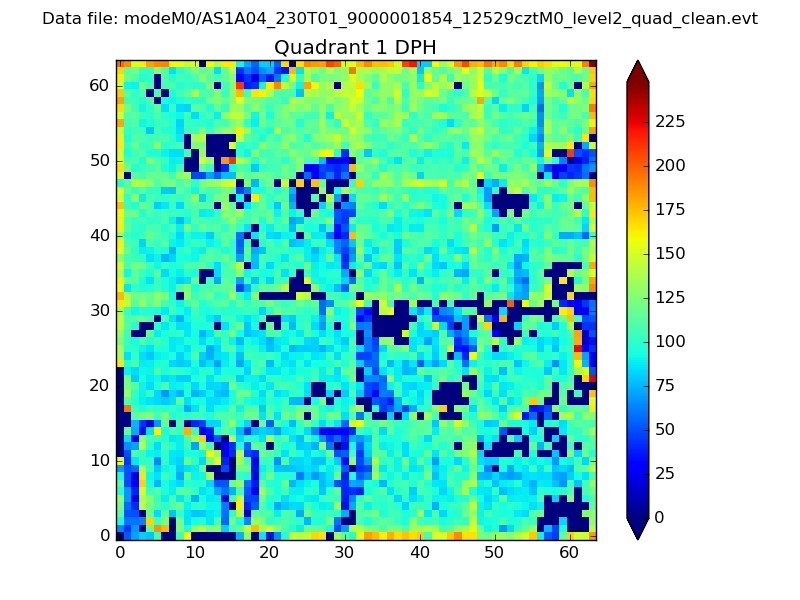
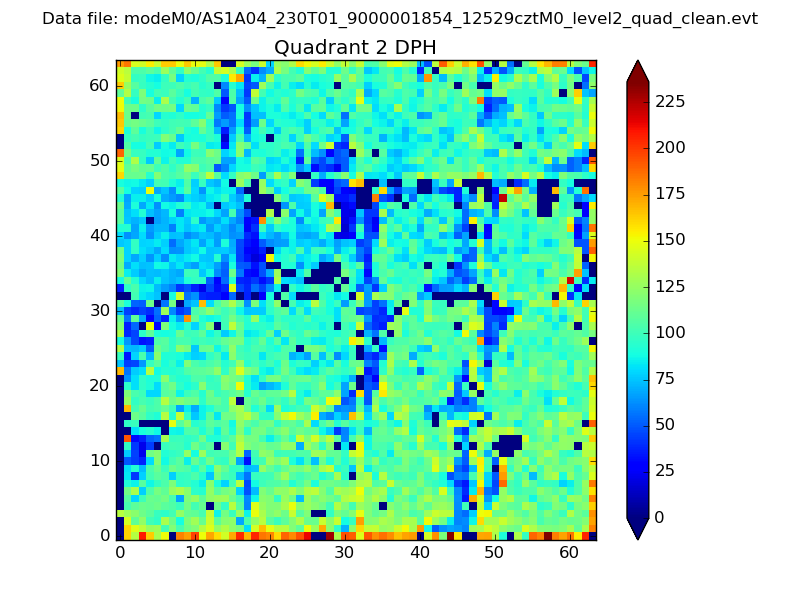
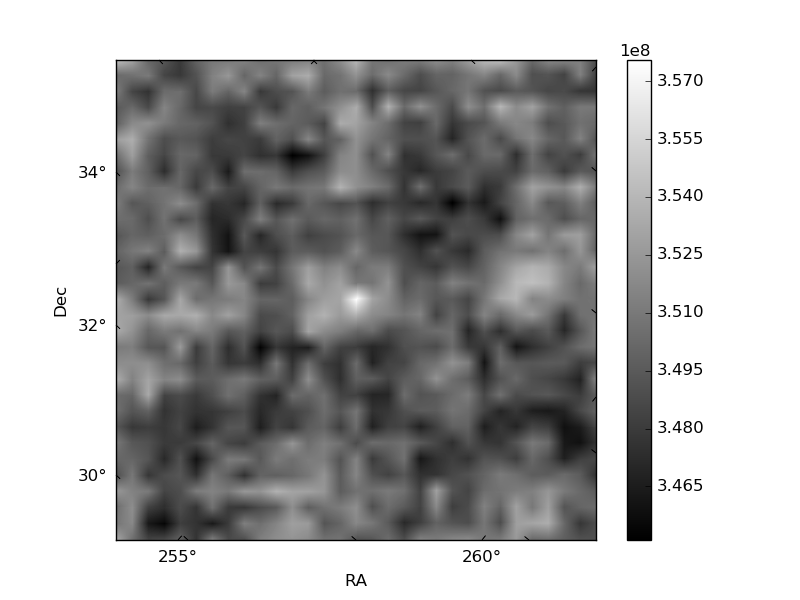
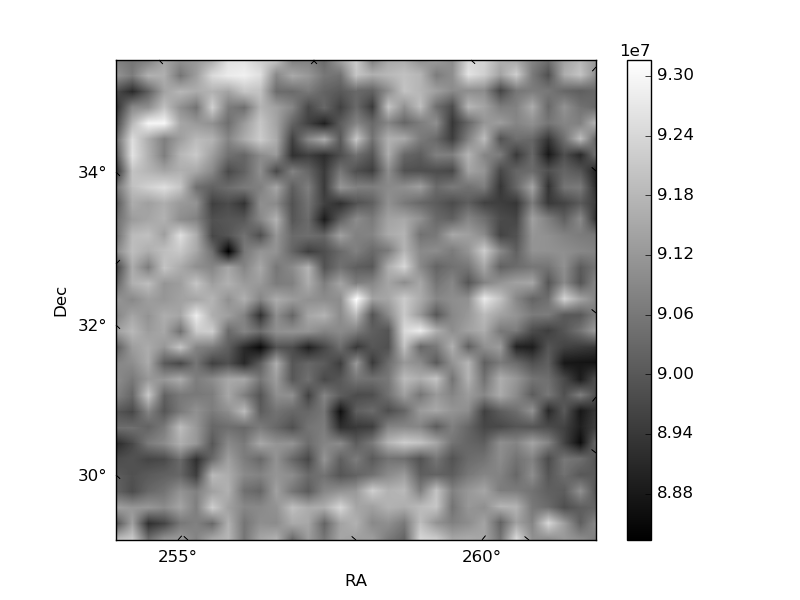
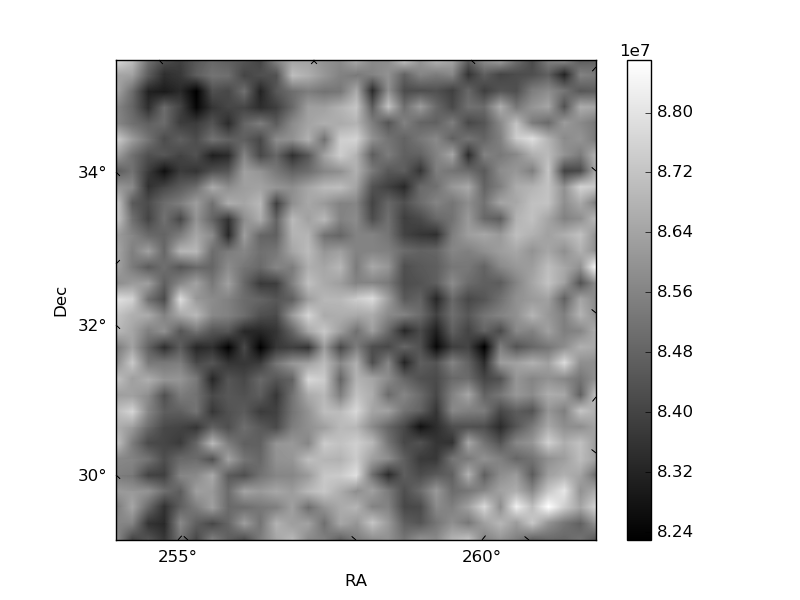
Histogram calculated using DETX and DETY for each event in the final _common_clean file
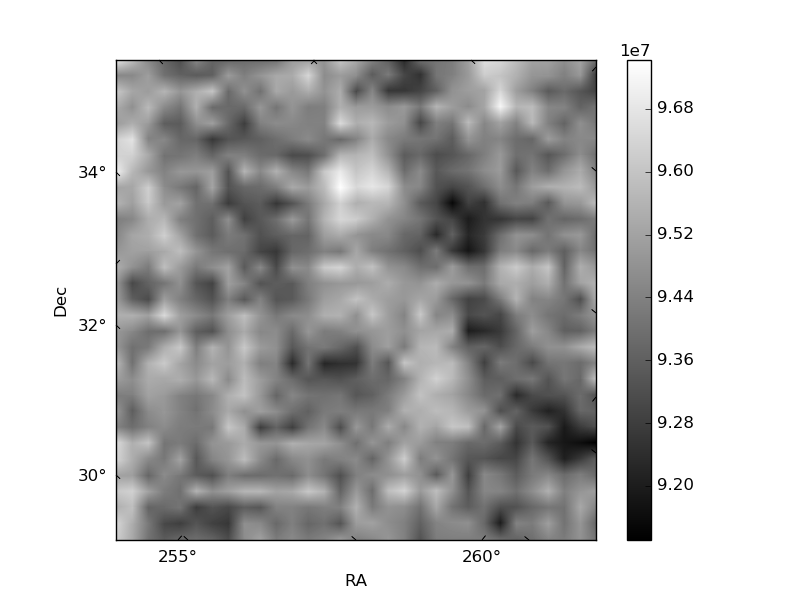
| Quadrant A | 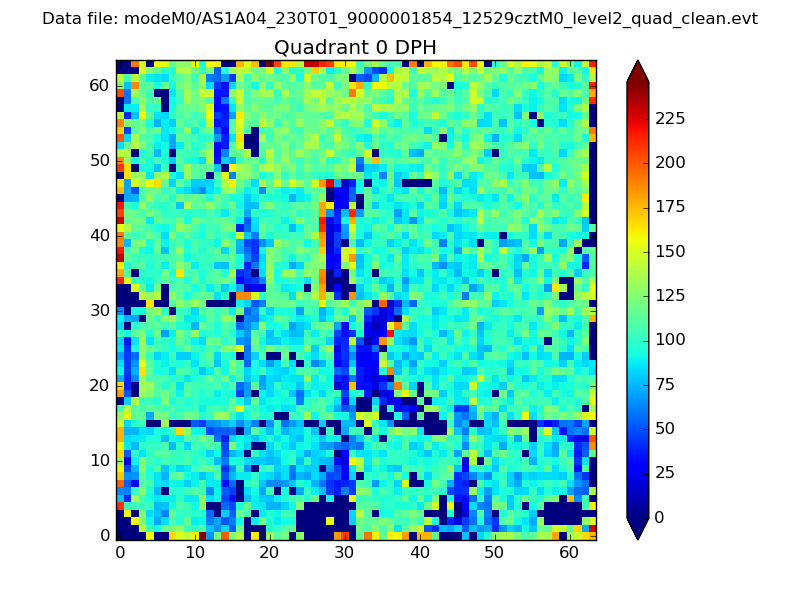 |
 |
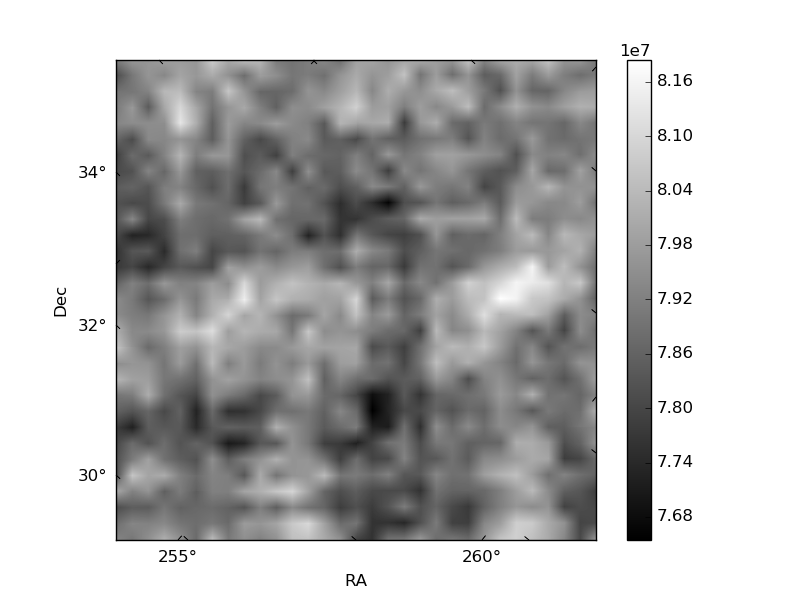
Quadrant B |
|---|---|---|---|
| Quadrant D | 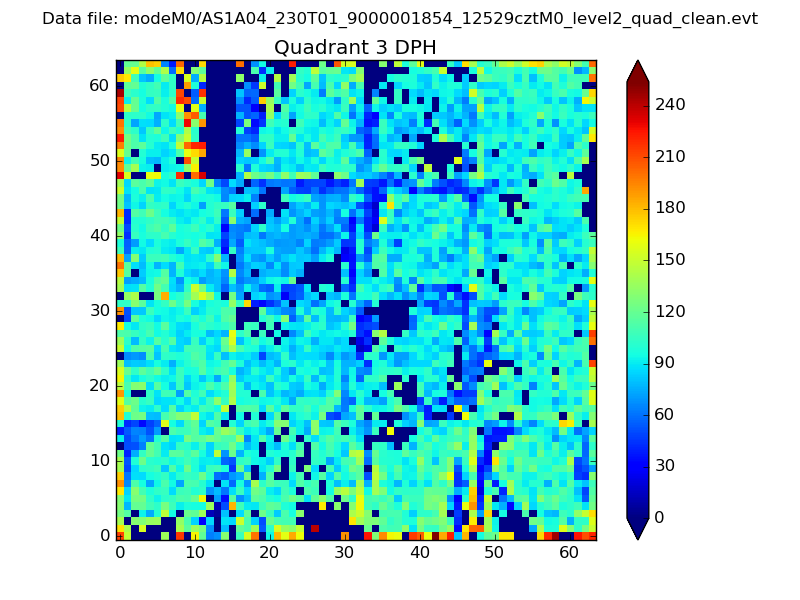 |
 |
Quadrant C |
| Plot type | Count rate plots | Images |
|---|---|---|
| Comparison with Poisson distribution Blue bars denote a histogram of data divided into 1 sec bins. Red curve is a Poisson curve with rate = median count rate of data. |
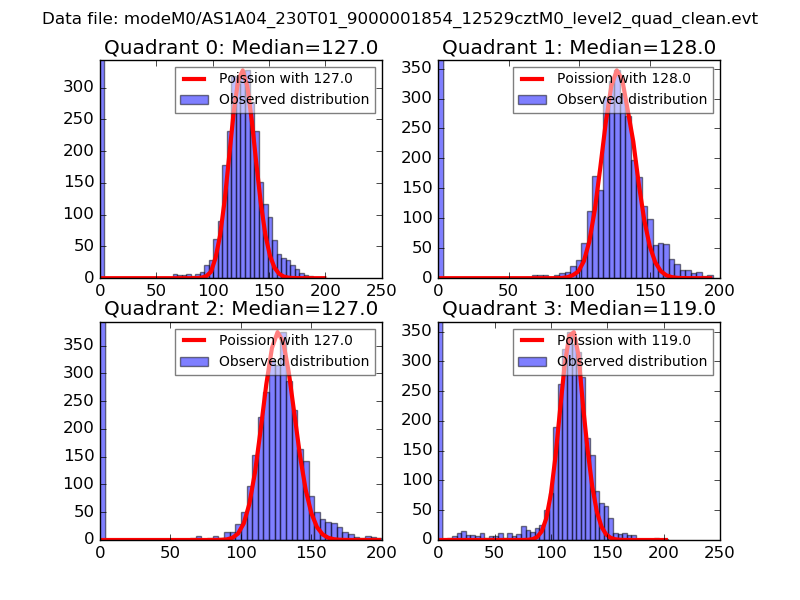 |
 |
| Quadrant-wise count rates Data is divided into 100 sec bins |
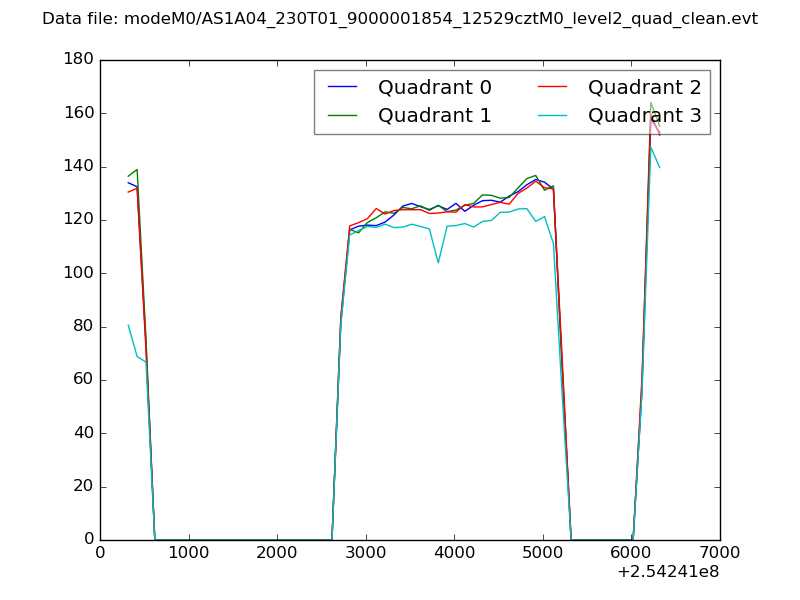 |
|
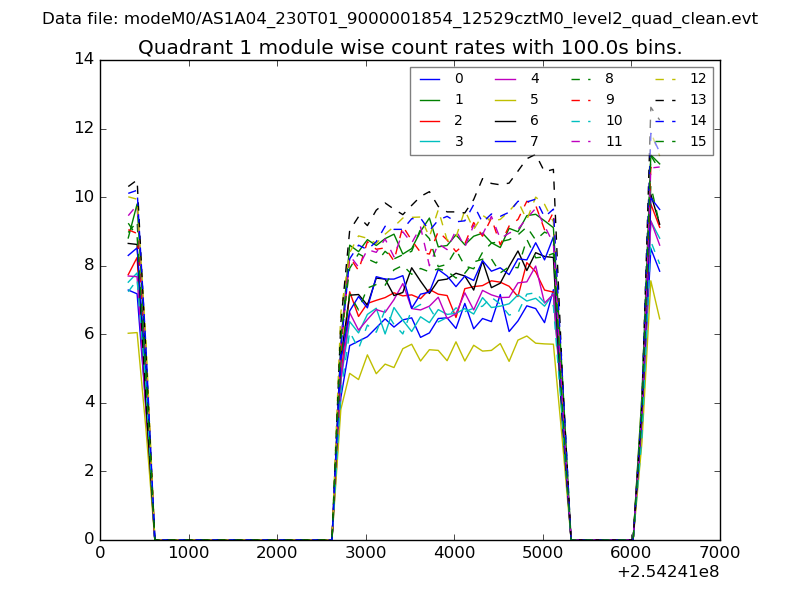
| Module-wise count rates for Quadrant A Data is divided into 100 sec bins |
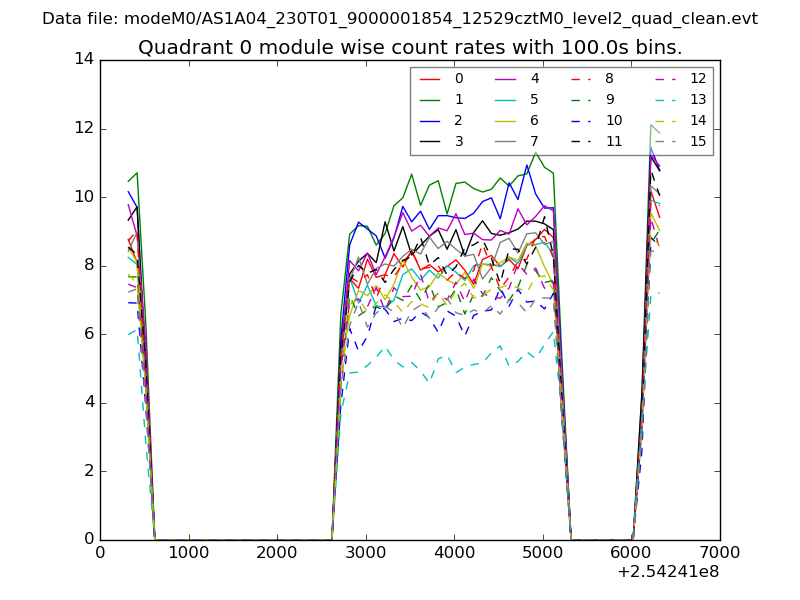 |
 |
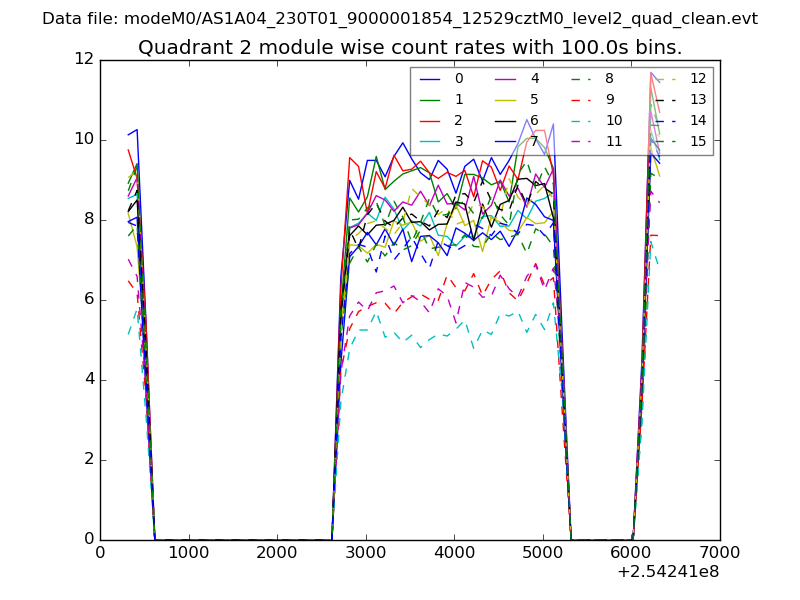
| Module-wise count rates for Quadrant B Data is divided into 100 sec bins |
 |
 |
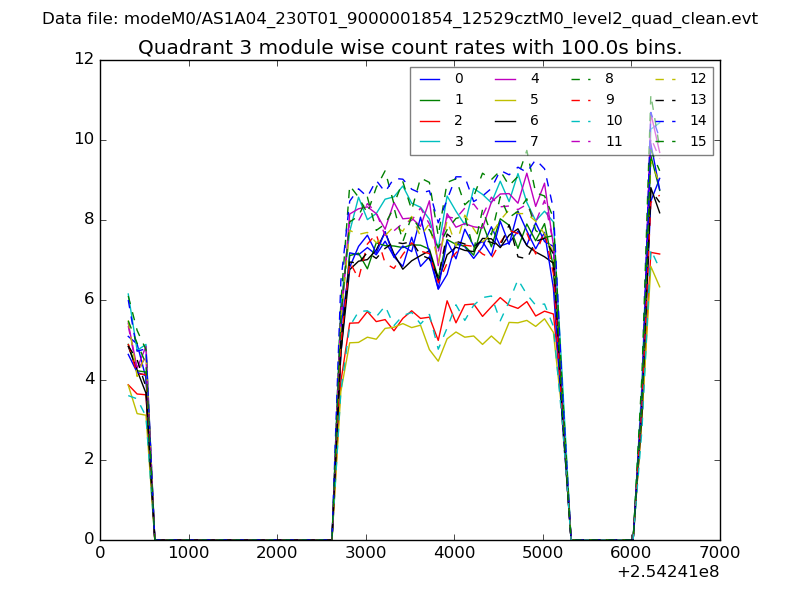
| Module-wise count rates for Quadrant C Data is divided into 100 sec bins |
 |
 |
| Module-wise count rates for Quadrant D Data is divided into 100 sec bins |
 |
 |
| Parameter | Plot |
|---|---|
| CZT HV Monitor | 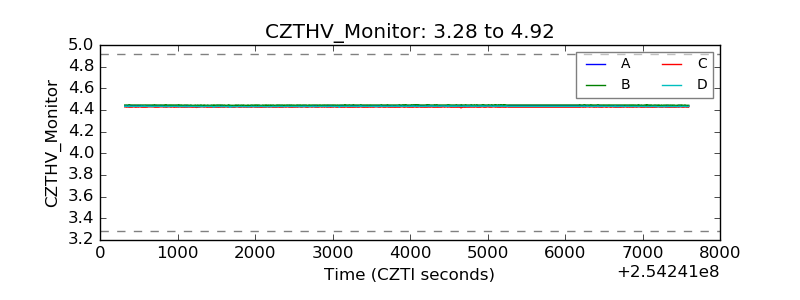 |
| D_VDD |  |
| Temperature 1 | 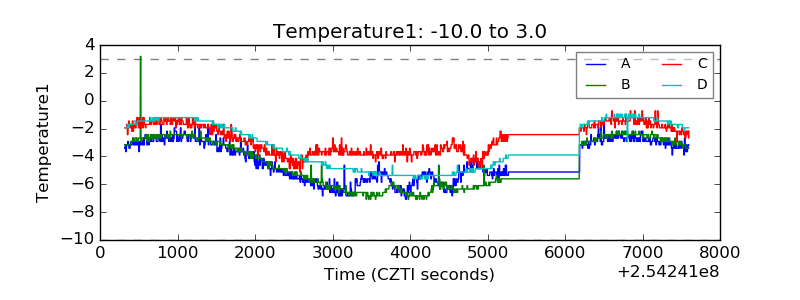 |
| Veto HV Monitor |  |
| Veto LLD | 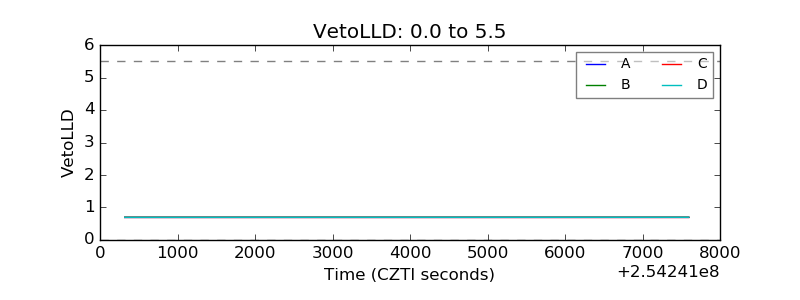 |
| Alpha Counter | 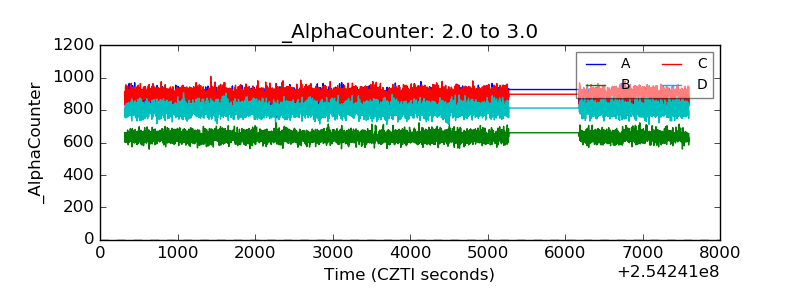 |
| _CPM_Rate | 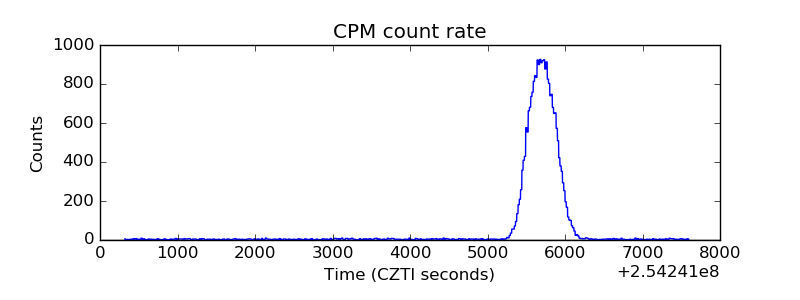 |
| CZT Counter | 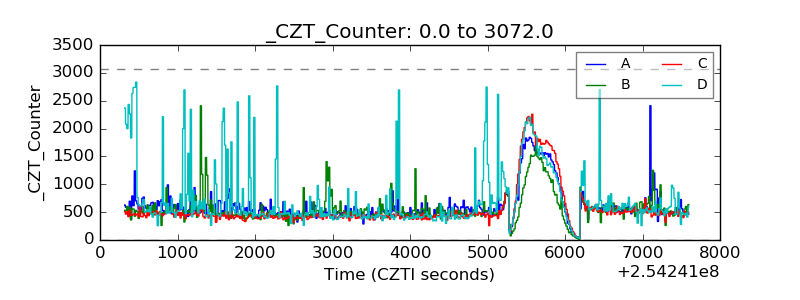 |
| +2.5 Volts monitor |  |
| +5 Volts monitor |  |
| _ROLL_ROT | 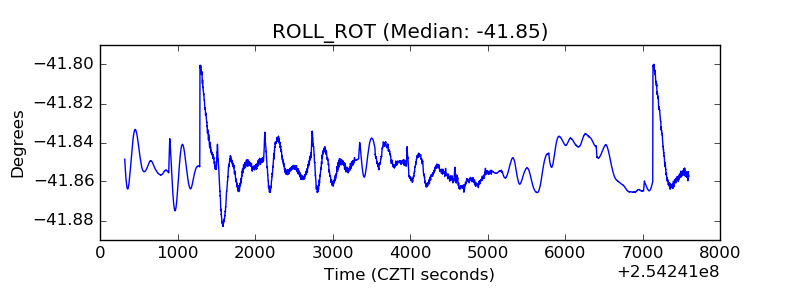 |
| _Roll_DEC | 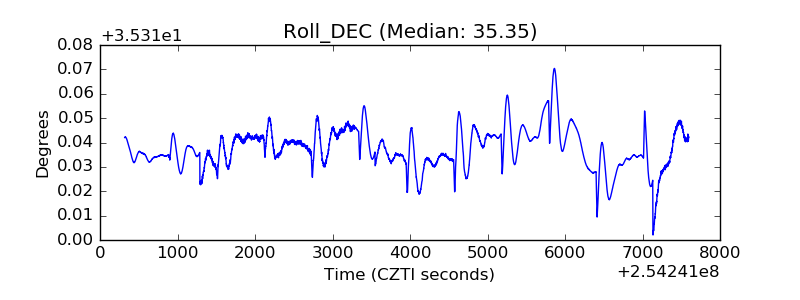 |
| _Roll_RA | 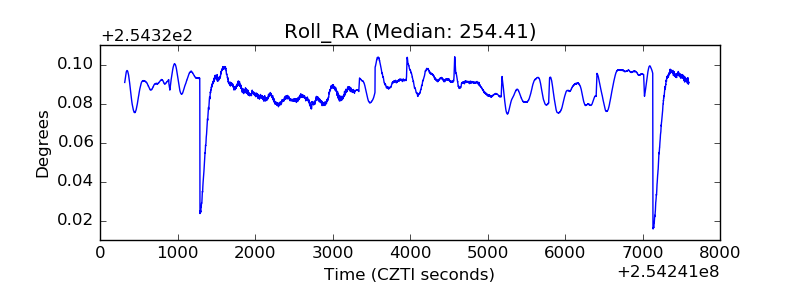 |
| Veto Counter | 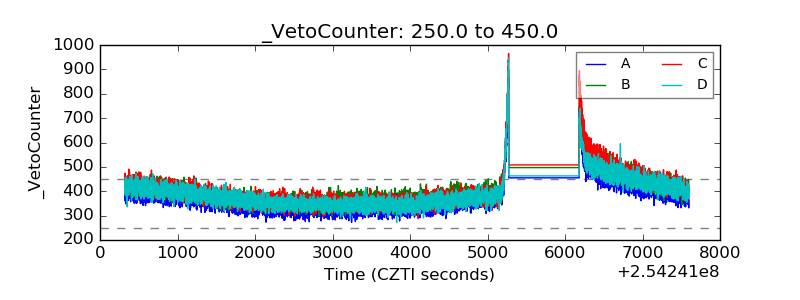 |