| Param | Original file | Final file |
|---|---|---|
| Filename | modeM0/AS1A04_230T01_9000001854_12530cztM0_level2.evt | modeM0/AS1A04_230T01_9000001854_12530cztM0_level2_quad_clean.evt |
| Size (bytes) | 541,992,960 | 63,195,840 |
| Size | 516.9 MB | 60.3 MB |
| Events in quadrant A | 3,568,462 | 374,887 |
| Events in quadrant B | 3,459,511 | 378,689 |
| Events in quadrant C | 3,080,574 | 377,297 |
| Events in quadrant D | 5,868,106 | 331,821 |
| Mode M9 | |||
|---|---|---|---|
| Quadrant | BADHDUFLAG | Total packets | Discarded packets |
| A | 0 | 11 | 0 |
| B | 0 | 11 | 0 |
| C | 0 | 11 | 0 |
| D | 0 | 11 | 0 |
| Mode SS | |||
|---|---|---|---|
| Quadrant | BADHDUFLAG | Total packets | Discarded packets |
| A | 0 | 132 | 0 |
| B | 0 | 132 | 0 |
| C | 0 | 132 | 0 |
| D | 0 | 132 | 0 |
| Mode M0 | |||
|---|---|---|---|
| Quadrant | BADHDUFLAG | Total packets | Discarded packets |
| A | 0 | 14765 | 2 |
| B | 0 | 14382 | 1 |
| C | 0 | 13384 | 1 |
| D | 0 | 21822 | 1 |
| Quadrant | Total seconds | Saturated seconds | Saturation percentage |
|---|---|---|---|
| A | 6452 | 47 | 0.728456% |
| B | 6452 | 61 | 0.945443% |
| C | 6452 | 34 | 0.526968% |
| D | 6452 | 788 | 12.213267% |
Noise dominated data is calculated using 1-second bins in cleaned event files. If a bin has >2000 counts, and if more than 50% of those come from <1% of pixels, then it is considered to be noise-dominated and hence unusable.
| Quadrant | # 1 sec bins | Bins with >0 counts | Bins with >2000 counts | High rate bins dominated by noise | Noise dominated (total time) | Noise dominated (detector-on time) | Marked lightcurve |
|---|---|---|---|---|---|---|---|
| A | 7543 | 6454 | 1 | 1 | 0.01% | 0.02% | 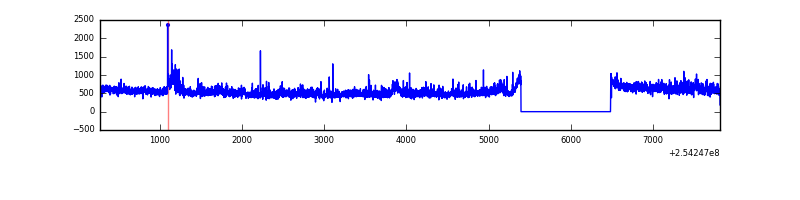 |
| B | 7542 | 6453 | 12 | 12 | 0.16% | 0.19% | 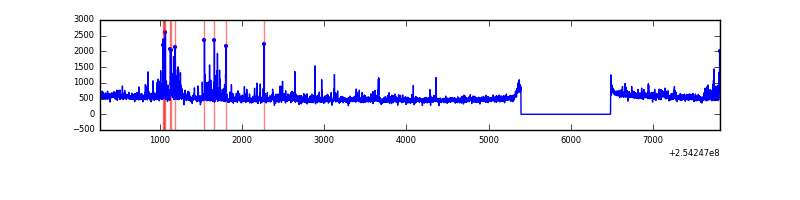 |
| C | 7543 | 6453 | 0 | 0 | 0.00% | 0.00% | 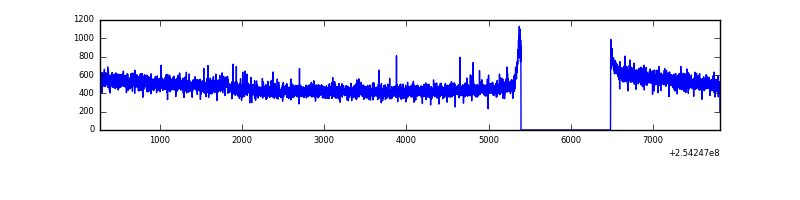 |
| D | 7543 | 6454 | 699 | 699 | 9.27% | 10.83% |  |
Top three noisy pixels from each quadrant. If the there are fewer than three noisy pixels in the level2.evt file, extra rows are filled as -1
| Pixel properties | Quadrant properties | ||||||
|---|---|---|---|---|---|---|---|
| Quadrant | DetID | PixID | Counts | Sigma | Mean | Median | Sigma |
| A | 1 | 162 | 143558 | 877.3 | 803 | 788 | 162.7 |
| A | 1 | 178 | 90091 | 548.75 | 803 | 788 | 162.7 |
| A | 1 | 161 | 74953 | 455.73 | 803 | 788 | 162.7 |
| B | 4 | 239 | 173634 | 1125.36 | 803 | 784 | 153.6 |
| B | 0 | 205 | 65099 | 418.73 | 803 | 784 | 153.6 |
| B | 0 | 230 | 33072 | 210.21 | 803 | 784 | 153.6 |
| C | 3 | 233 | 12919 | 67.09 | 785 | 791 | 180.8 |
| C | 13 | 61 | 5857 | 28.02 | 785 | 791 | 180.8 |
| C | 9 | 221 | 4164 | 18.66 | 785 | 791 | 180.8 |
| D | 1 | 52 | 2784067 | 15230.34 | 750 | 729 | 182.7 |
| D | 8 | 195 | 146416 | 797.19 | 750 | 729 | 182.7 |
| D | 7 | 71 | 32637 | 174.6 | 750 | 729 | 182.7 |
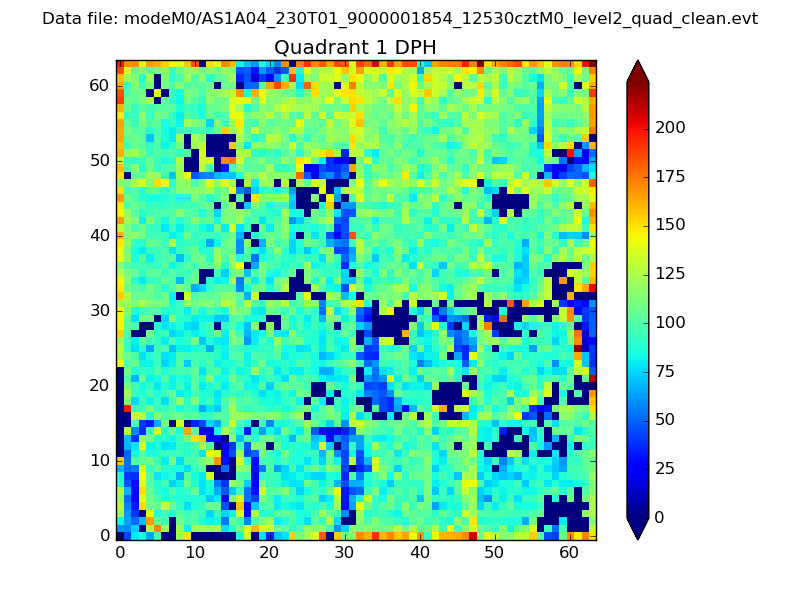
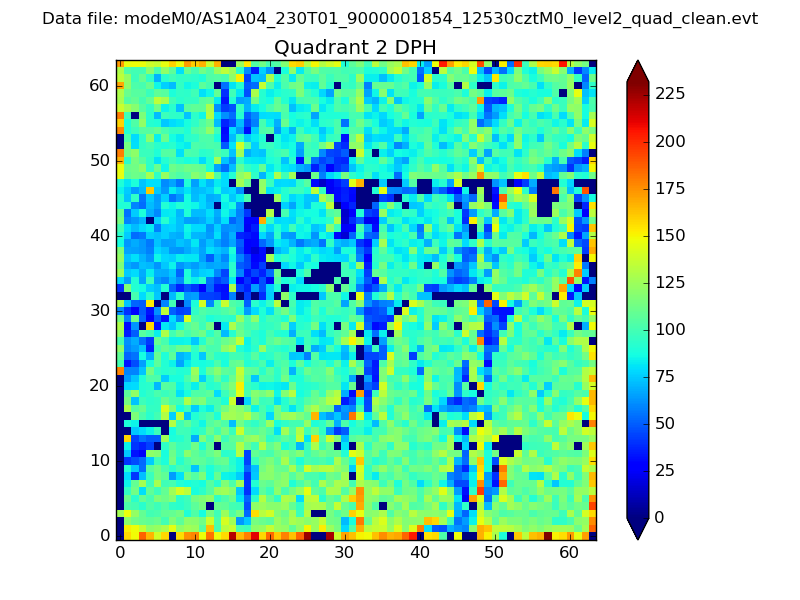
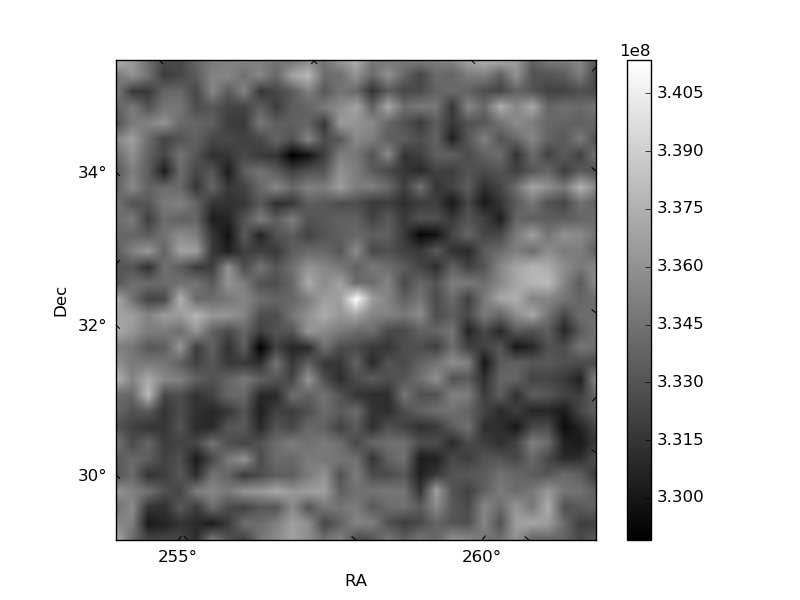
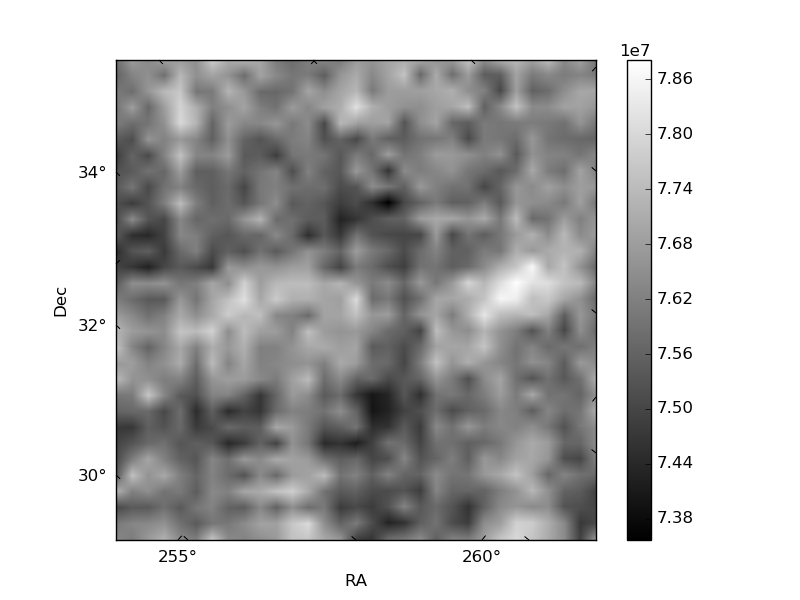
Histogram calculated using DETX and DETY for each event in the final _common_clean file
| Quadrant A | 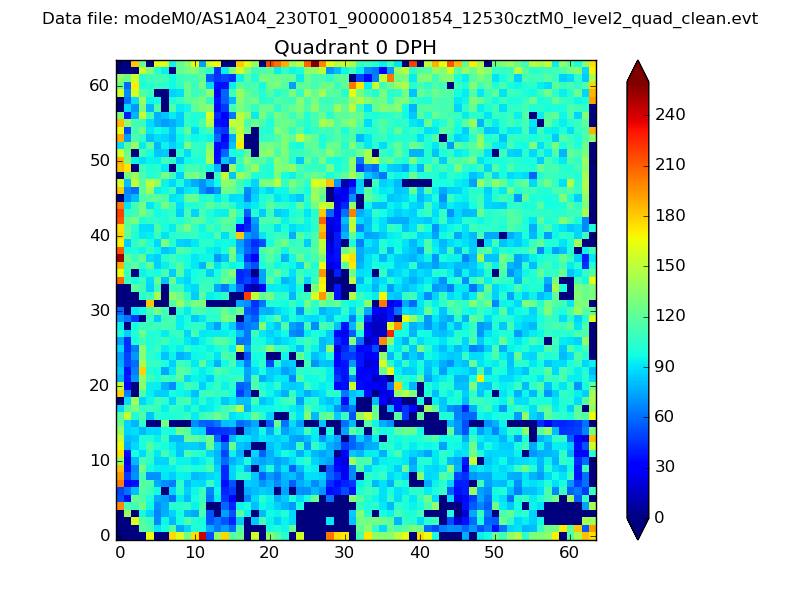 |
 |
Quadrant B |
|---|---|---|---|
| Quadrant D | 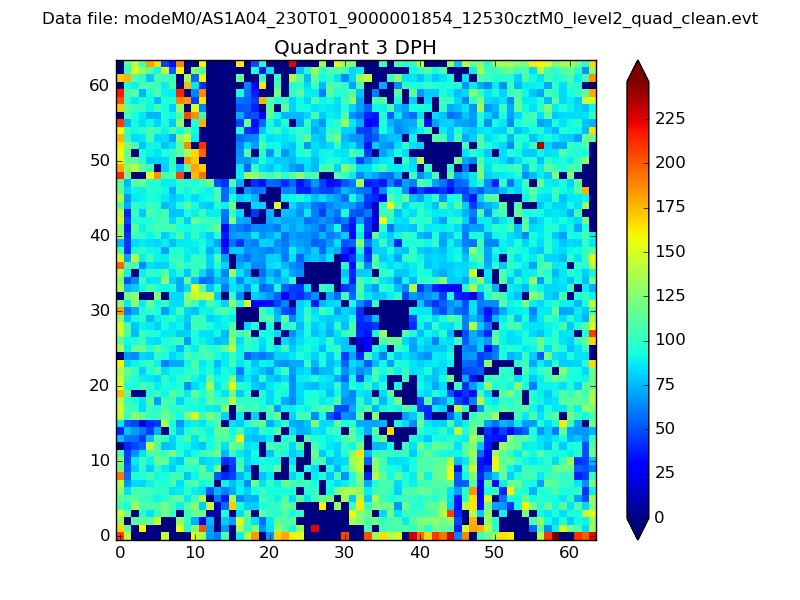 |
 |
Quadrant C |
| Plot type | Count rate plots | Images |
|---|---|---|
| Comparison with Poisson distribution Blue bars denote a histogram of data divided into 1 sec bins. Red curve is a Poisson curve with rate = median count rate of data. |
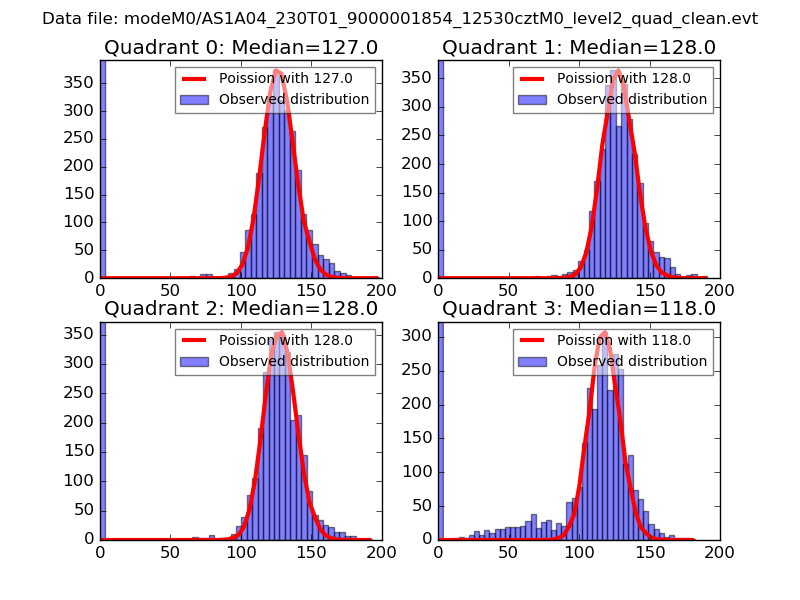 |
 |
| Quadrant-wise count rates Data is divided into 100 sec bins |
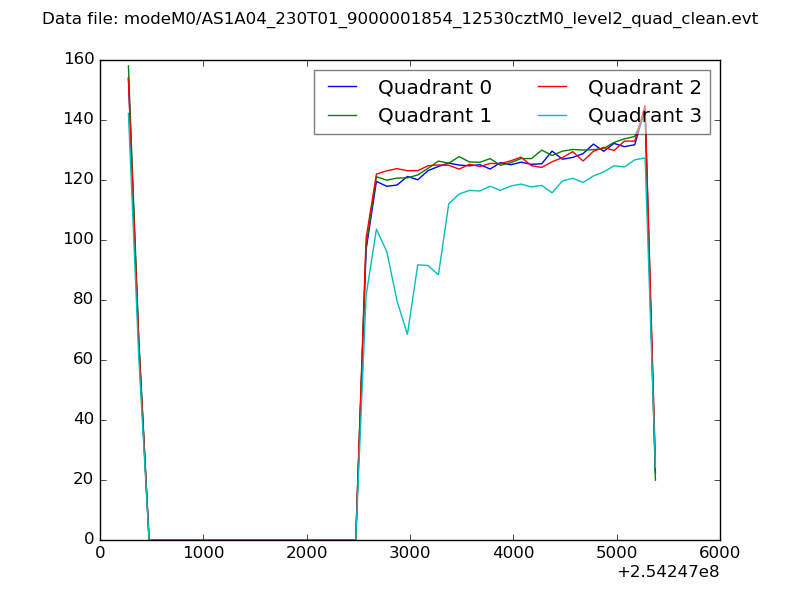 |
|
| Module-wise count rates for Quadrant A Data is divided into 100 sec bins |
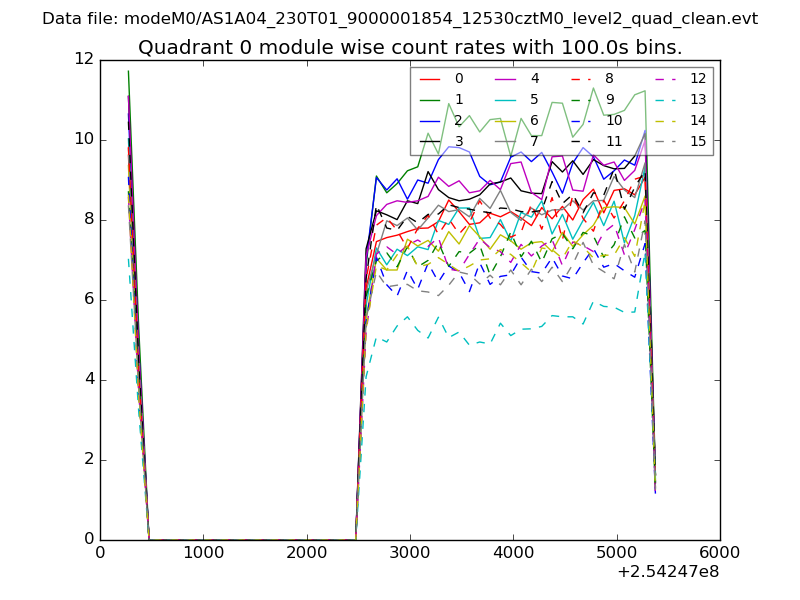 |
 |
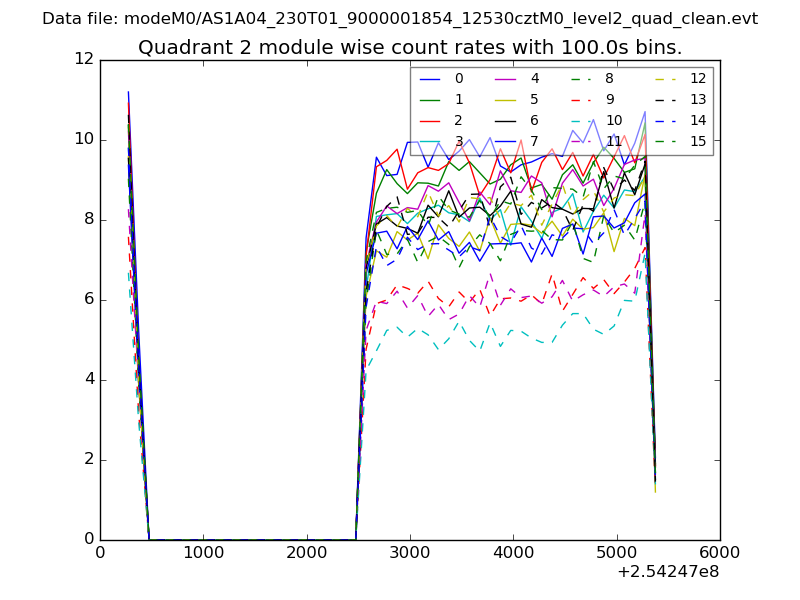
| Module-wise count rates for Quadrant B Data is divided into 100 sec bins |
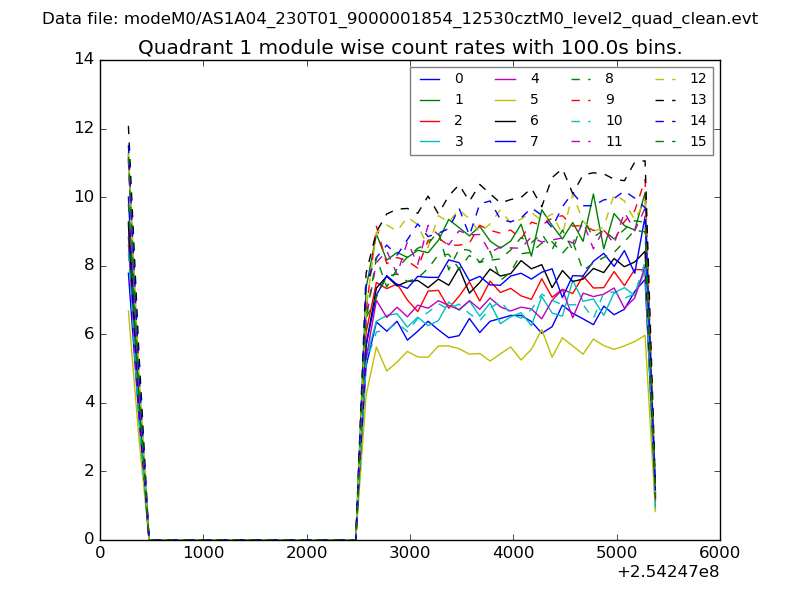 |
 |
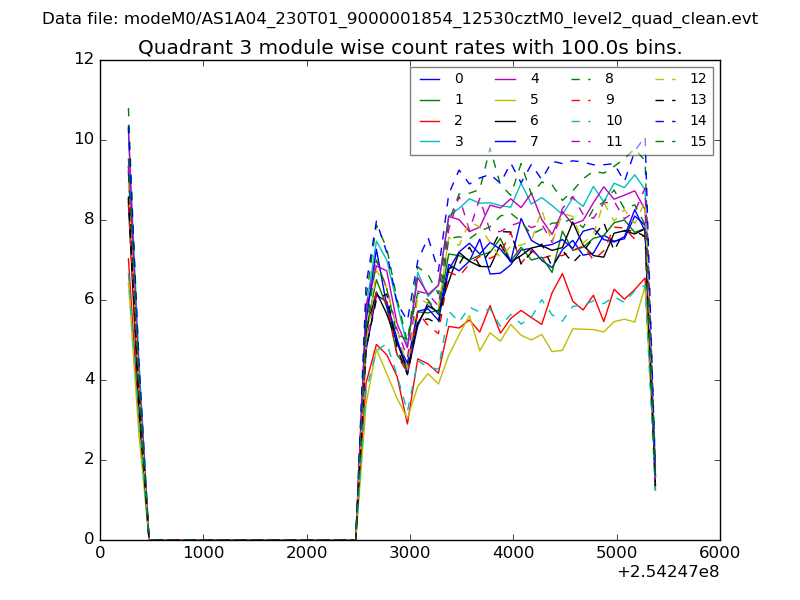
| Module-wise count rates for Quadrant C Data is divided into 100 sec bins |
 |
 |
| Module-wise count rates for Quadrant D Data is divided into 100 sec bins |
 |
 |
| Parameter | Plot |
|---|---|
| CZT HV Monitor | 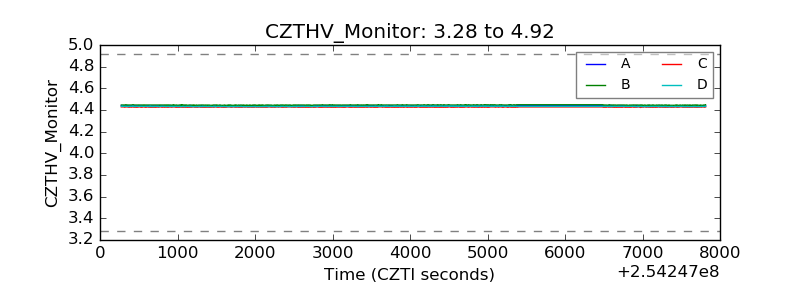 |
| D_VDD | 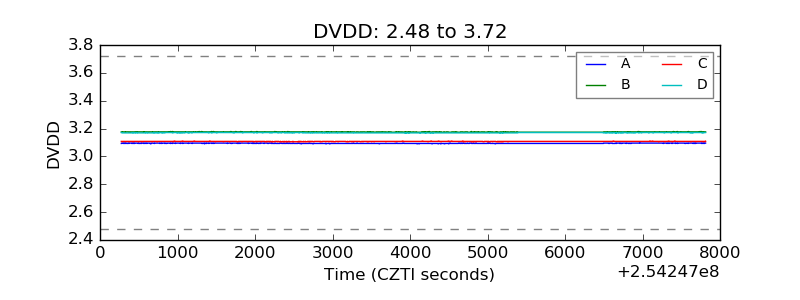 |
| Temperature 1 | 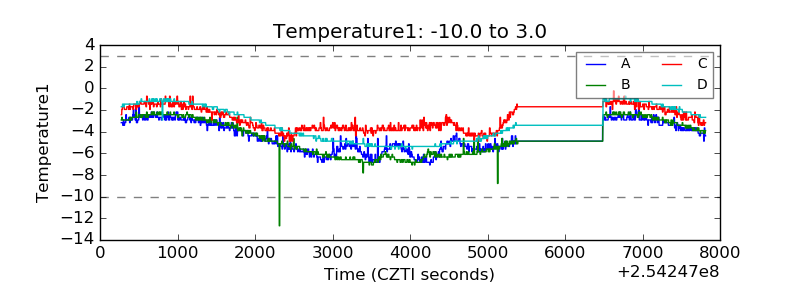 |
| Veto HV Monitor | 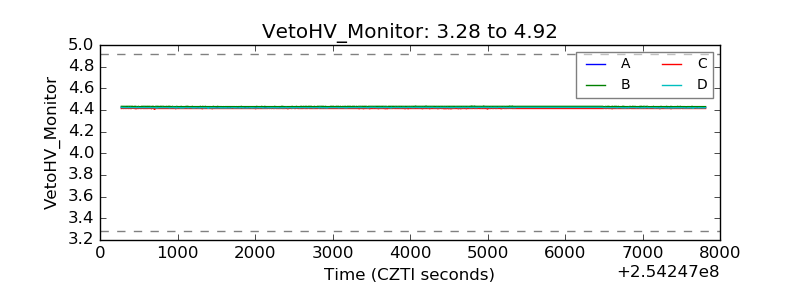 |
| Veto LLD | 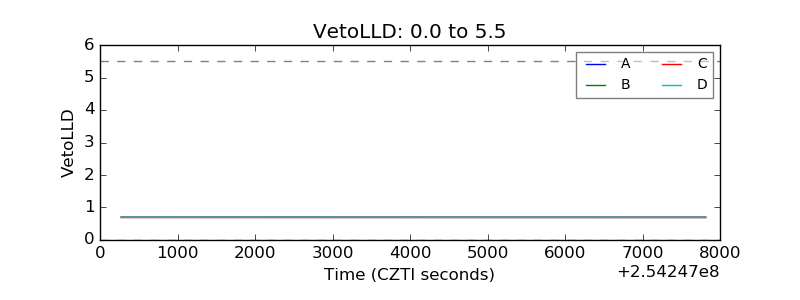 |
| Alpha Counter | 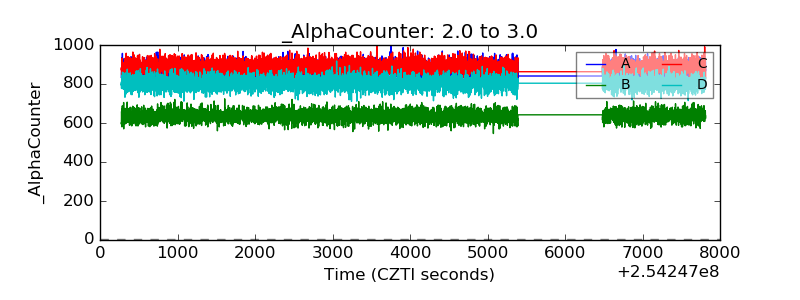 |
| _CPM_Rate | 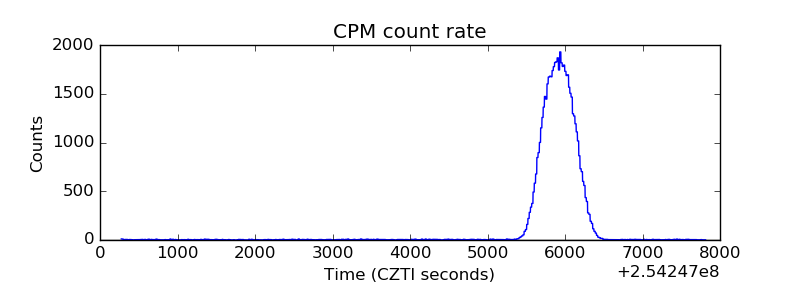 |
| CZT Counter | 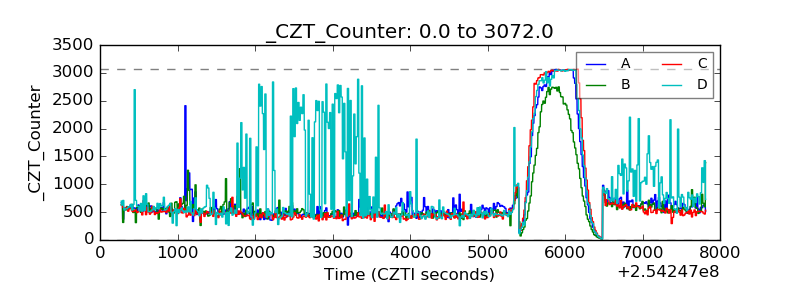 |
| +2.5 Volts monitor |  |
| +5 Volts monitor | 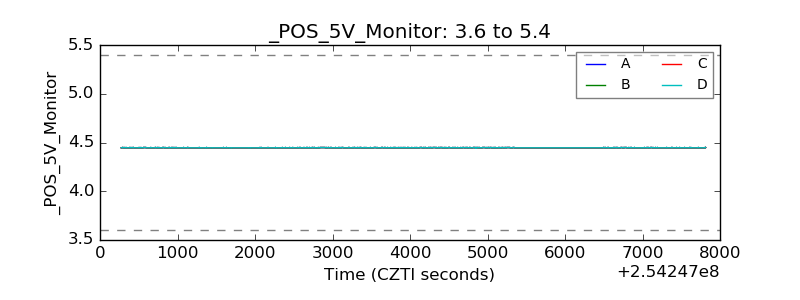 |
| _ROLL_ROT | 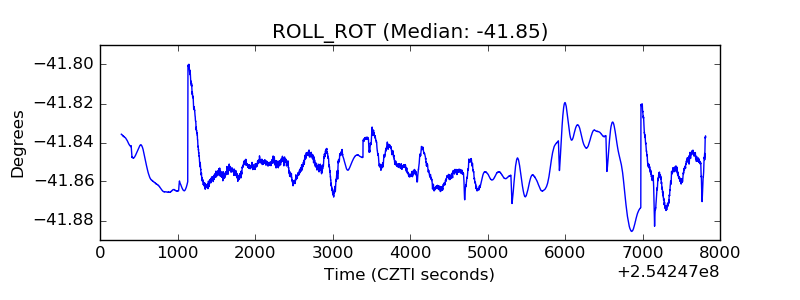 |
| _Roll_DEC | 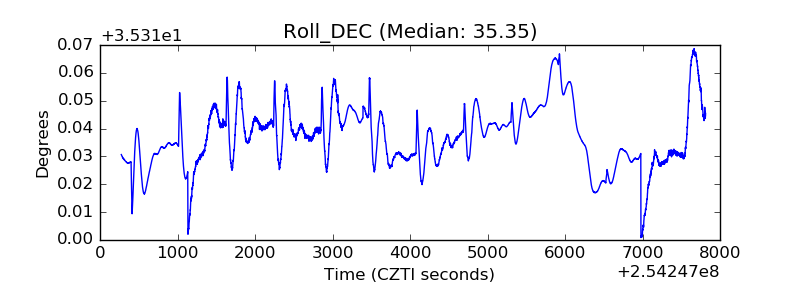 |
| _Roll_RA | 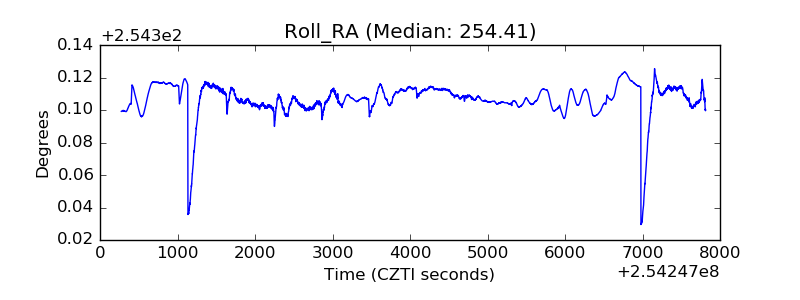 |
| Veto Counter | 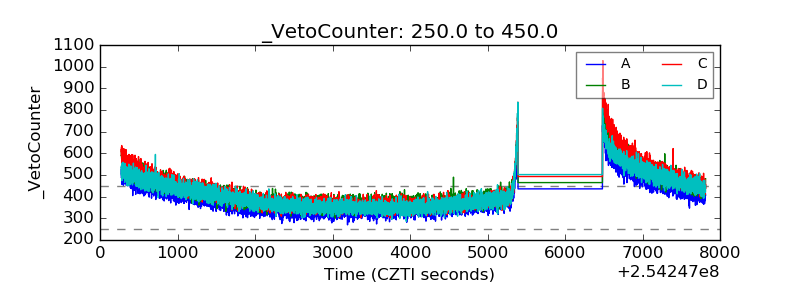 |