| Param | Original file | Final file |
|---|---|---|
| Filename | modeM0/AS1A04_230T01_9000001854_12533cztM0_level2.evt | modeM0/AS1A04_230T01_9000001854_12533cztM0_level2_quad_clean.evt |
| Size (bytes) | 470,747,520 | 75,870,720 |
| Size | 448.9 MB | 72.4 MB |
| Events in quadrant A | 3,393,858 | 468,951 |
| Events in quadrant B | 3,537,274 | 477,185 |
| Events in quadrant C | 3,108,465 | 476,883 |
| Events in quadrant D | 3,802,900 | 448,173 |
| Mode M9 | |||
|---|---|---|---|
| Quadrant | BADHDUFLAG | Total packets | Discarded packets |
| A | 0 | 19 | 0 |
| B | 0 | 19 | 0 |
| C | 0 | 19 | 0 |
| D | 0 | 20 | 0 |
| Mode SS | |||
|---|---|---|---|
| Quadrant | BADHDUFLAG | Total packets | Discarded packets |
| A | 0 | 122 | 0 |
| B | 0 | 122 | 0 |
| C | 0 | 122 | 0 |
| D | 0 | 122 | 0 |
| Mode M0 | |||
|---|---|---|---|
| Quadrant | BADHDUFLAG | Total packets | Discarded packets |
| A | 0 | 14127 | 3 |
| B | 0 | 14501 | 2 |
| C | 0 | 13283 | 2 |
| D | 0 | 15421 | 2 |
| Quadrant | Total seconds | Saturated seconds | Saturation percentage |
|---|---|---|---|
| A | 6110 | 58 | 0.949264% |
| B | 6110 | 113 | 1.849427% |
| C | 6110 | 35 | 0.572831% |
| D | 6110 | 154 | 2.520458% |
Noise dominated data is calculated using 1-second bins in cleaned event files. If a bin has >2000 counts, and if more than 50% of those come from <1% of pixels, then it is considered to be noise-dominated and hence unusable.
| Quadrant | # 1 sec bins | Bins with >0 counts | Bins with >2000 counts | High rate bins dominated by noise | Noise dominated (total time) | Noise dominated (detector-on time) | Marked lightcurve |
|---|---|---|---|---|---|---|---|
| A | 7426 | 6112 | 2 | 2 | 0.03% | 0.03% | 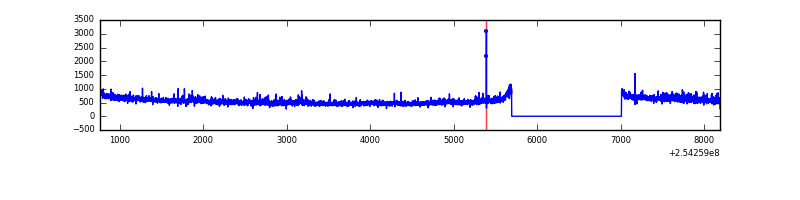 |
| B | 7426 | 6112 | 23 | 23 | 0.31% | 0.38% |  |
| C | 7426 | 6112 | 0 | 0 | 0.00% | 0.00% | 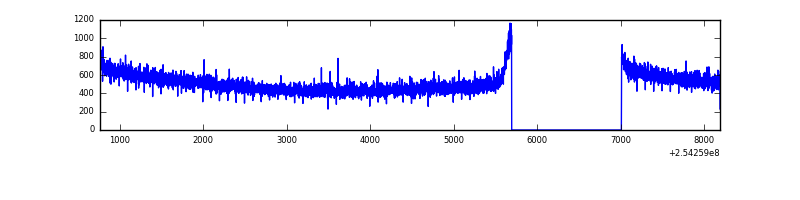 |
| D | 7426 | 6112 | 74 | 74 | 1.00% | 1.21% | 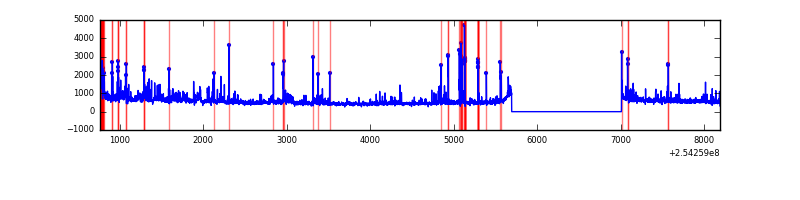 |
Top three noisy pixels from each quadrant. If the there are fewer than three noisy pixels in the level2.evt file, extra rows are filled as -1
| Pixel properties | Quadrant properties | ||||||
|---|---|---|---|---|---|---|---|
| Quadrant | DetID | PixID | Counts | Sigma | Mean | Median | Sigma |
| A | 1 | 162 | 103062 | 634.24 | 804 | 791 | 161.2 |
| A | 1 | 178 | 53981 | 329.86 | 804 | 791 | 161.2 |
| A | 1 | 161 | 45856 | 279.47 | 804 | 791 | 161.2 |
| B | 4 | 239 | 233974 | 1528.53 | 809 | 790 | 152.6 |
| B | 0 | 230 | 104020 | 676.67 | 809 | 790 | 152.6 |
| B | 12 | 111 | 16784 | 104.84 | 809 | 790 | 152.6 |
| C | 13 | 61 | 5669 | 26.59 | 796 | 803 | 183.0 |
| C | 9 | 221 | 3160 | 12.88 | 796 | 803 | 183.0 |
| C | 14 | 67 | 2732 | 10.54 | 796 | 803 | 183.0 |
| D | 1 | 52 | 526257 | 2828.69 | 779 | 757 | 185.8 |
| D | 8 | 195 | 172650 | 925.27 | 779 | 757 | 185.8 |
| D | 13 | 112 | 80715 | 430.4 | 779 | 757 | 185.8 |
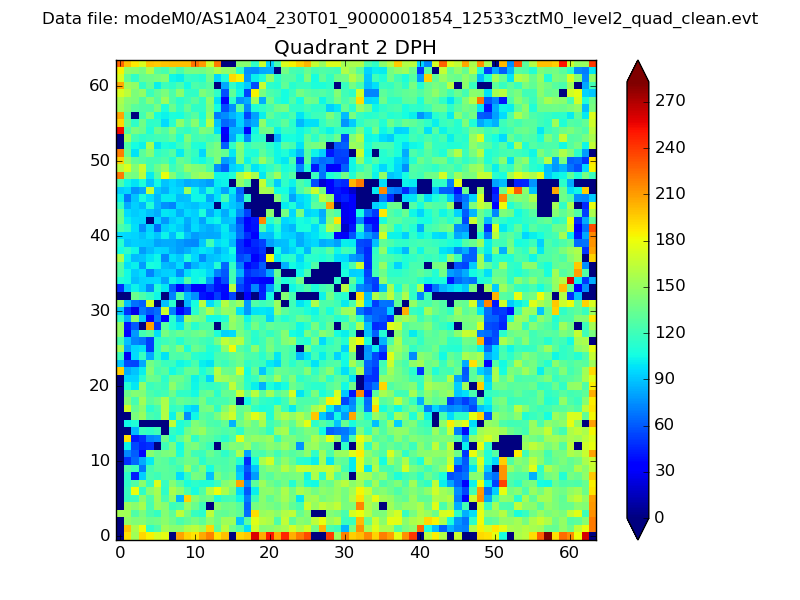
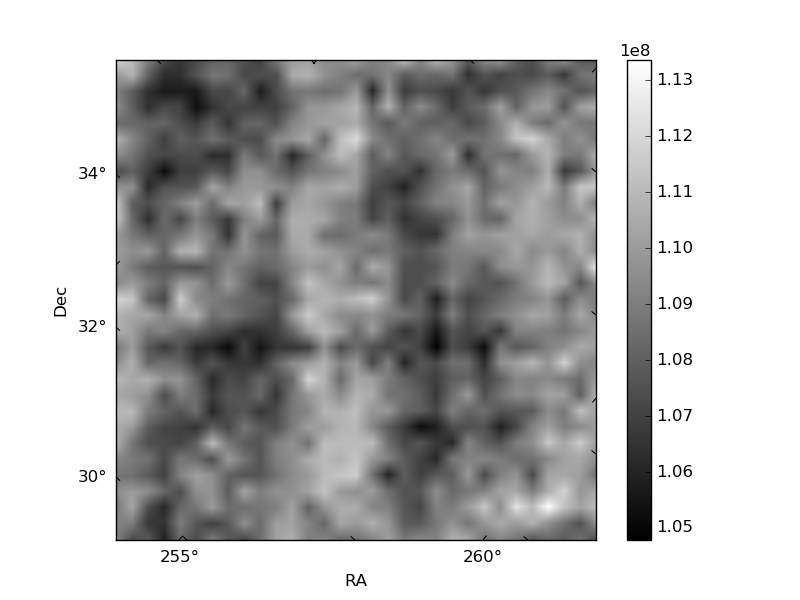
Histogram calculated using DETX and DETY for each event in the final _common_clean file
| Quadrant A | 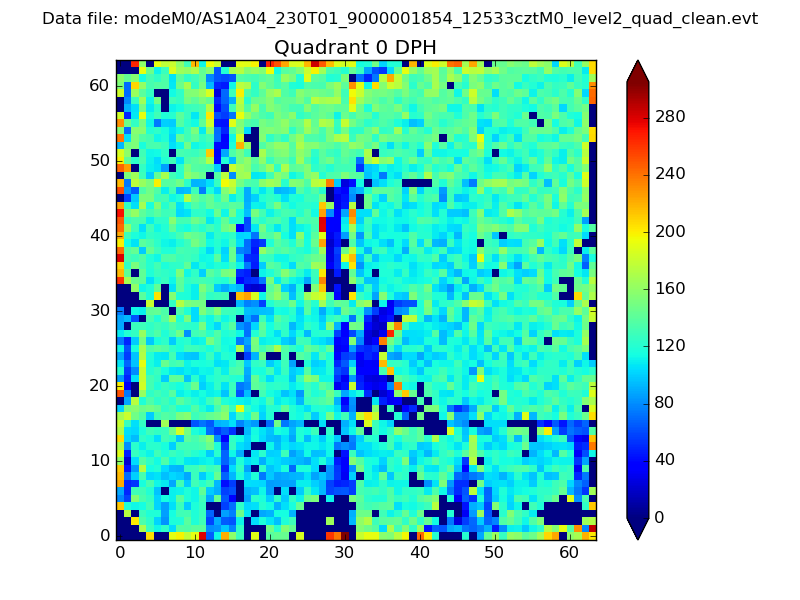 |
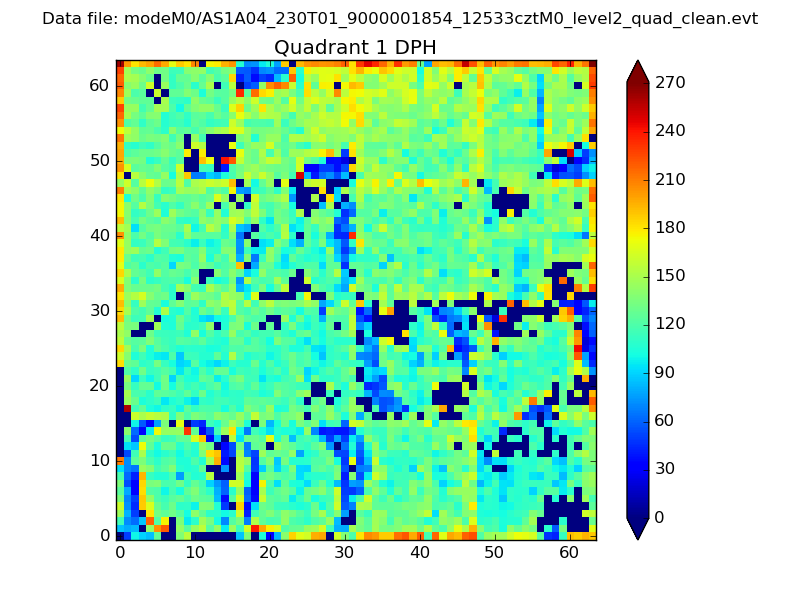 |
Quadrant B |
|---|---|---|---|
| Quadrant D | 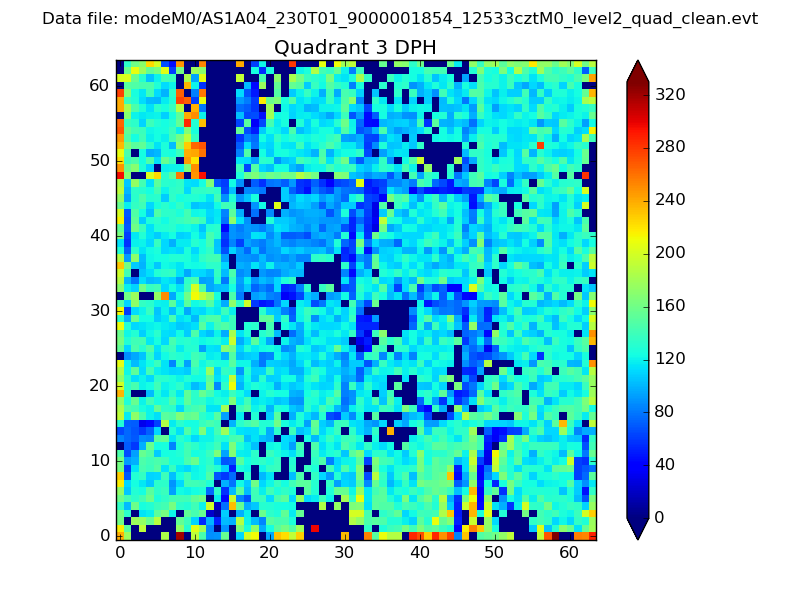 |
 |
Quadrant C |
| Plot type | Count rate plots | Images |
|---|---|---|
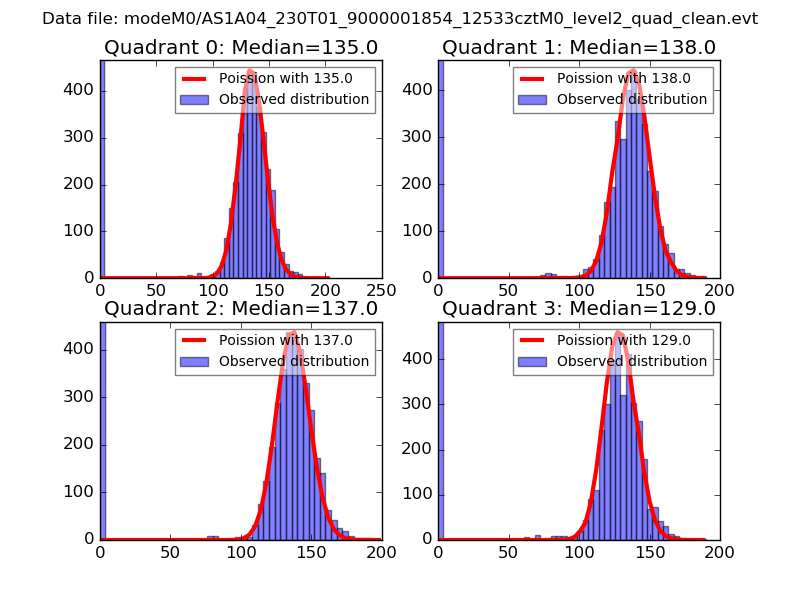
| Comparison with Poisson distribution Blue bars denote a histogram of data divided into 1 sec bins. Red curve is a Poisson curve with rate = median count rate of data. |
 |
 |
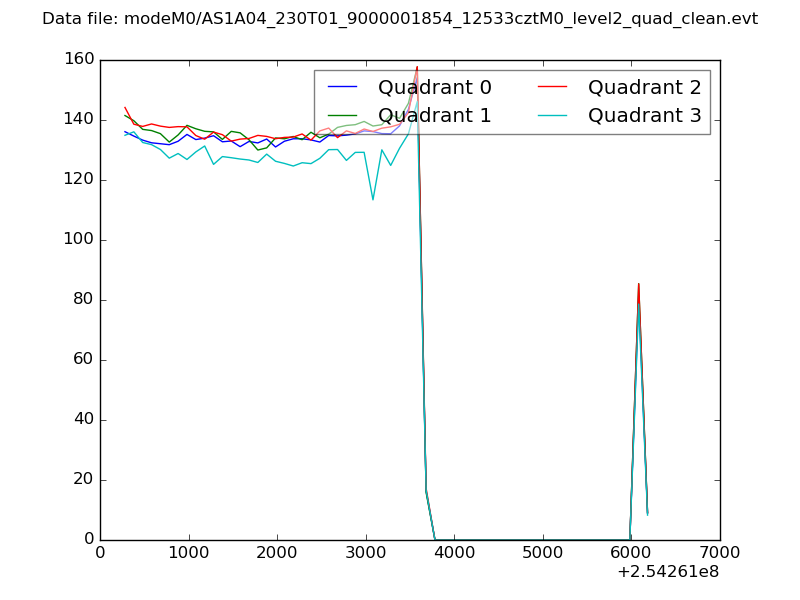
| Quadrant-wise count rates Data is divided into 100 sec bins |
 |
|
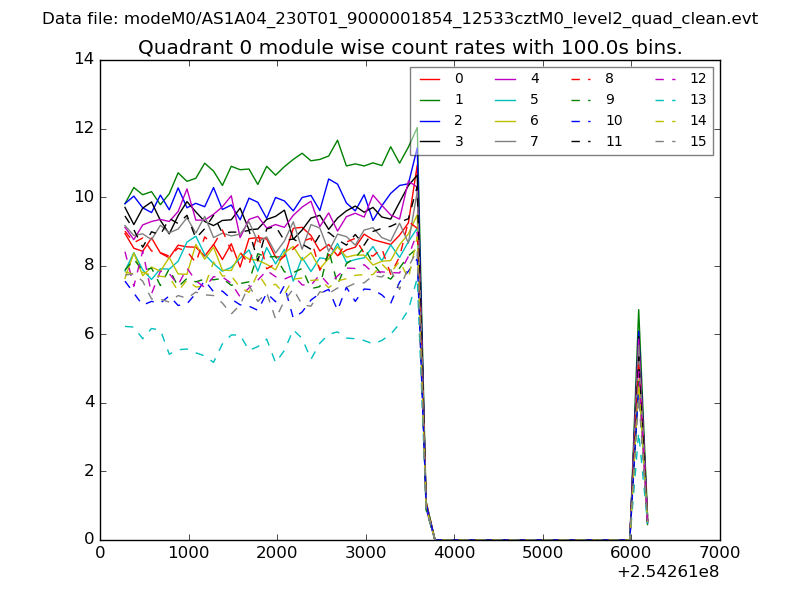
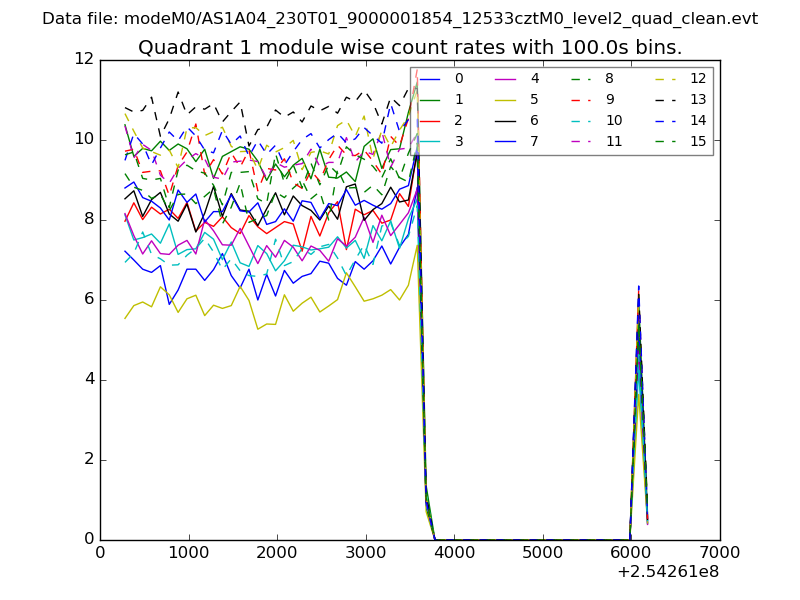
| Module-wise count rates for Quadrant A Data is divided into 100 sec bins |
 |
 |
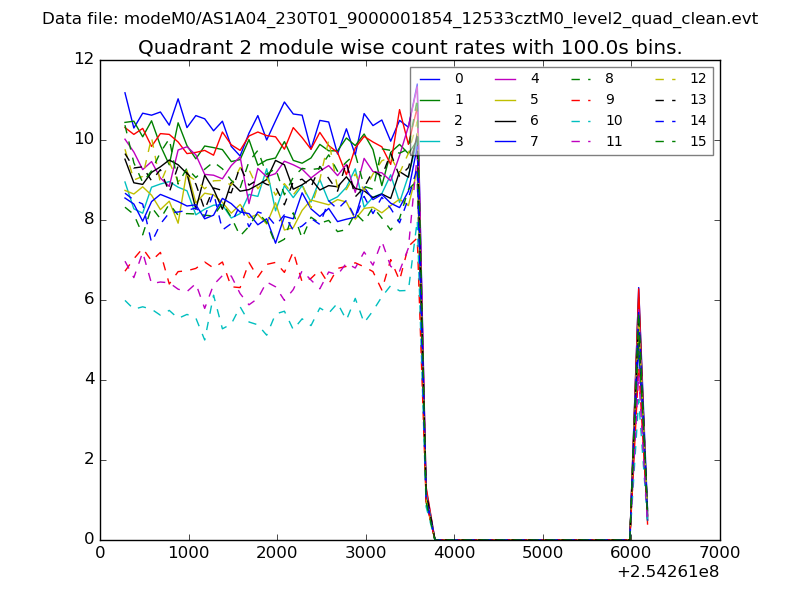
| Module-wise count rates for Quadrant B Data is divided into 100 sec bins |
 |
 |
| Module-wise count rates for Quadrant C Data is divided into 100 sec bins |
 |
 |
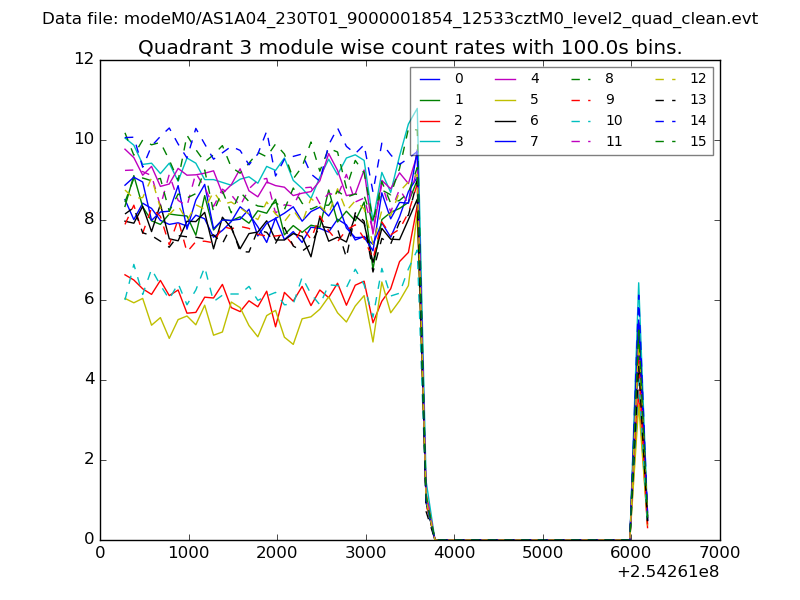
| Module-wise count rates for Quadrant D Data is divided into 100 sec bins |
 |
 |
| Parameter | Plot |
|---|---|
| CZT HV Monitor | 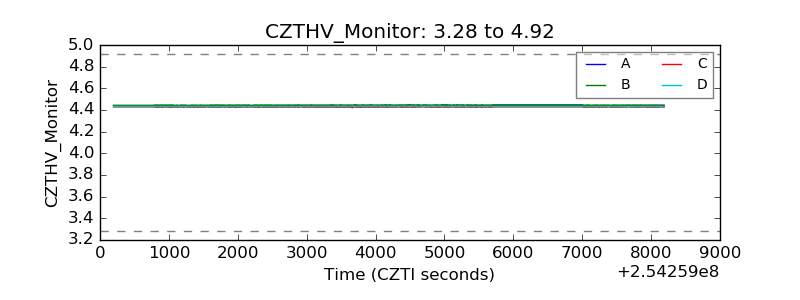 |
| D_VDD |  |
| Temperature 1 | 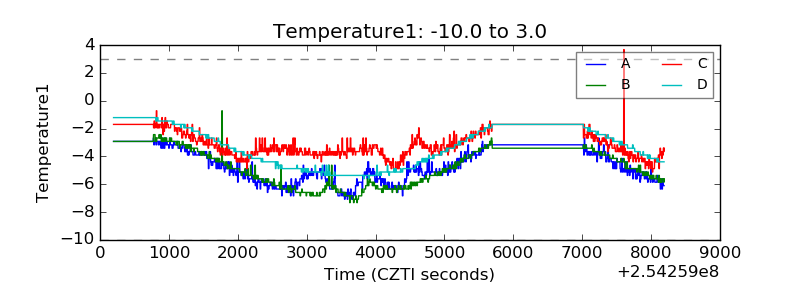 |
| Veto HV Monitor | 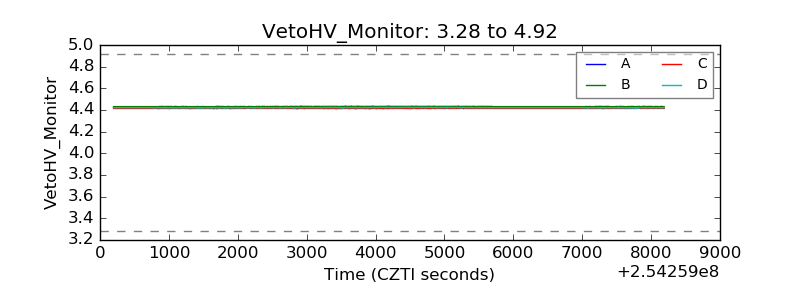 |
| Veto LLD | 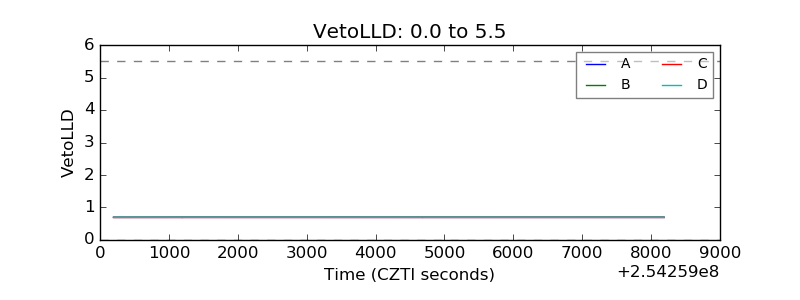 |
| Alpha Counter | 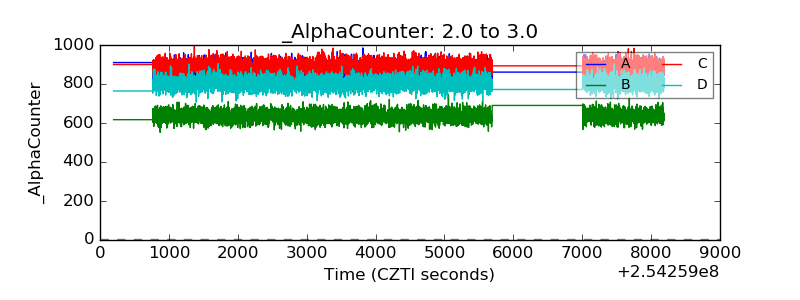 |
| _CPM_Rate | 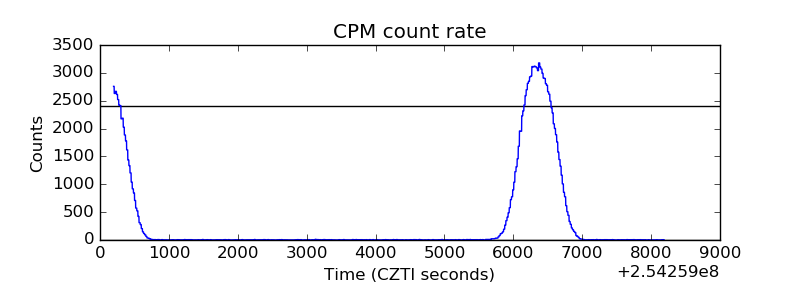 |
| CZT Counter | 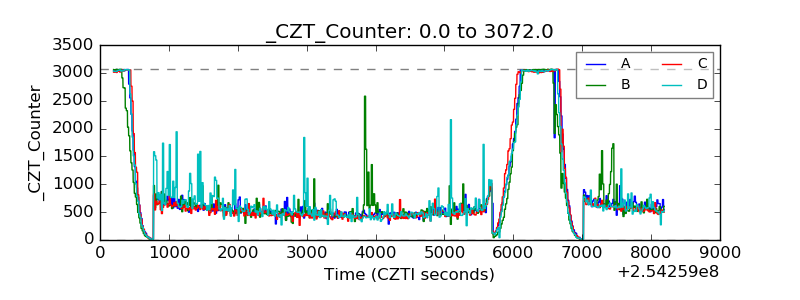 |
| +2.5 Volts monitor | 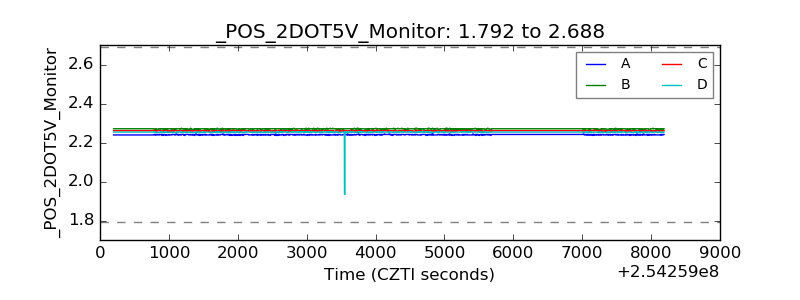 |
| +5 Volts monitor |  |
| _ROLL_ROT | 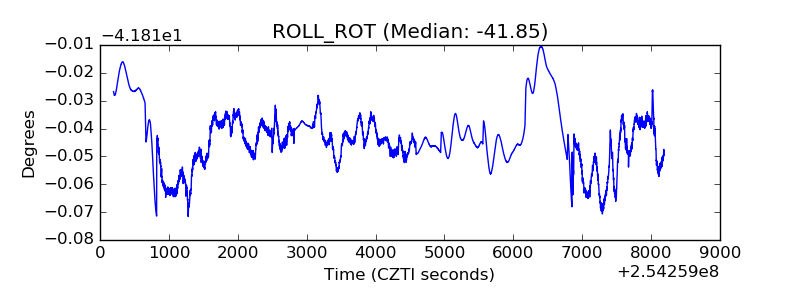 |
| _Roll_DEC | 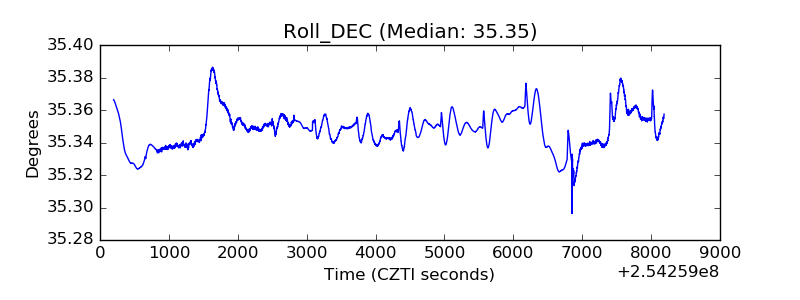 |
| _Roll_RA | 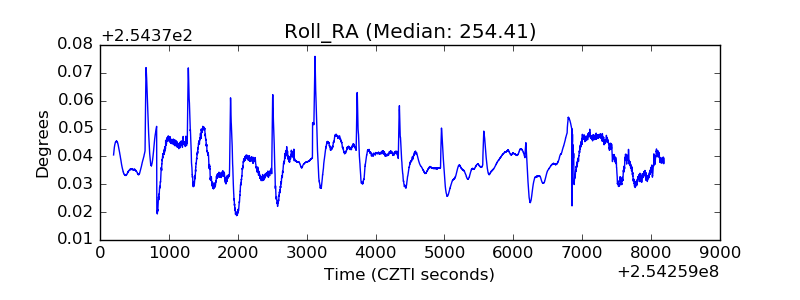 |
| Veto Counter | 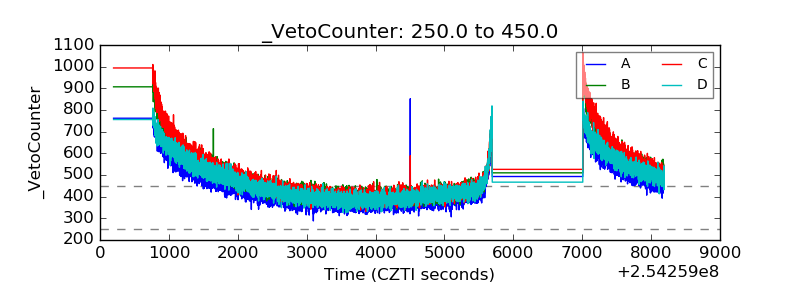 |