| Param | Original file | Final file |
|---|---|---|
| Filename | modeM0/AS1A04_130T01_9000001856_12535cztM0_level2.evt | modeM0/AS1A04_130T01_9000001856_12535cztM0_level2_quad_clean.evt |
| Size (bytes) | 105,451,200 | 10,304,640 |
| Size | 100.6 MB | 9.8 MB |
| Events in quadrant A | 818,207 | 50,378 |
| Events in quadrant B | 785,114 | 51,232 |
| Events in quadrant C | 730,278 | 49,236 |
| Events in quadrant D | 753,281 | 47,318 |
| Mode M0 | |||
|---|---|---|---|
| Quadrant | BADHDUFLAG | Total packets | Discarded packets |
| A | 0 | 3332 | 2 |
| B | 0 | 3206 | 1 |
| C | 0 | 3077 | 1 |
| D | 0 | 3220 | 1 |
| Mode SS | |||
|---|---|---|---|
| Quadrant | BADHDUFLAG | Total packets | Discarded packets |
| A | 0 | 30 | 0 |
| B | 0 | 30 | 0 |
| C | 0 | 30 | 0 |
| D | 0 | 30 | 0 |
| Quadrant | Total seconds | Saturated seconds | Saturation percentage |
|---|---|---|---|
| A | 1528 | 1 | 0.065445% |
| B | 1528 | 2 | 0.130890% |
| C | 1528 | 1 | 0.065445% |
| D | 1528 | 3 | 0.196335% |
Noise dominated data is calculated using 1-second bins in cleaned event files. If a bin has >2000 counts, and if more than 50% of those come from <1% of pixels, then it is considered to be noise-dominated and hence unusable.
| Quadrant | # 1 sec bins | Bins with >0 counts | Bins with >2000 counts | High rate bins dominated by noise | Noise dominated (total time) | Noise dominated (detector-on time) | Marked lightcurve |
|---|---|---|---|---|---|---|---|
| A | 1529 | 1529 | 0 | 0 | 0.00% | 0.00% | 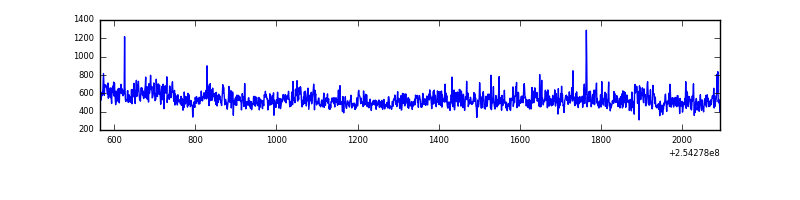 |
| B | 1529 | 1529 | 1 | 1 | 0.07% | 0.07% | 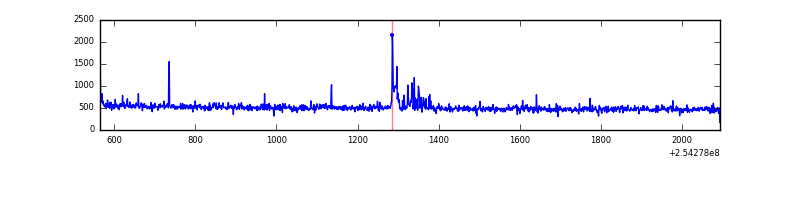 |
| C | 1529 | 1529 | 0 | 0 | 0.00% | 0.00% | 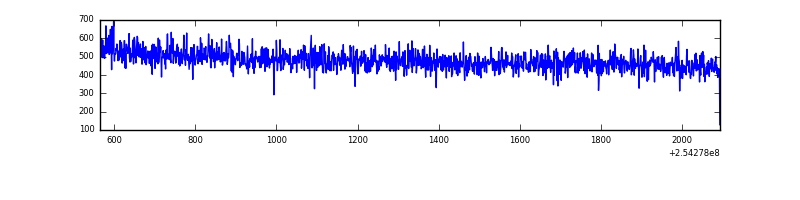 |
| D | 1529 | 1529 | 2 | 2 | 0.13% | 0.13% | 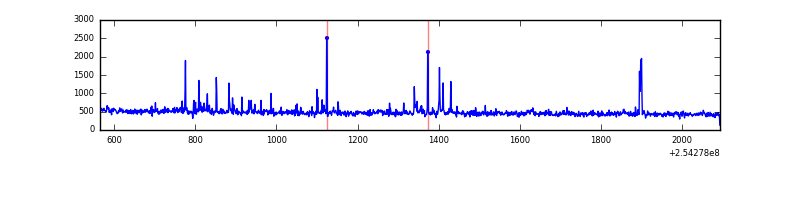 |
Top three noisy pixels from each quadrant. If the there are fewer than three noisy pixels in the level2.evt file, extra rows are filled as -1
| Pixel properties | Quadrant properties | ||||||
|---|---|---|---|---|---|---|---|
| Quadrant | DetID | PixID | Counts | Sigma | Mean | Median | Sigma |
| A | 1 | 162 | 37152 | 933.08 | 186 | 183 | 39.6 |
| A | 1 | 178 | 22052 | 551.97 | 186 | 183 | 39.6 |
| A | 1 | 161 | 18671 | 466.63 | 186 | 183 | 39.6 |
| B | 4 | 239 | 24611 | 649.11 | 190 | 185 | 37.6 |
| B | 0 | 205 | 7810 | 202.63 | 190 | 185 | 37.6 |
| B | 10 | 244 | 4614 | 117.7 | 190 | 185 | 37.6 |
| C | 13 | 61 | 1372 | 26.21 | 187 | 188 | 45.2 |
| C | 3 | 202 | 467 | 6.18 | 187 | 188 | 45.2 |
| C | 8 | 222 | 444 | 5.67 | 187 | 188 | 45.2 |
| D | 1 | 52 | 22540 | 494.23 | 182 | 176 | 45.2 |
| D | 10 | 199 | 12844 | 279.96 | 182 | 176 | 45.2 |
| D | 8 | 195 | 12294 | 267.8 | 182 | 176 | 45.2 |
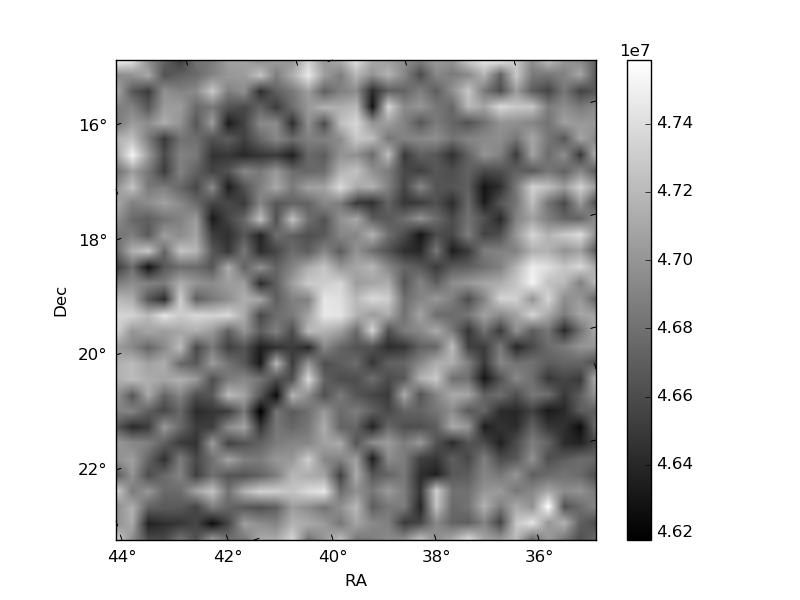
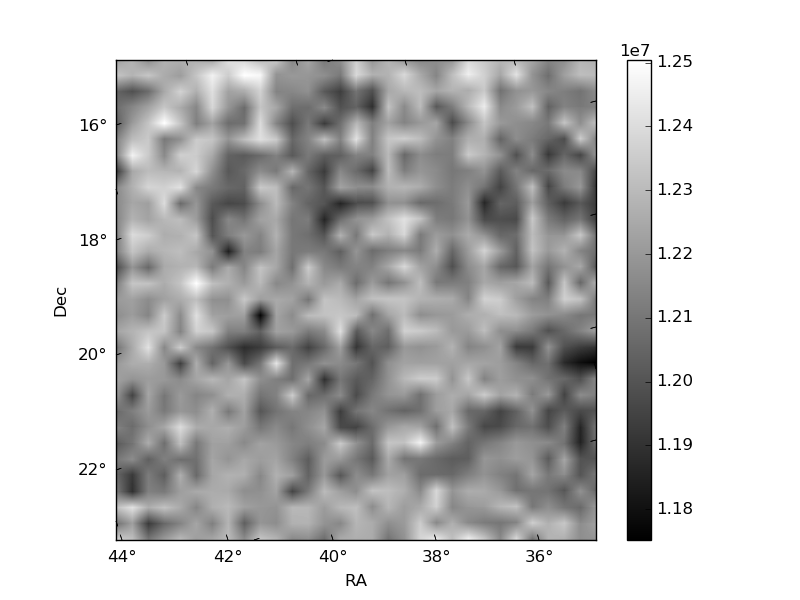
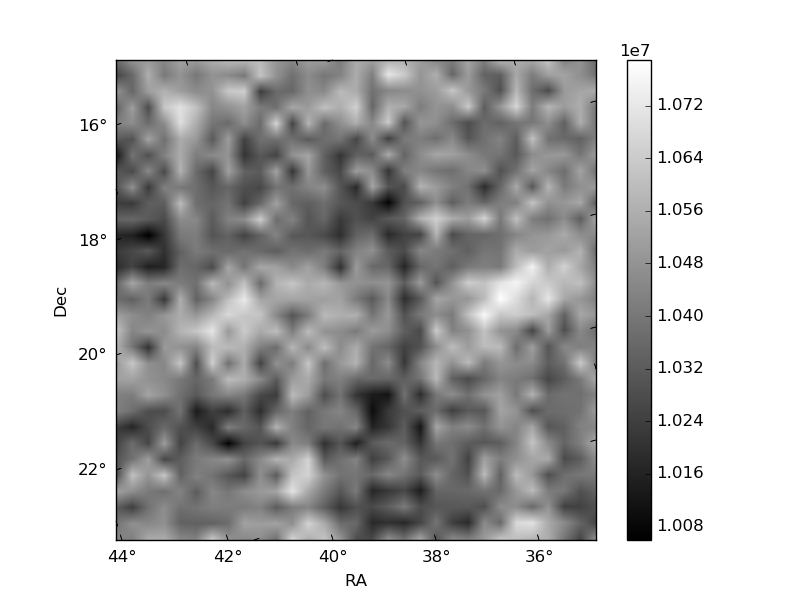
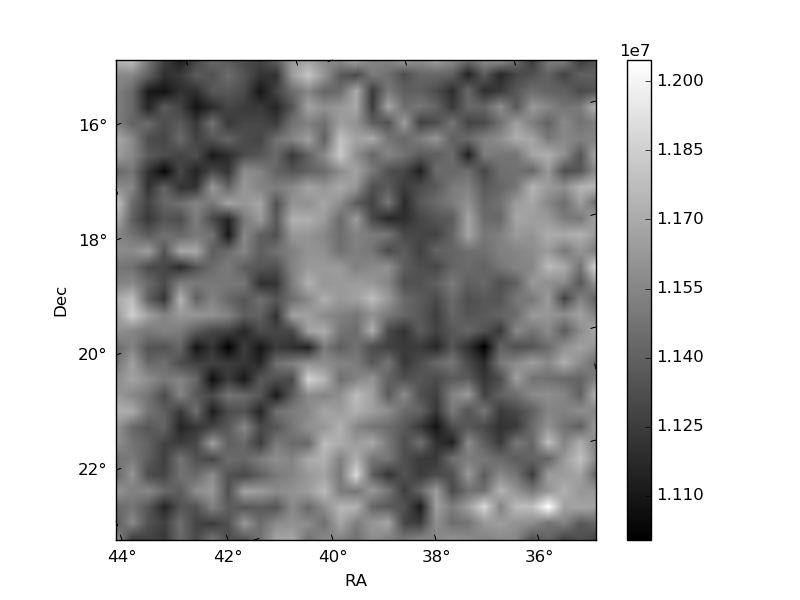
Histogram calculated using DETX and DETY for each event in the final _common_clean file
| Quadrant A | 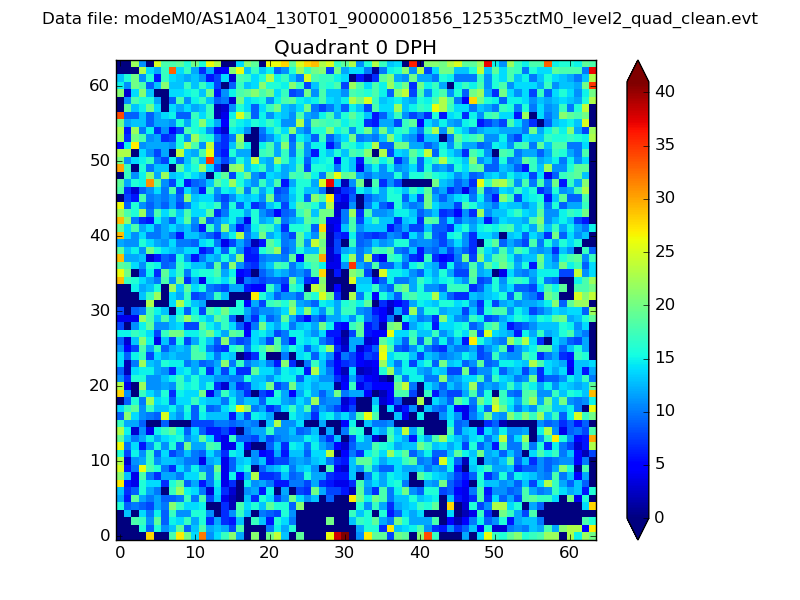 |
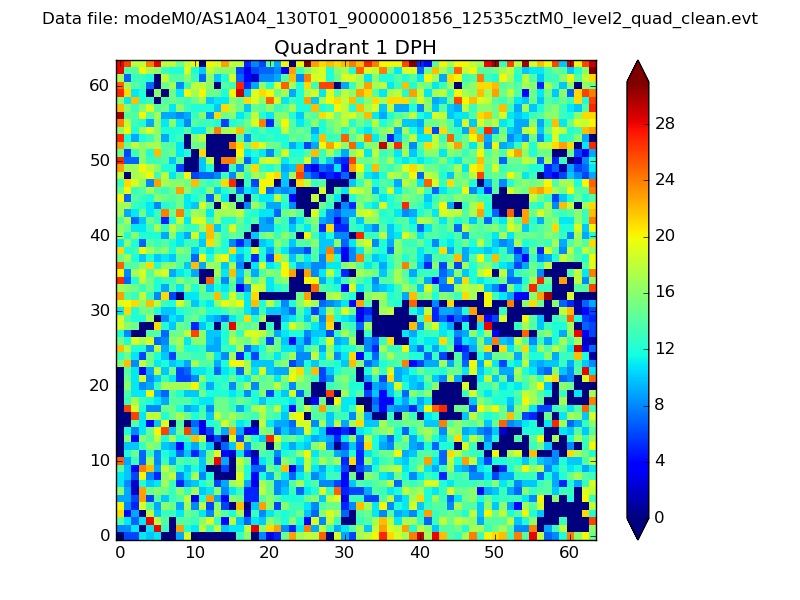 |
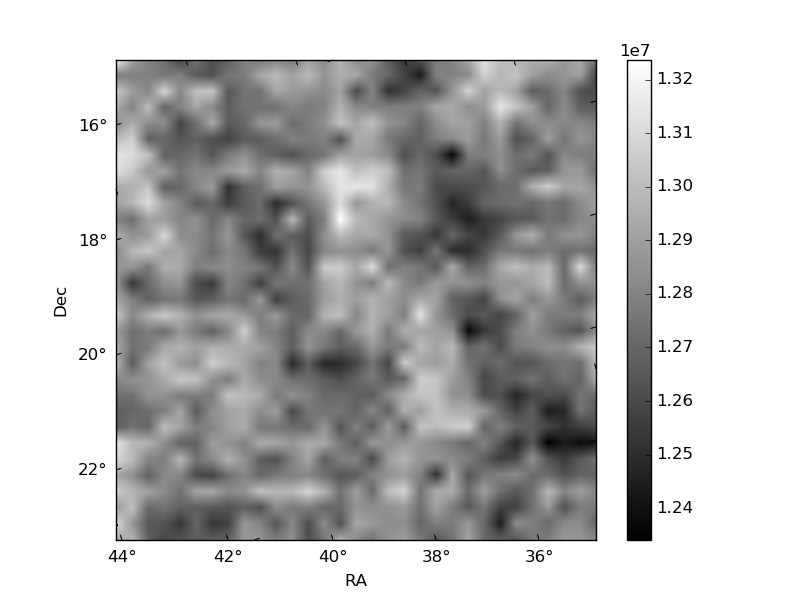
Quadrant B |
|---|---|---|---|
| Quadrant D | 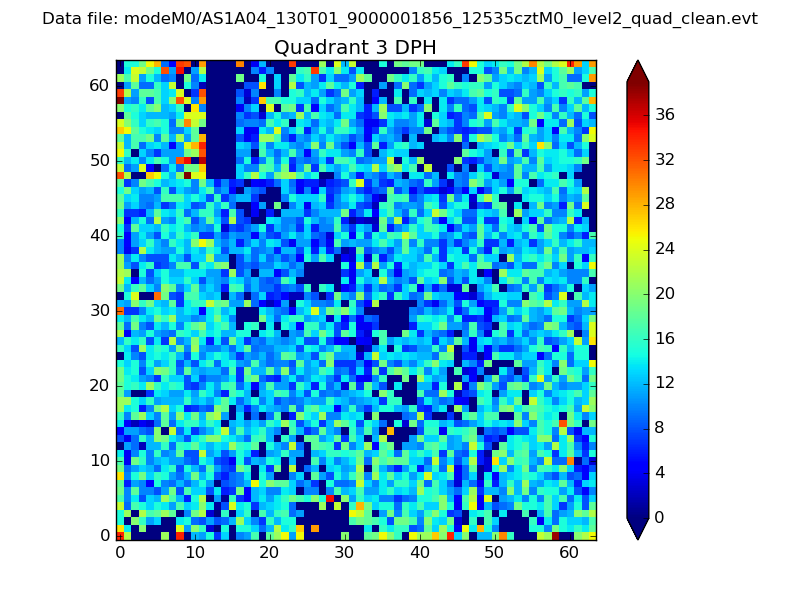 |
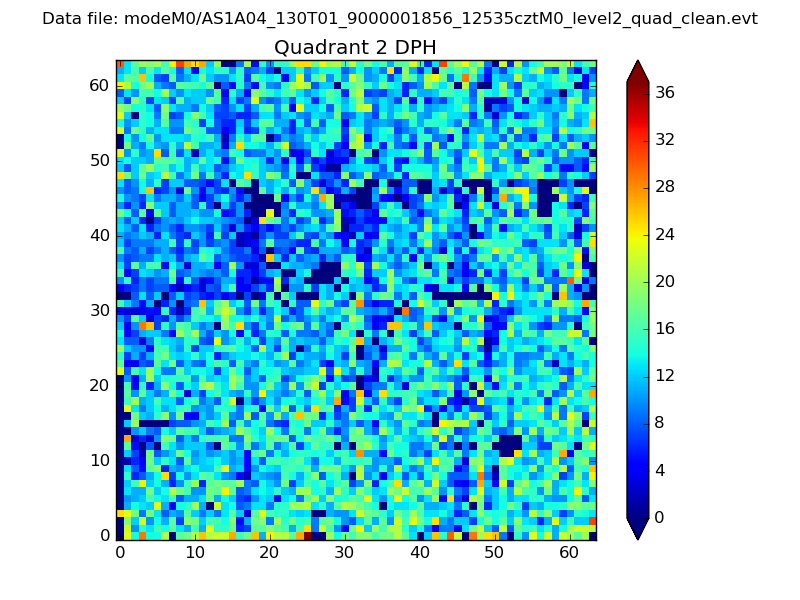 |
Quadrant C |
| Plot type | Count rate plots | Images |
|---|---|---|
| Comparison with Poisson distribution Blue bars denote a histogram of data divided into 1 sec bins. Red curve is a Poisson curve with rate = median count rate of data. |
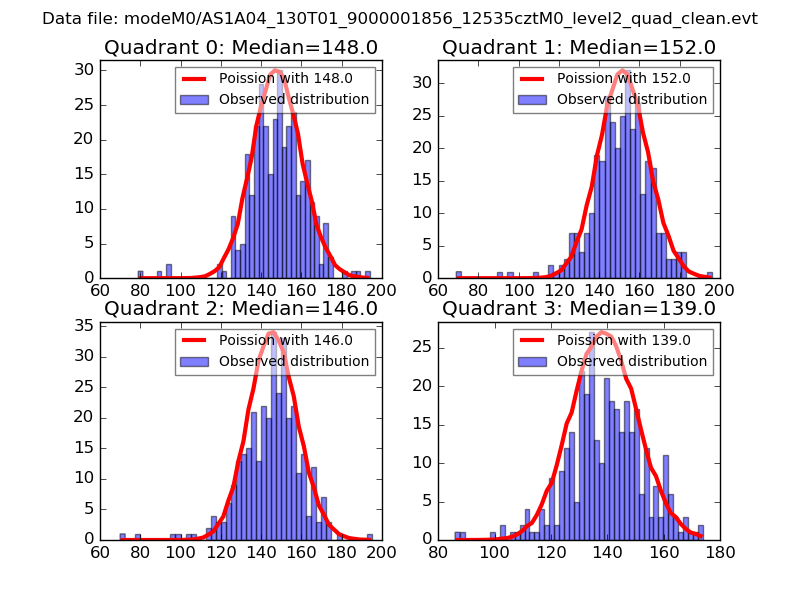 |
 |
| Quadrant-wise count rates Data is divided into 100 sec bins |
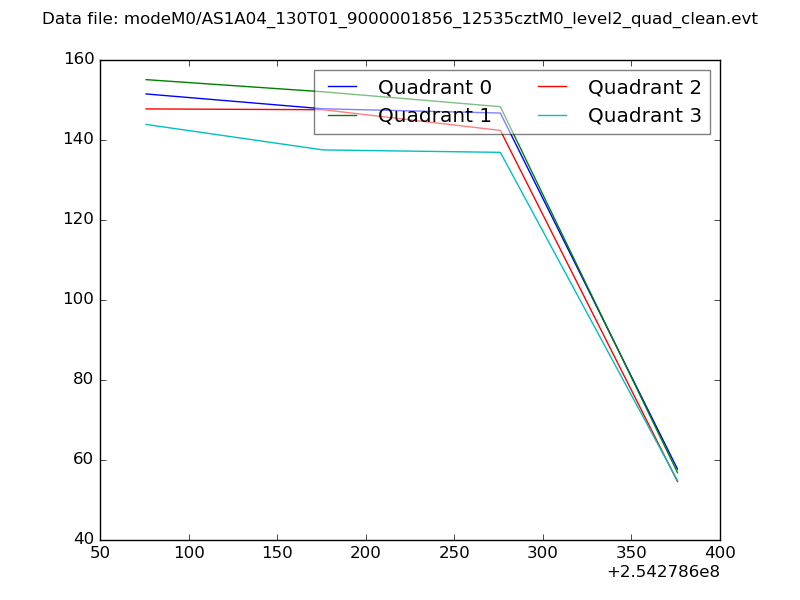 |
|
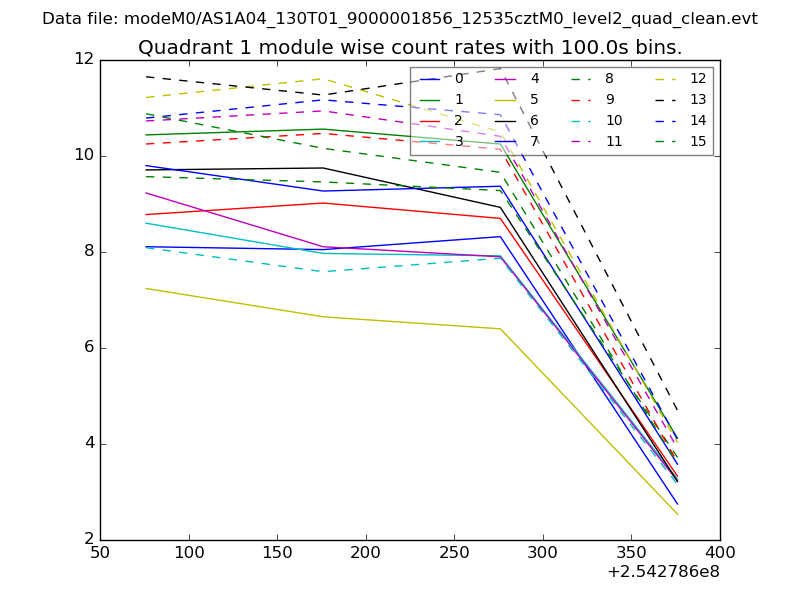
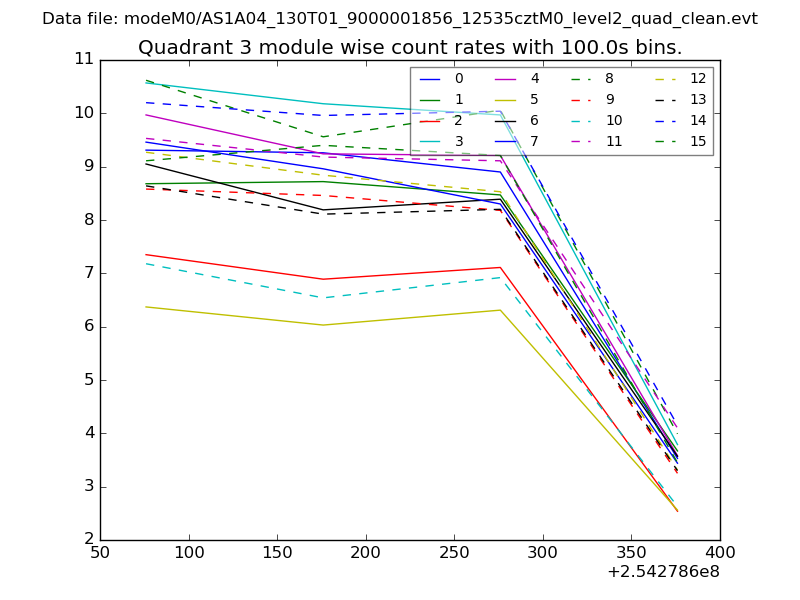
| Module-wise count rates for Quadrant A Data is divided into 100 sec bins |
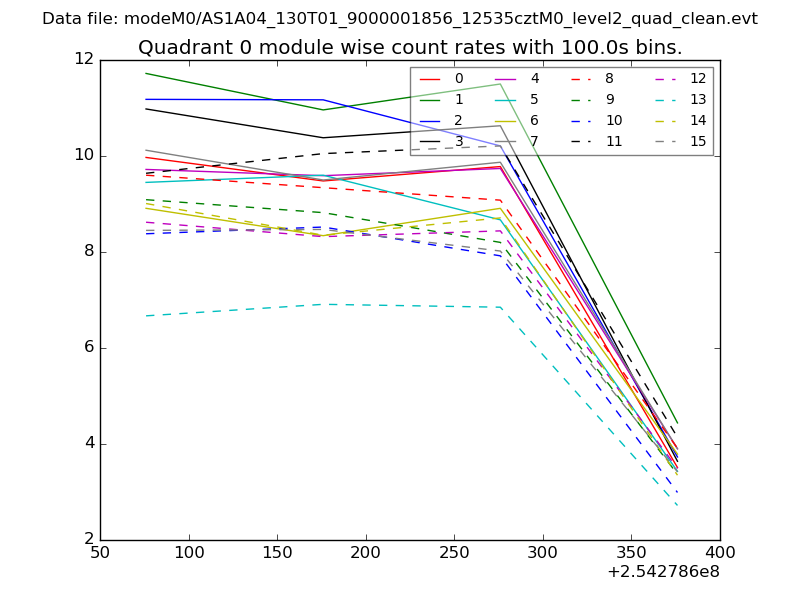 |
 |
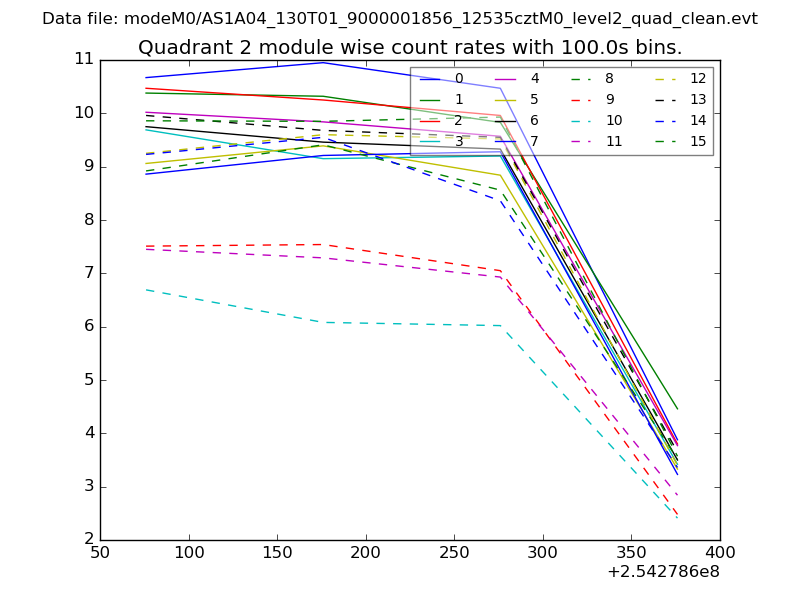
| Module-wise count rates for Quadrant B Data is divided into 100 sec bins |
 |
 |
| Module-wise count rates for Quadrant C Data is divided into 100 sec bins |
 |
 |
| Module-wise count rates for Quadrant D Data is divided into 100 sec bins |
 |
 |
| Parameter | Plot |
|---|---|
| CZT HV Monitor | 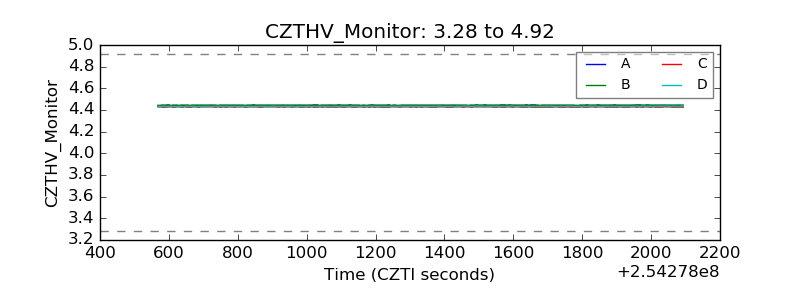 |
| D_VDD | 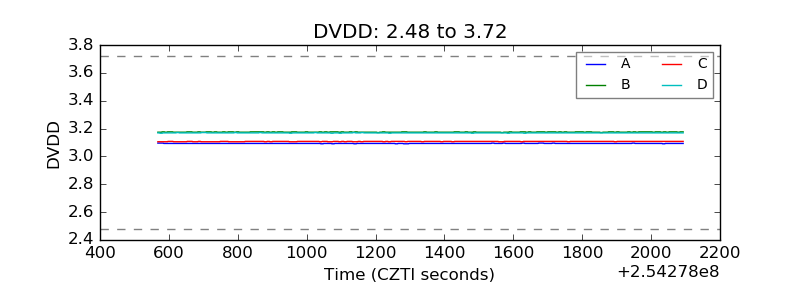 |
| Temperature 1 | 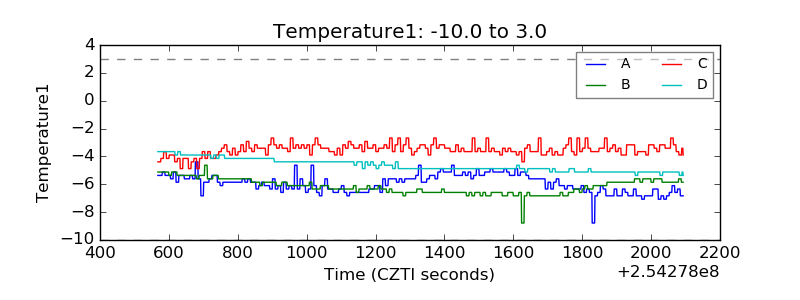 |
| Veto HV Monitor | 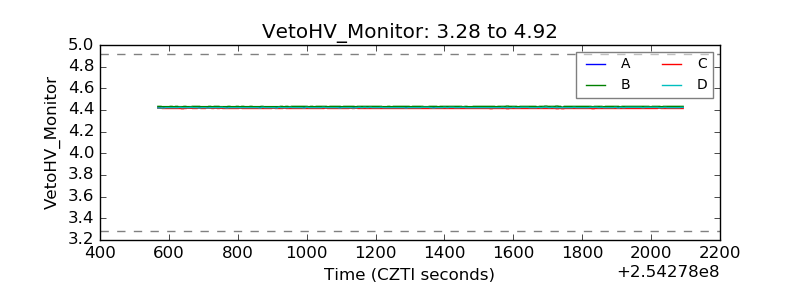 |
| Veto LLD |  |
| Alpha Counter | 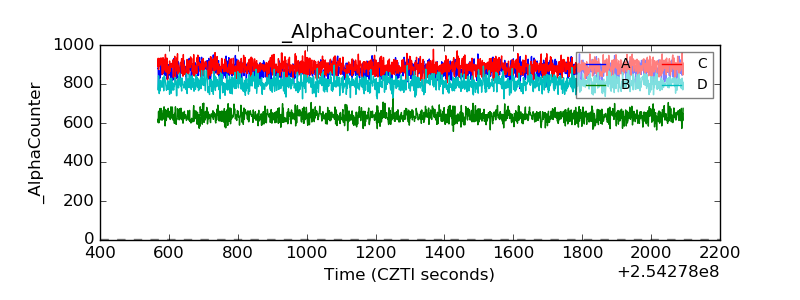 |
| _CPM_Rate | 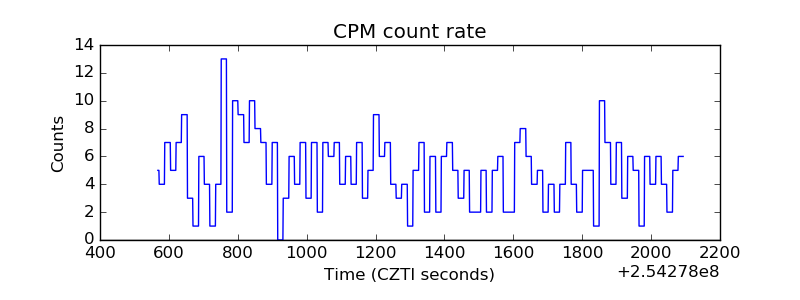 |
| CZT Counter | 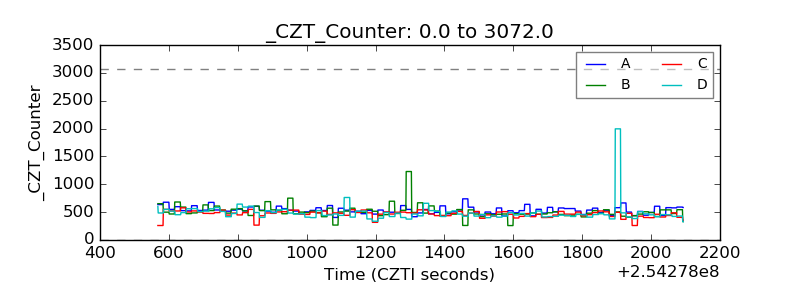 |
| +2.5 Volts monitor |  |
| +5 Volts monitor | 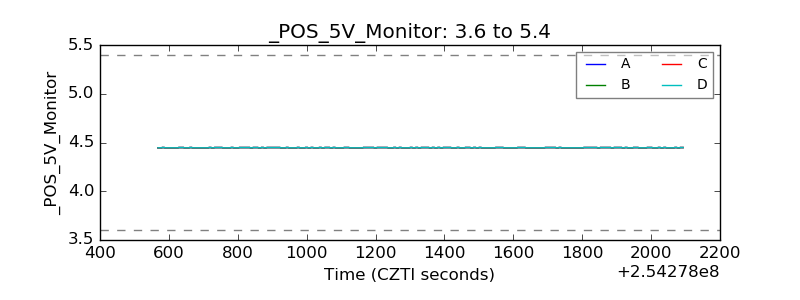 |
| _ROLL_ROT | 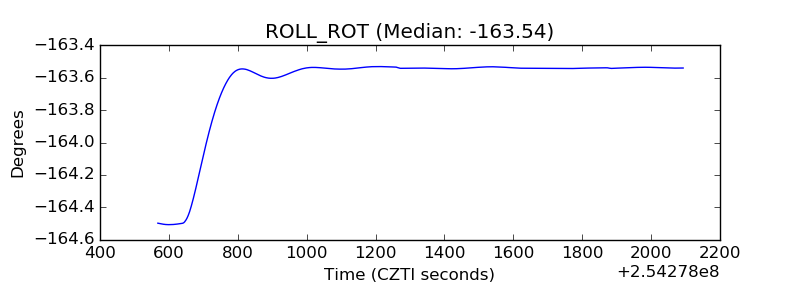 |
| _Roll_DEC | 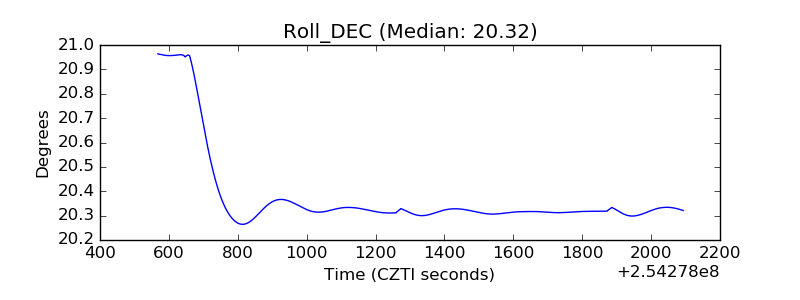 |
| _Roll_RA | 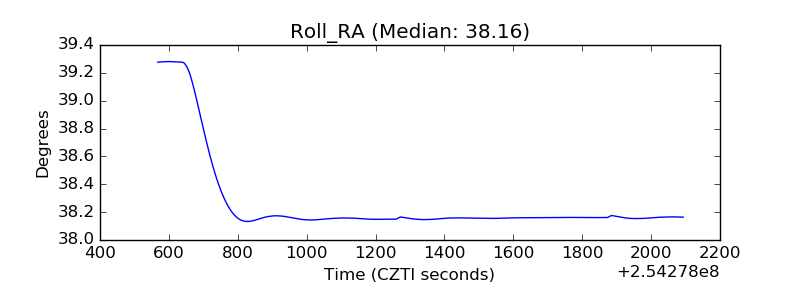 |
| Veto Counter | 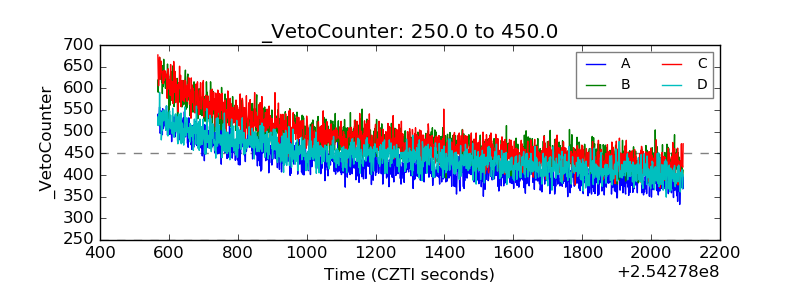 |