| Param | Original file | Final file |
|---|---|---|
| Filename | modeM0/AS1A04_130T01_9000001856_12536cztM0_level2.evt | modeM0/AS1A04_130T01_9000001856_12536cztM0_level2_quad_clean.evt |
| Size (bytes) | 432,711,360 | 63,429,120 |
| Size | 412.7 MB | 60.5 MB |
| Events in quadrant A | 3,374,247 | 371,646 |
| Events in quadrant B | 3,280,806 | 375,594 |
| Events in quadrant C | 2,983,271 | 374,170 |
| Events in quadrant D | 3,036,801 | 357,984 |
| Mode M9 | |||
|---|---|---|---|
| Quadrant | BADHDUFLAG | Total packets | Discarded packets |
| A | 0 | 13 | 0 |
| B | 0 | 13 | 0 |
| C | 0 | 13 | 0 |
| D | 0 | 13 | 0 |
| Mode M0 | |||
|---|---|---|---|
| Quadrant | BADHDUFLAG | Total packets | Discarded packets |
| A | 0 | 13868 | 2 |
| B | 0 | 13583 | 1 |
| C | 0 | 12958 | 1 |
| D | 0 | 13355 | 1 |
| Mode SS | |||
|---|---|---|---|
| Quadrant | BADHDUFLAG | Total packets | Discarded packets |
| A | 0 | 128 | 0 |
| B | 0 | 128 | 0 |
| C | 0 | 128 | 0 |
| D | 0 | 128 | 0 |
| Quadrant | Total seconds | Saturated seconds | Saturation percentage |
|---|---|---|---|
| A | 6328 | 53 | 0.837547% |
| B | 6328 | 69 | 1.090392% |
| C | 6328 | 22 | 0.347661% |
| D | 6328 | 33 | 0.521492% |
Noise dominated data is calculated using 1-second bins in cleaned event files. If a bin has >2000 counts, and if more than 50% of those come from <1% of pixels, then it is considered to be noise-dominated and hence unusable.
| Quadrant | # 1 sec bins | Bins with >0 counts | Bins with >2000 counts | High rate bins dominated by noise | Noise dominated (total time) | Noise dominated (detector-on time) | Marked lightcurve |
|---|---|---|---|---|---|---|---|
| A | 7554 | 6331 | 0 | 0 | 0.00% | 0.00% | 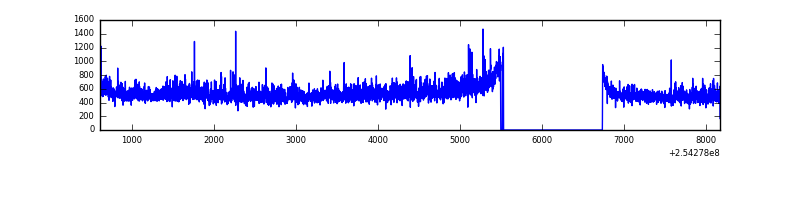 |
| B | 7554 | 6331 | 15 | 15 | 0.20% | 0.24% | 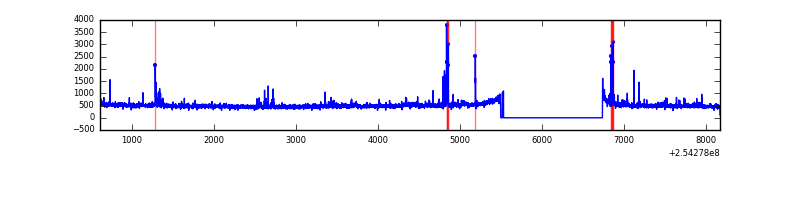 |
| C | 7554 | 6331 | 0 | 0 | 0.00% | 0.00% | 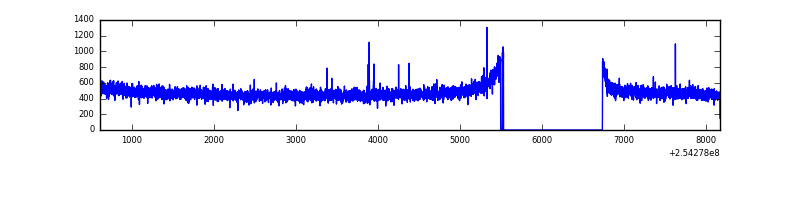 |
| D | 7554 | 6331 | 8 | 8 | 0.11% | 0.13% | 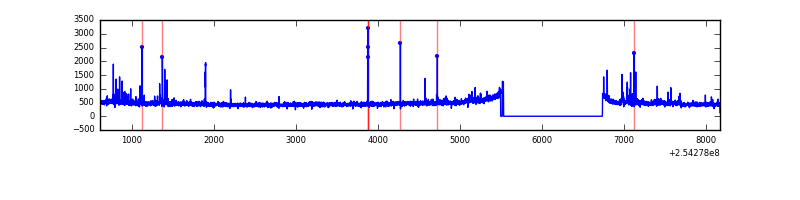 |
Top three noisy pixels from each quadrant. If the there are fewer than three noisy pixels in the level2.evt file, extra rows are filled as -1
| Pixel properties | Quadrant properties | ||||||
|---|---|---|---|---|---|---|---|
| Quadrant | DetID | PixID | Counts | Sigma | Mean | Median | Sigma |
| A | 1 | 162 | 144880 | 914.8 | 775 | 758 | 157.5 |
| A | 1 | 178 | 84042 | 528.64 | 775 | 758 | 157.5 |
| A | 1 | 161 | 70862 | 444.98 | 775 | 758 | 157.5 |
| B | 4 | 239 | 163346 | 1100.76 | 781 | 762 | 147.7 |
| B | 0 | 214 | 32716 | 216.34 | 781 | 762 | 147.7 |
| B | 0 | 205 | 24324 | 159.52 | 781 | 762 | 147.7 |
| C | 13 | 61 | 5573 | 27.22 | 763 | 768 | 176.5 |
| C | 14 | 234 | 4584 | 21.62 | 763 | 768 | 176.5 |
| C | 8 | 222 | 2776 | 11.38 | 763 | 768 | 176.5 |
| D | 1 | 52 | 71501 | 388.01 | 754 | 734 | 182.4 |
| D | 8 | 195 | 44833 | 241.79 | 754 | 734 | 182.4 |
| D | 13 | 249 | 28980 | 154.87 | 754 | 734 | 182.4 |
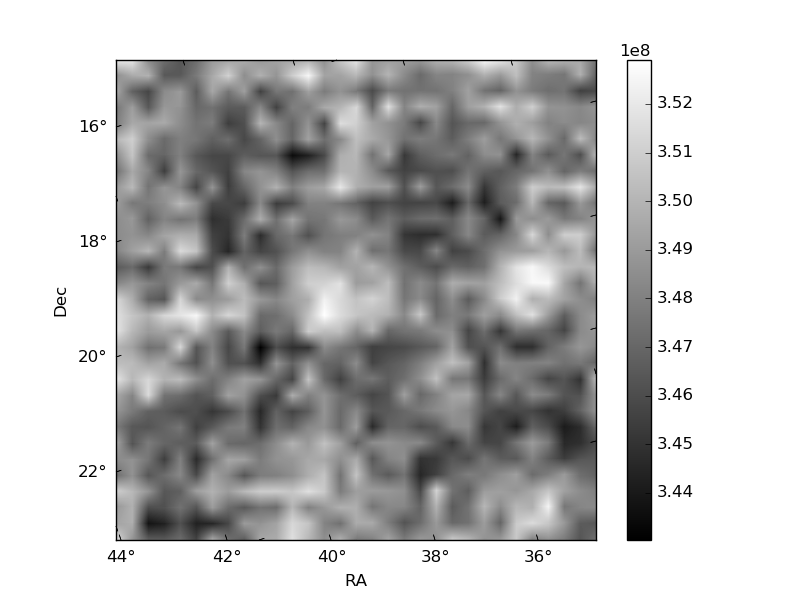
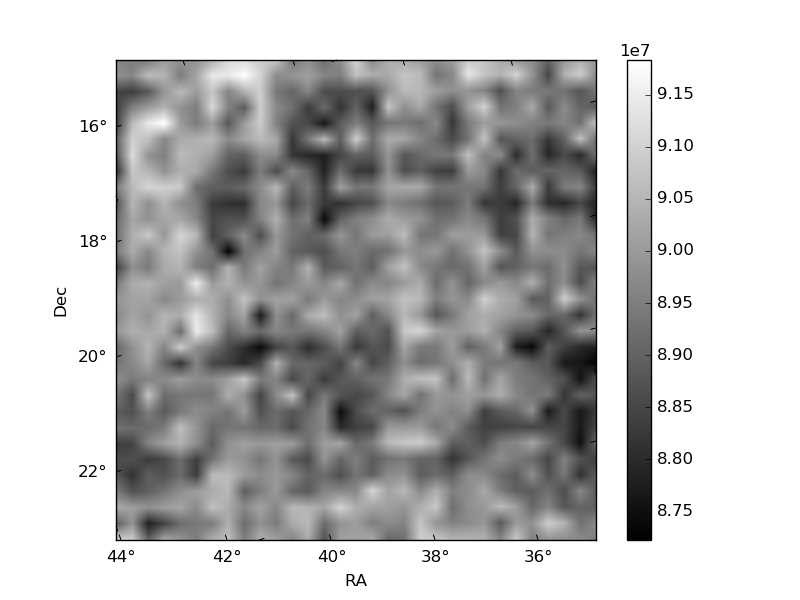
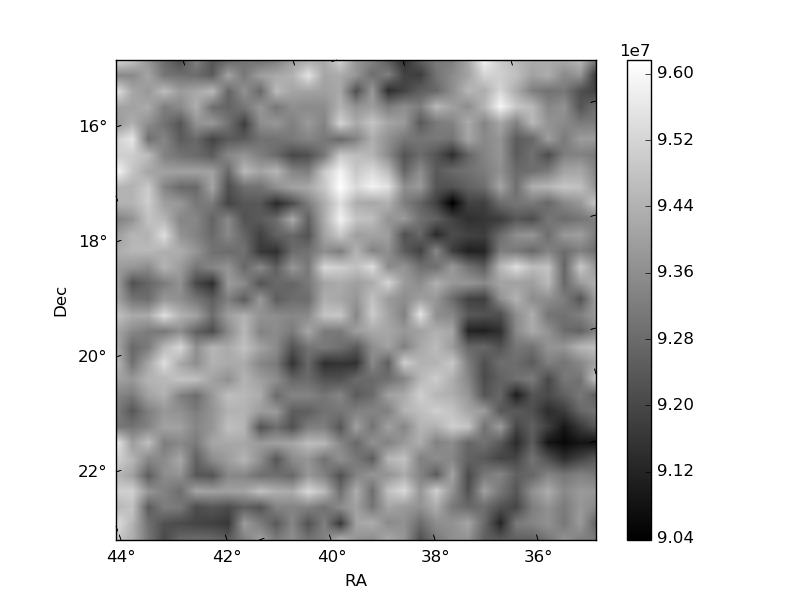
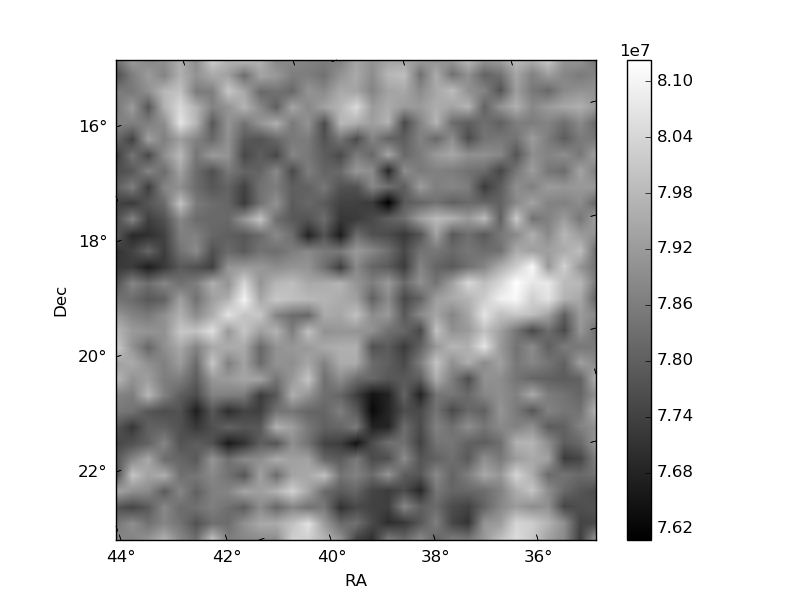
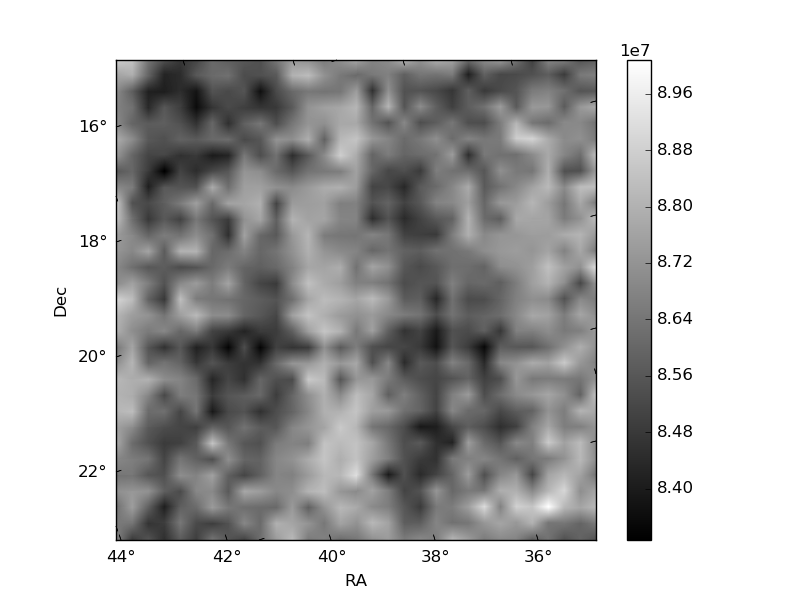
Histogram calculated using DETX and DETY for each event in the final _common_clean file
| Quadrant A | 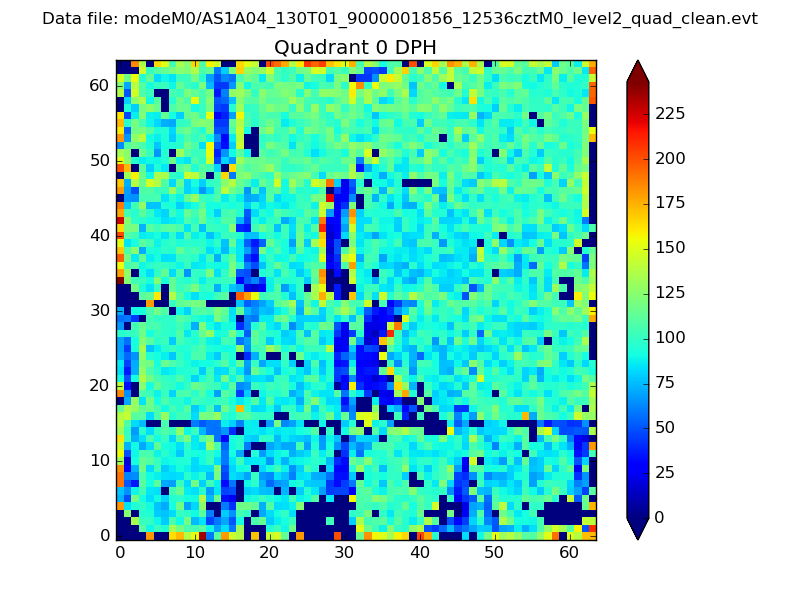 |
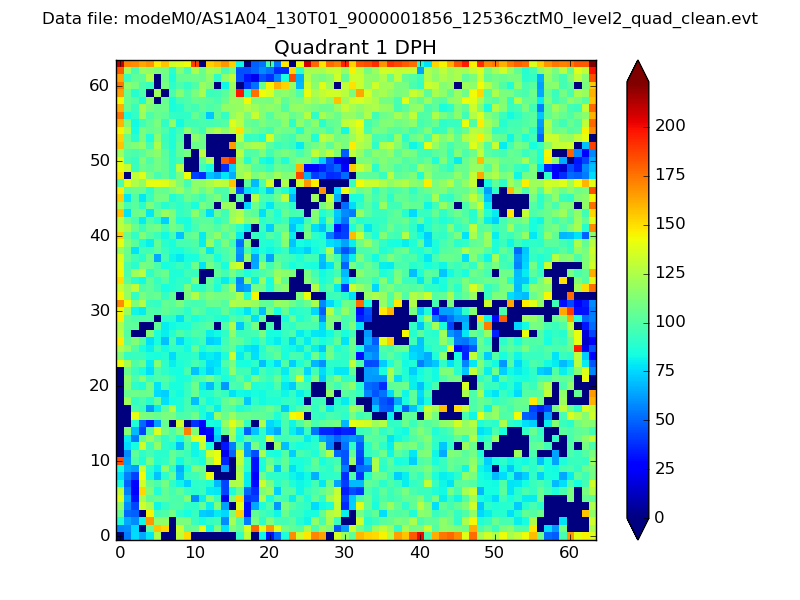 |
Quadrant B |
|---|---|---|---|
| Quadrant D |  |
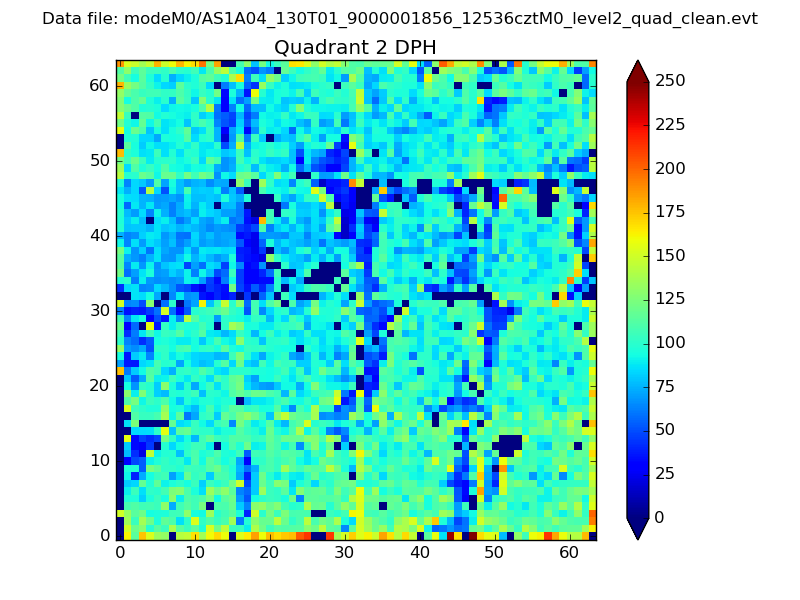 |
Quadrant C |
| Plot type | Count rate plots | Images |
|---|---|---|
| Comparison with Poisson distribution Blue bars denote a histogram of data divided into 1 sec bins. Red curve is a Poisson curve with rate = median count rate of data. |
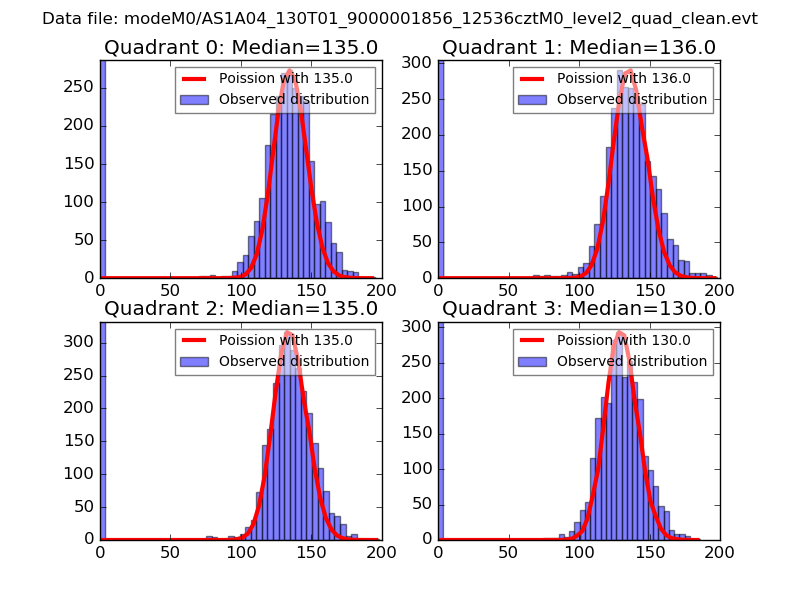 |
 |
| Quadrant-wise count rates Data is divided into 100 sec bins |
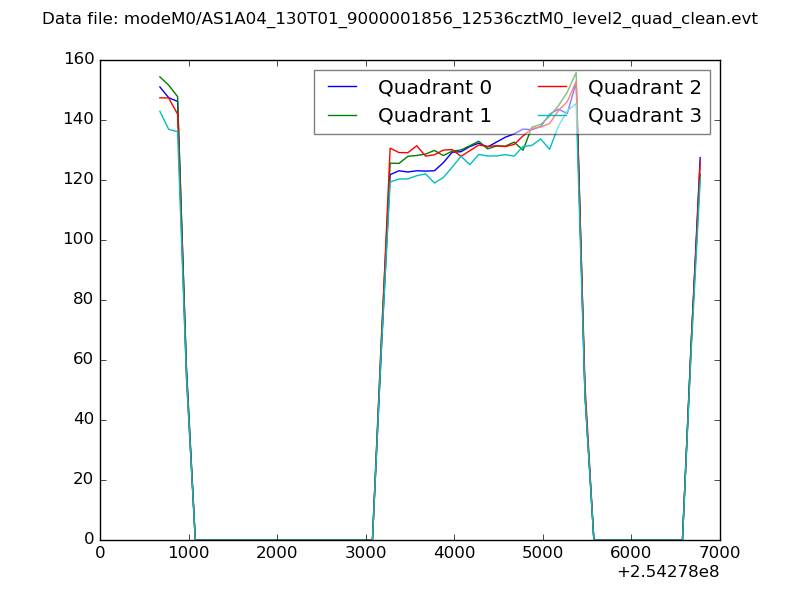 |
|
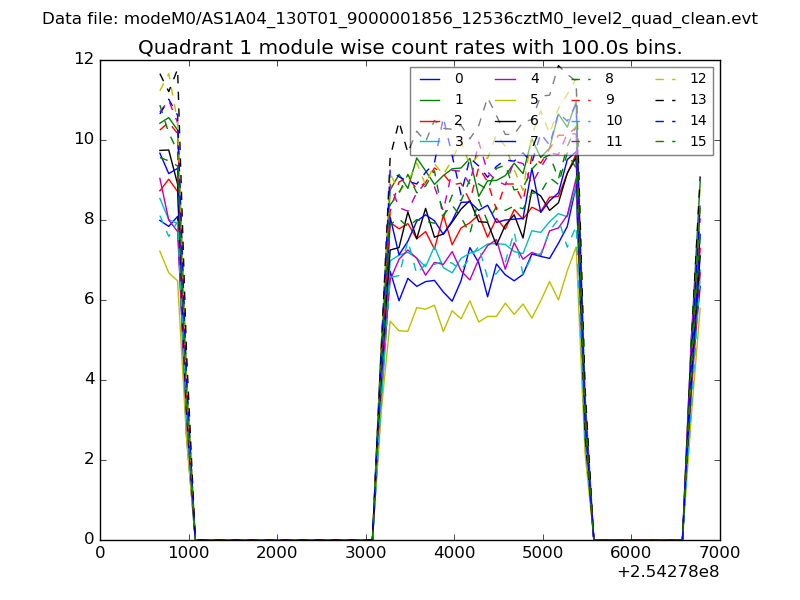
| Module-wise count rates for Quadrant A Data is divided into 100 sec bins |
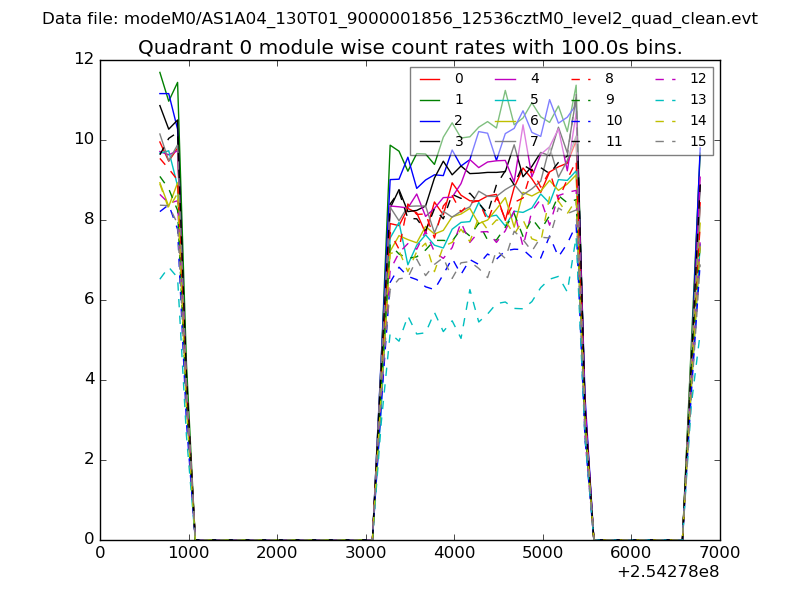 |
 |
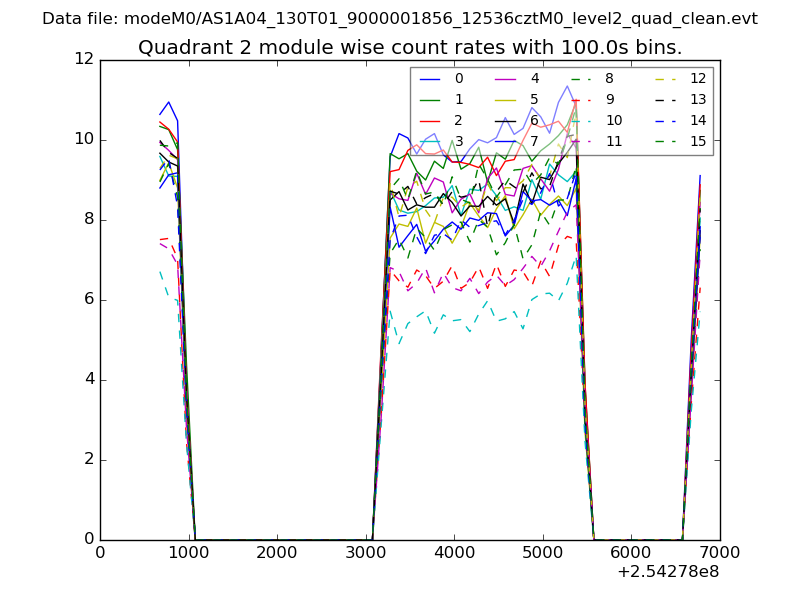
| Module-wise count rates for Quadrant B Data is divided into 100 sec bins |
 |
 |
| Module-wise count rates for Quadrant C Data is divided into 100 sec bins |
 |
 |
| Module-wise count rates for Quadrant D Data is divided into 100 sec bins |
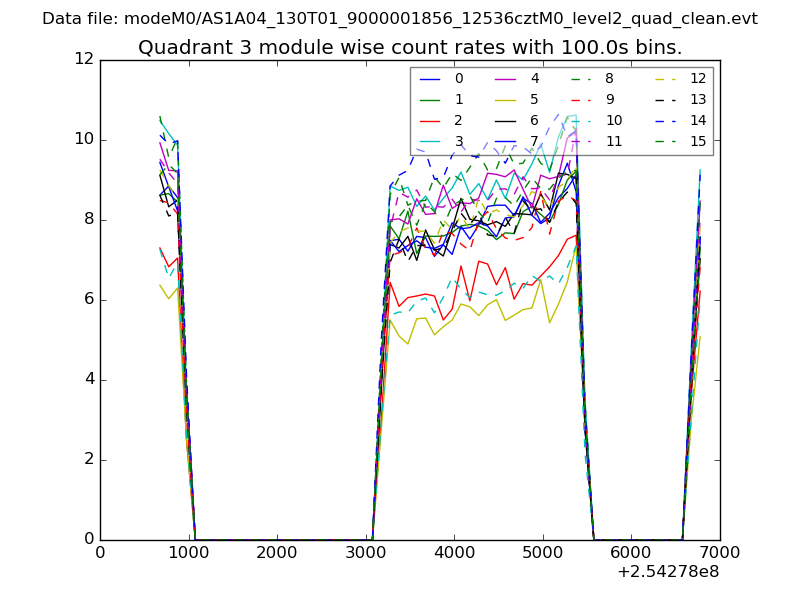 |
 |
| Parameter | Plot |
|---|---|
| CZT HV Monitor | 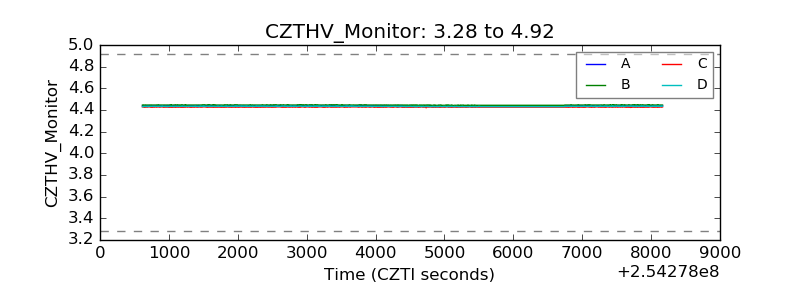 |
| D_VDD | 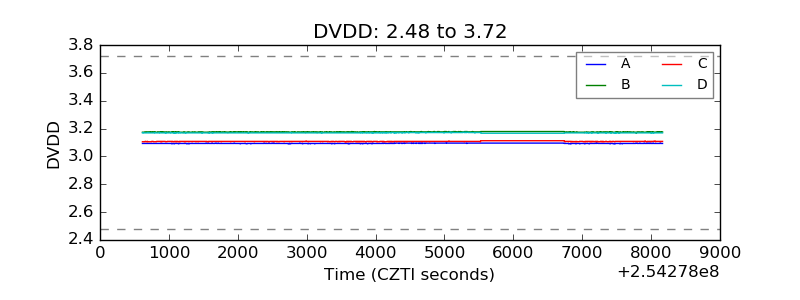 |
| Temperature 1 | 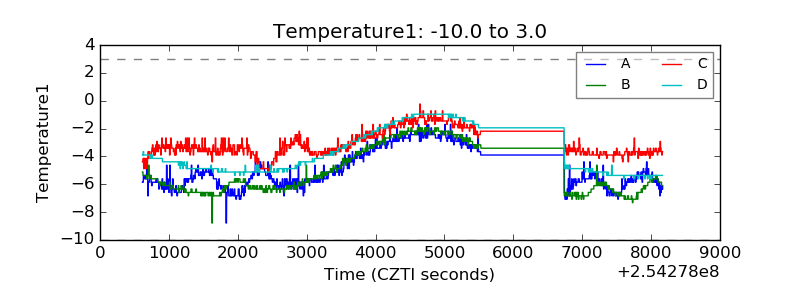 |
| Veto HV Monitor | 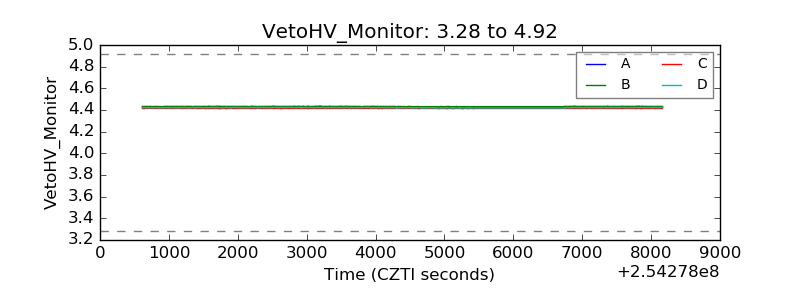 |
| Veto LLD | 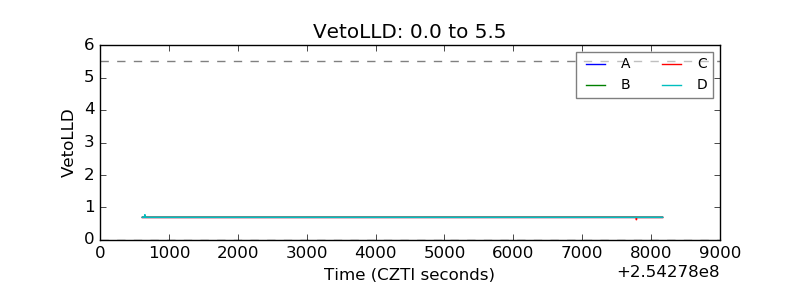 |
| Alpha Counter | 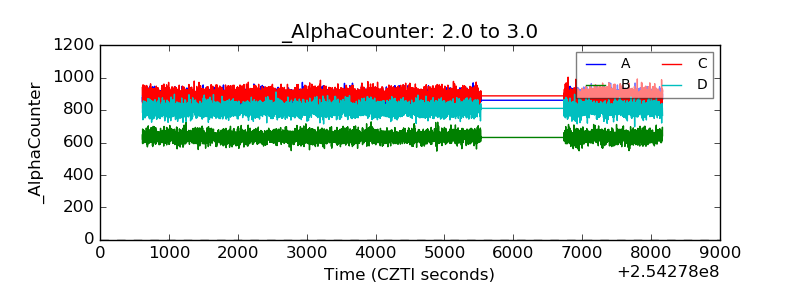 |
| _CPM_Rate | 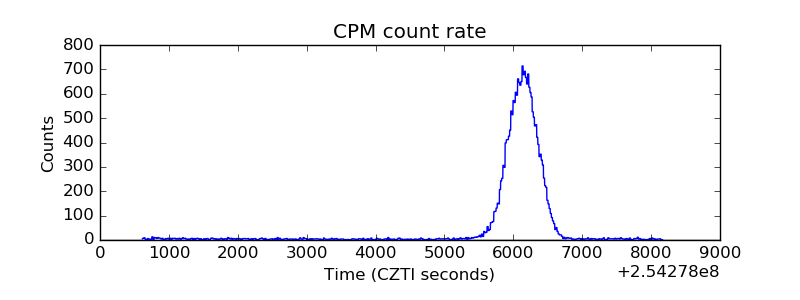 |
| CZT Counter | 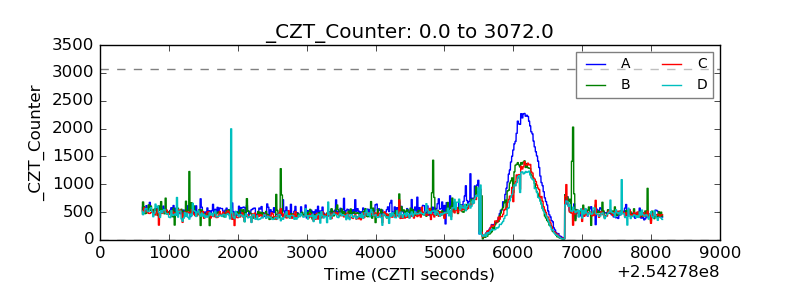 |
| +2.5 Volts monitor |  |
| +5 Volts monitor |  |
| _ROLL_ROT | 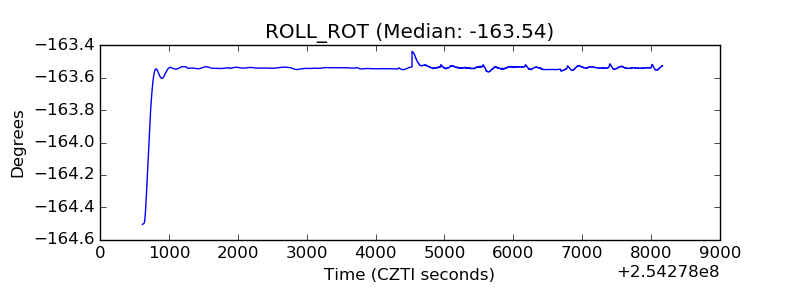 |
| _Roll_DEC | 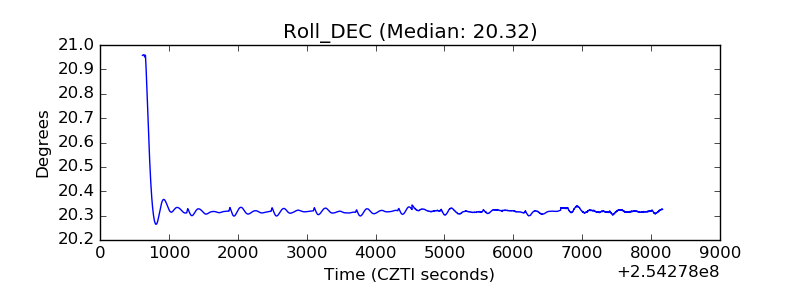 |
| _Roll_RA | 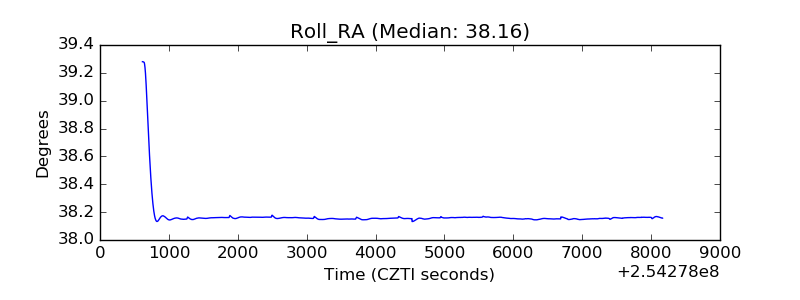 |
| Veto Counter | 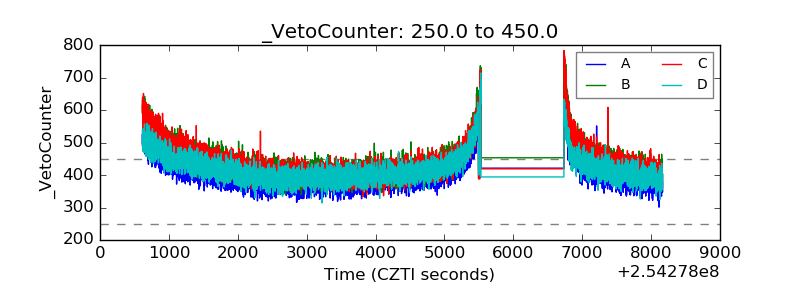 |