| Param | Original file | Final file |
|---|---|---|
| Filename | modeM0/AS1A04_130T01_9000001856_12538cztM0_level2.evt | modeM0/AS1A04_130T01_9000001856_12538cztM0_level2_quad_clean.evt |
| Size (bytes) | 491,866,560 | 77,011,200 |
| Size | 469.1 MB | 73.4 MB |
| Events in quadrant A | 3,777,423 | 463,112 |
| Events in quadrant B | 3,656,112 | 461,537 |
| Events in quadrant C | 3,406,679 | 458,631 |
| Events in quadrant D | 3,565,108 | 445,502 |
| Mode M9 | |||
|---|---|---|---|
| Quadrant | BADHDUFLAG | Total packets | Discarded packets |
| A | 0 | 13 | 0 |
| B | 0 | 13 | 0 |
| C | 0 | 13 | 0 |
| D | 0 | 13 | 0 |
| Mode M0 | |||
|---|---|---|---|
| Quadrant | BADHDUFLAG | Total packets | Discarded packets |
| A | 0 | 15684 | 3 |
| B | 0 | 15453 | 2 |
| C | 0 | 14953 | 2 |
| D | 0 | 15610 | 2 |
| Mode SS | |||
|---|---|---|---|
| Quadrant | BADHDUFLAG | Total packets | Discarded packets |
| A | 0 | 148 | 0 |
| B | 0 | 148 | 0 |
| C | 0 | 148 | 0 |
| D | 0 | 148 | 0 |
| Quadrant | Total seconds | Saturated seconds | Saturation percentage |
|---|---|---|---|
| A | 7227 | 169 | 2.338453% |
| B | 7227 | 207 | 2.864259% |
| C | 7227 | 100 | 1.383700% |
| D | 7227 | 122 | 1.688114% |
Noise dominated data is calculated using 1-second bins in cleaned event files. If a bin has >2000 counts, and if more than 50% of those come from <1% of pixels, then it is considered to be noise-dominated and hence unusable.
| Quadrant | # 1 sec bins | Bins with >0 counts | Bins with >2000 counts | High rate bins dominated by noise | Noise dominated (total time) | Noise dominated (detector-on time) | Marked lightcurve |
|---|---|---|---|---|---|---|---|
| A | 8463 | 7229 | 0 | 0 | 0.00% | 0.00% | 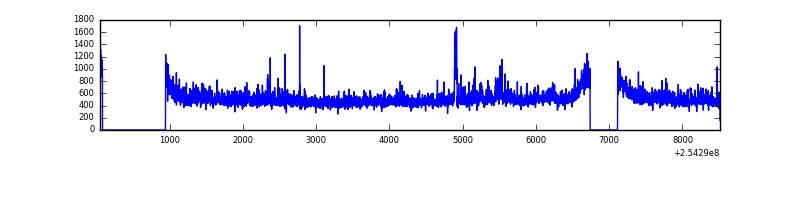 |
| B | 8463 | 7228 | 1 | 1 | 0.01% | 0.01% | 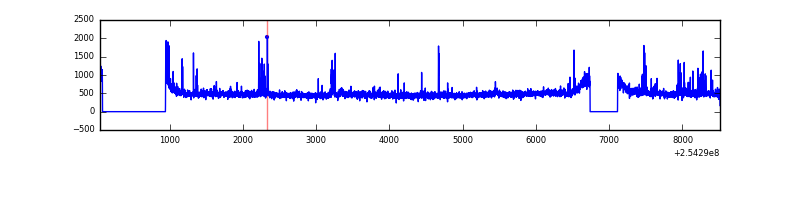 |
| C | 8463 | 7230 | 0 | 0 | 0.00% | 0.00% | 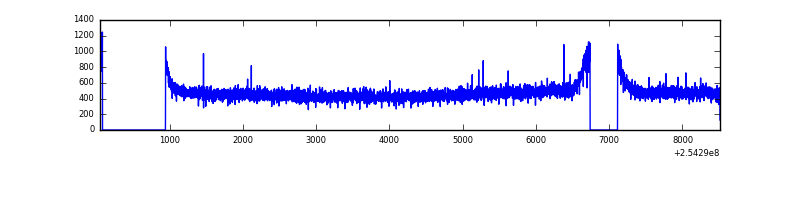 |
| D | 8463 | 7229 | 32 | 32 | 0.38% | 0.44% | 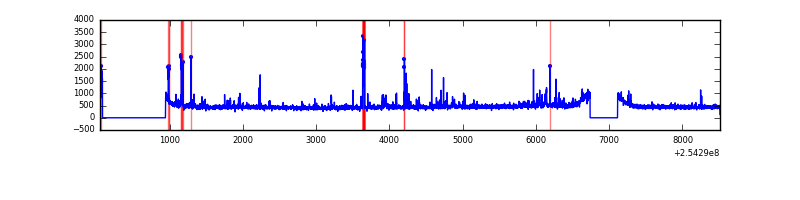 |
Top three noisy pixels from each quadrant. If the there are fewer than three noisy pixels in the level2.evt file, extra rows are filled as -1
| Pixel properties | Quadrant properties | ||||||
|---|---|---|---|---|---|---|---|
| Quadrant | DetID | PixID | Counts | Sigma | Mean | Median | Sigma |
| A | 1 | 162 | 126632 | 698.85 | 881 | 860 | 180.0 |
| A | 1 | 178 | 74142 | 407.19 | 881 | 860 | 180.0 |
| A | 1 | 161 | 61928 | 339.32 | 881 | 860 | 180.0 |
| B | 4 | 239 | 124058 | 721.8 | 880 | 857 | 170.7 |
| B | 0 | 214 | 21388 | 120.28 | 880 | 857 | 170.7 |
| B | 10 | 246 | 20581 | 115.55 | 880 | 857 | 170.7 |
| C | 3 | 0 | 40699 | 197.57 | 862 | 866 | 201.6 |
| C | 13 | 61 | 6533 | 28.11 | 862 | 866 | 201.6 |
| C | 3 | 233 | 4321 | 17.14 | 862 | 866 | 201.6 |
| D | 1 | 52 | 196257 | 948.48 | 855 | 830 | 206.0 |
| D | 8 | 195 | 46798 | 223.1 | 855 | 830 | 206.0 |
| D | 13 | 104 | 36364 | 172.46 | 855 | 830 | 206.0 |
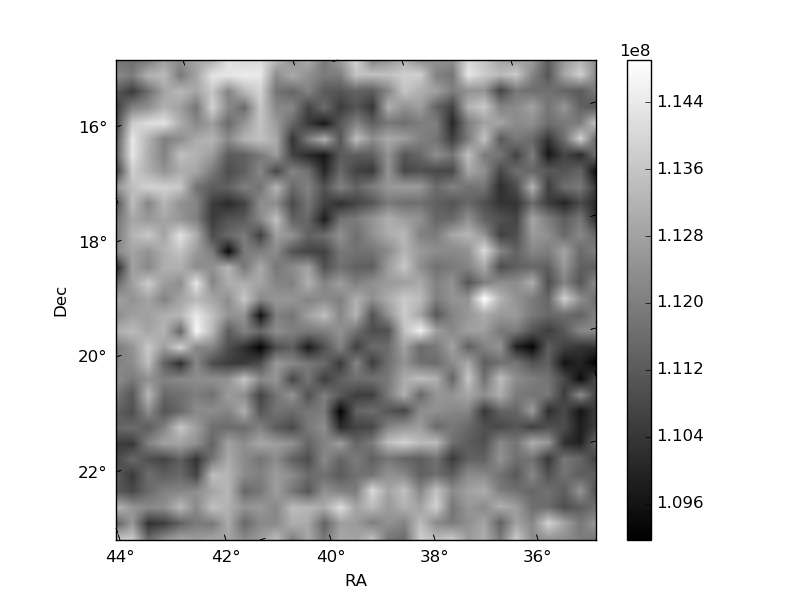
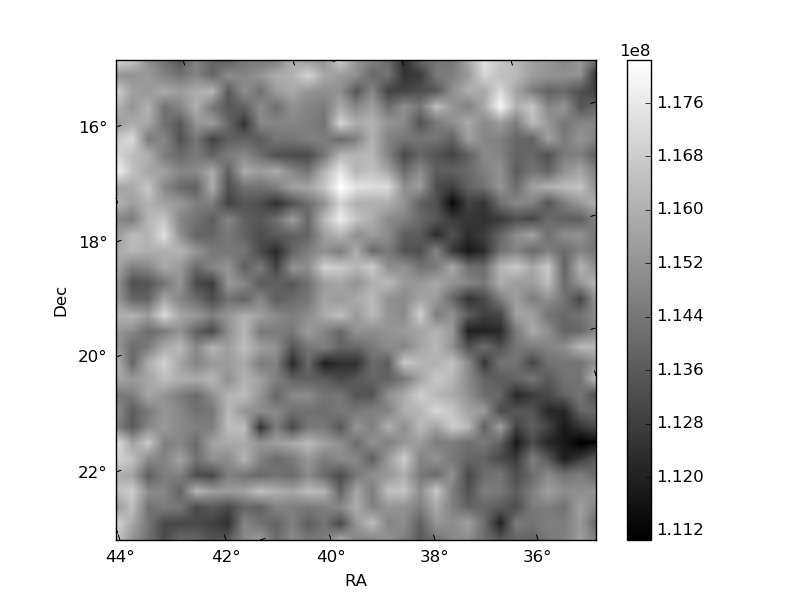
Histogram calculated using DETX and DETY for each event in the final _common_clean file
| Quadrant A | 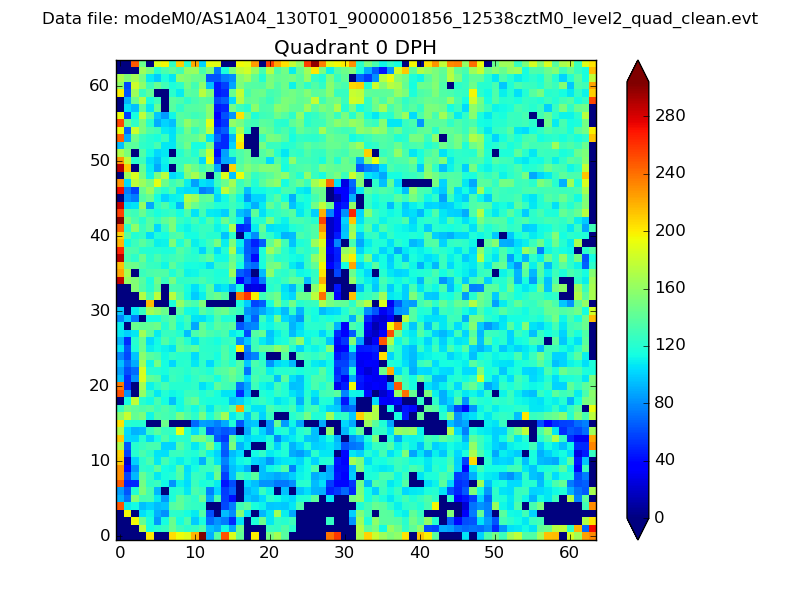 |
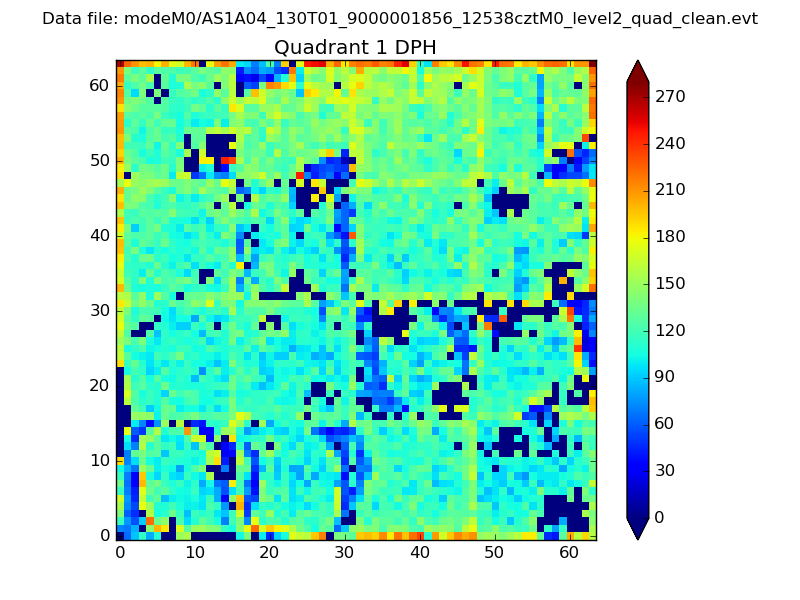 |
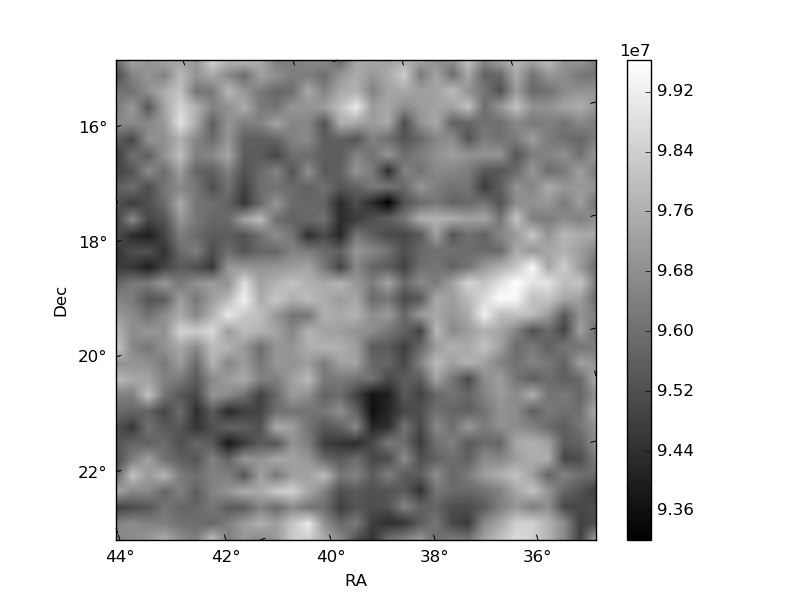
Quadrant B |
|---|---|---|---|
| Quadrant D | 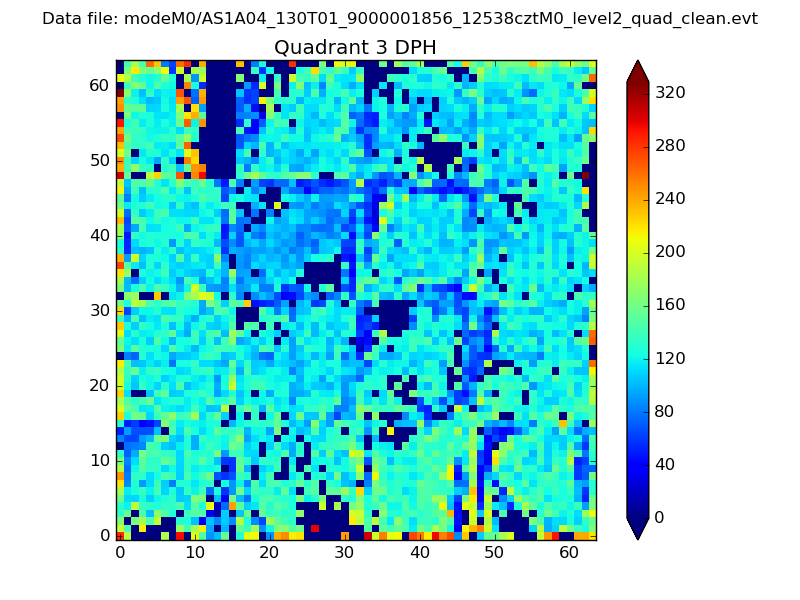 |
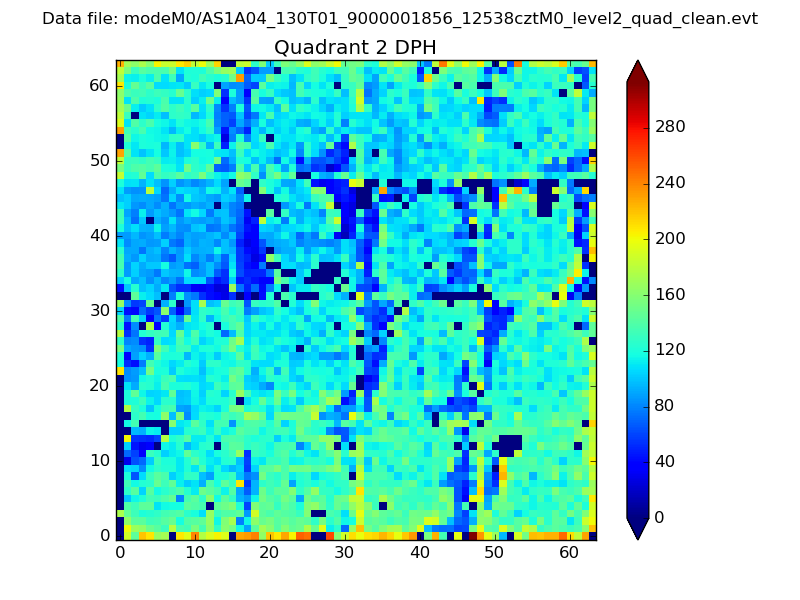 |
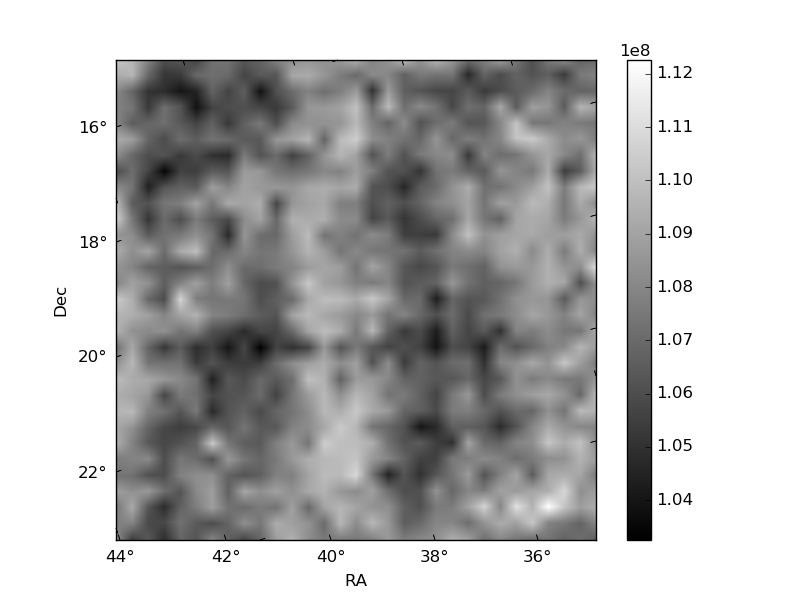
Quadrant C |
| Plot type | Count rate plots | Images |
|---|---|---|
| Comparison with Poisson distribution Blue bars denote a histogram of data divided into 1 sec bins. Red curve is a Poisson curve with rate = median count rate of data. |
 |
 |
| Quadrant-wise count rates Data is divided into 100 sec bins |
 |
|
| Module-wise count rates for Quadrant A Data is divided into 100 sec bins |
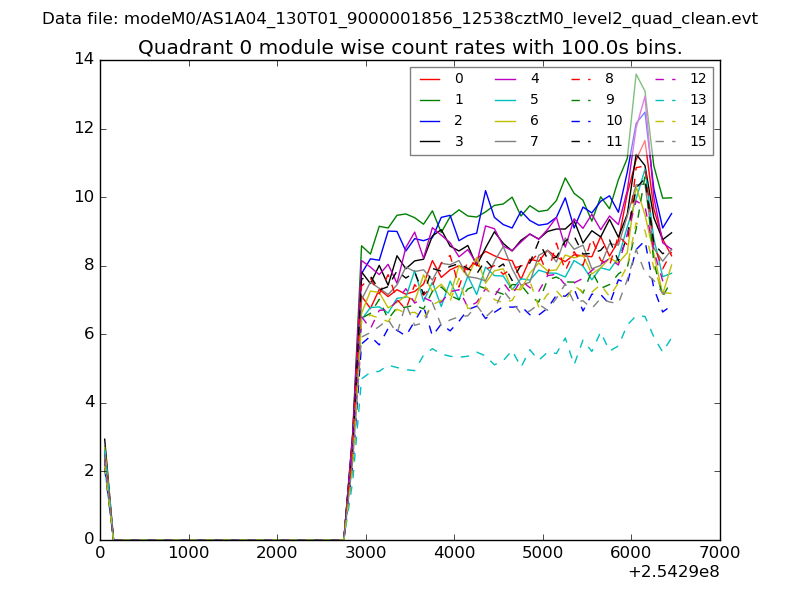 |
 |
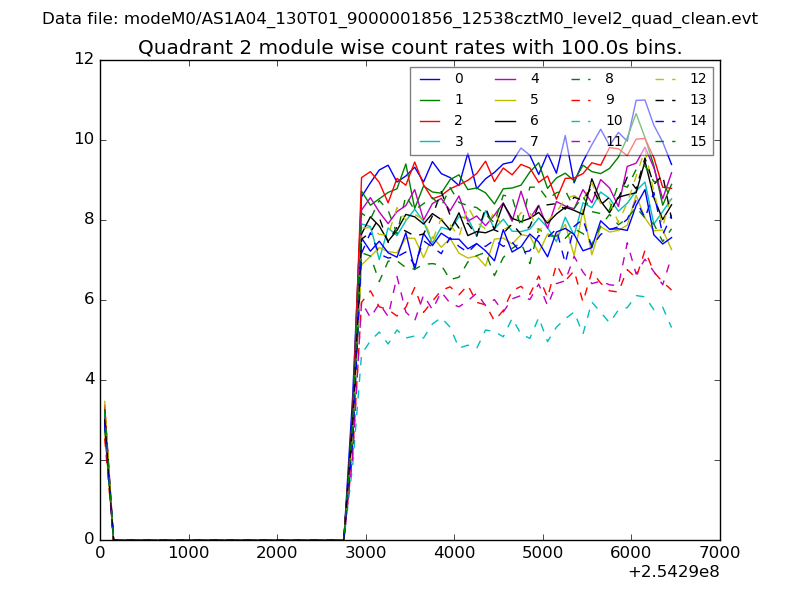
| Module-wise count rates for Quadrant B Data is divided into 100 sec bins |
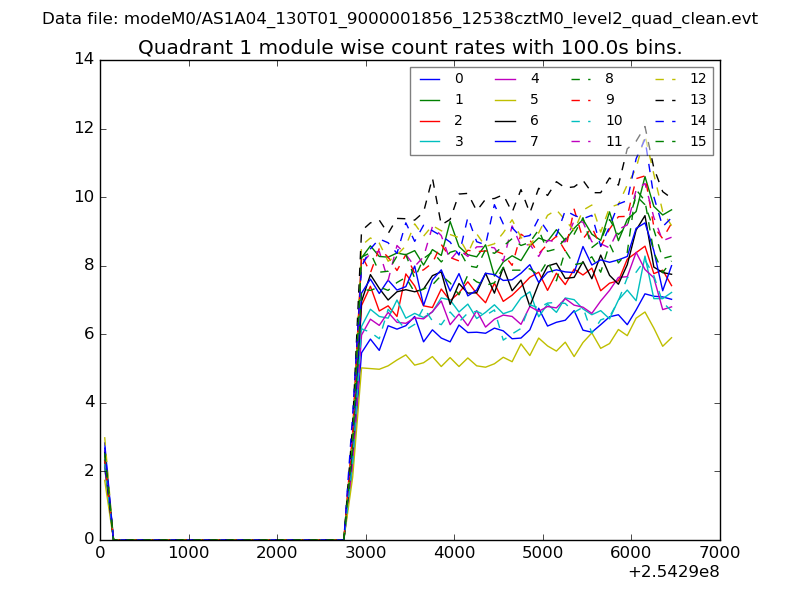 |
 |
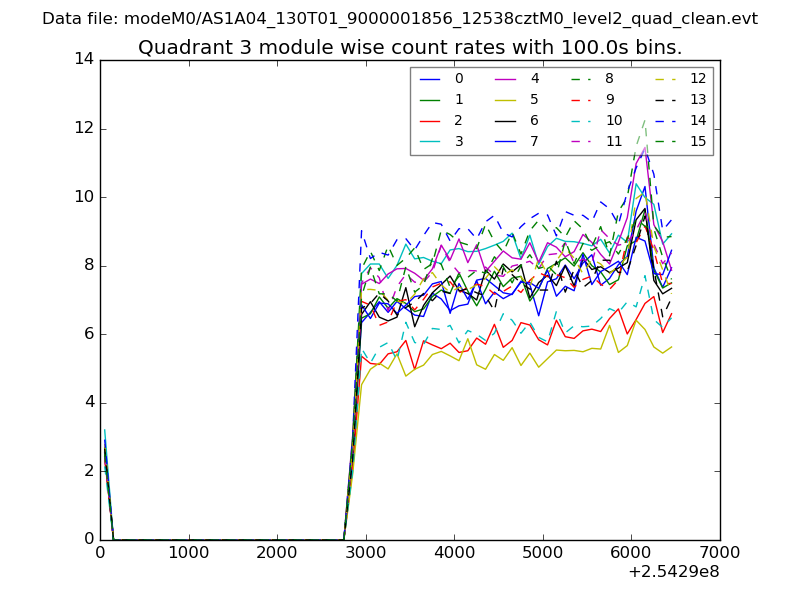
| Module-wise count rates for Quadrant C Data is divided into 100 sec bins |
 |
 |
| Module-wise count rates for Quadrant D Data is divided into 100 sec bins |
 |
 |
| Parameter | Plot |
|---|---|
| CZT HV Monitor | 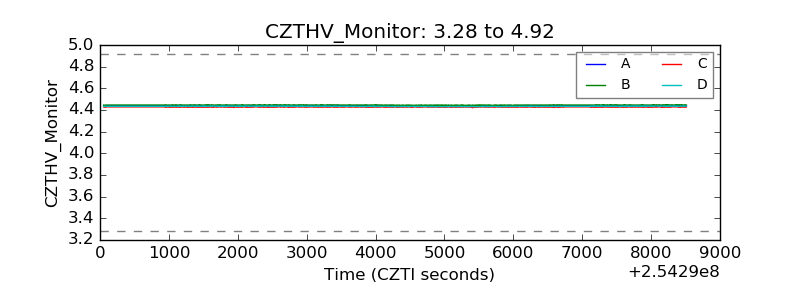 |
| D_VDD | 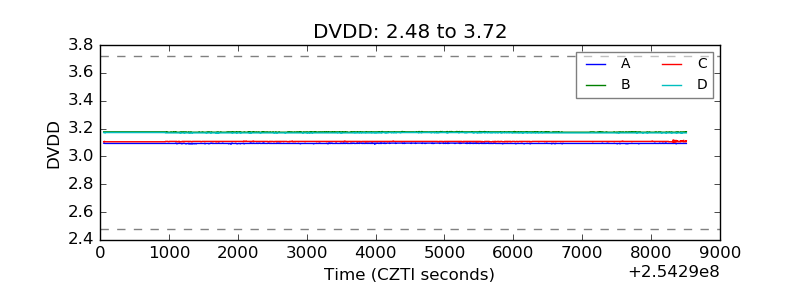 |
| Temperature 1 | 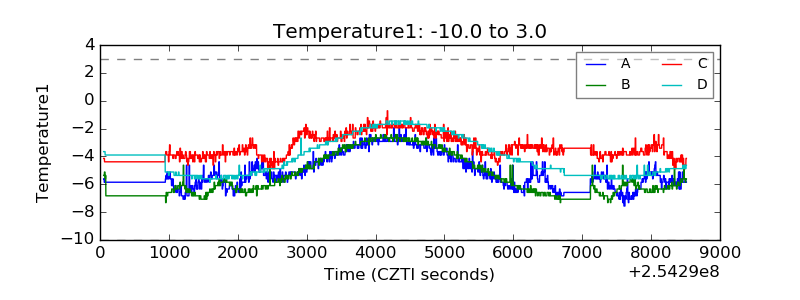 |
| Veto HV Monitor | 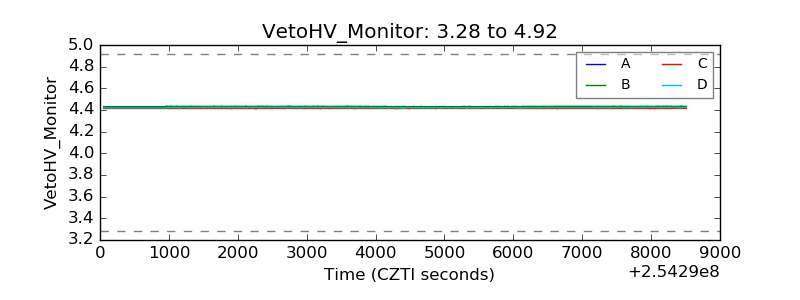 |
| Veto LLD | 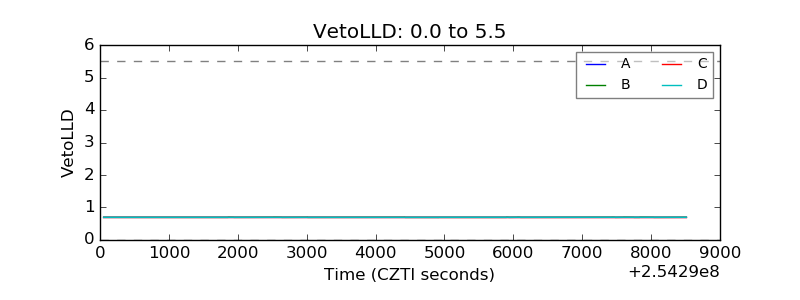 |
| Alpha Counter |  |
| _CPM_Rate |  |
| CZT Counter | 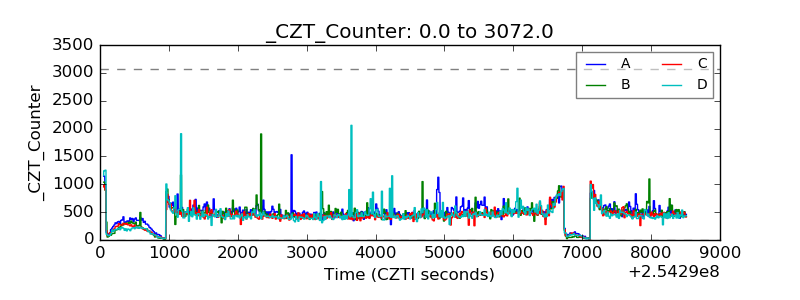 |
| +2.5 Volts monitor |  |
| +5 Volts monitor |  |
| _ROLL_ROT | 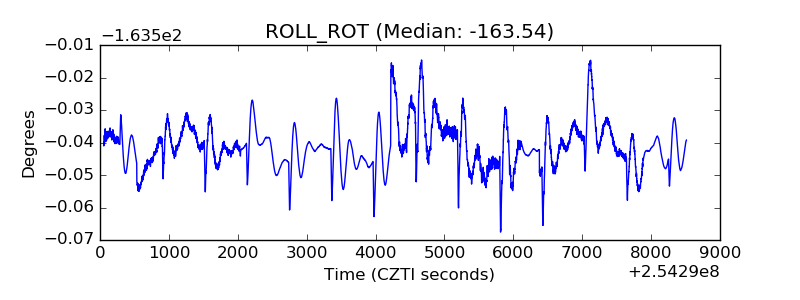 |
| _Roll_DEC | 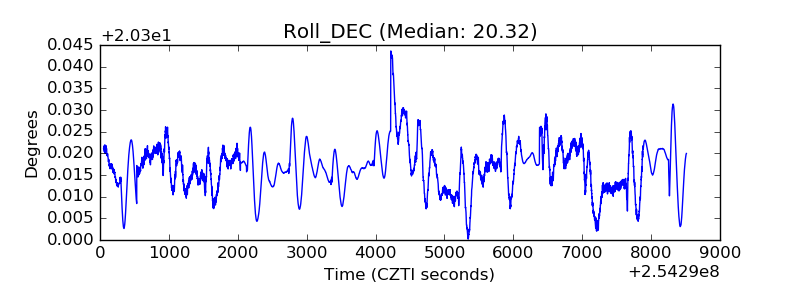 |
| _Roll_RA | 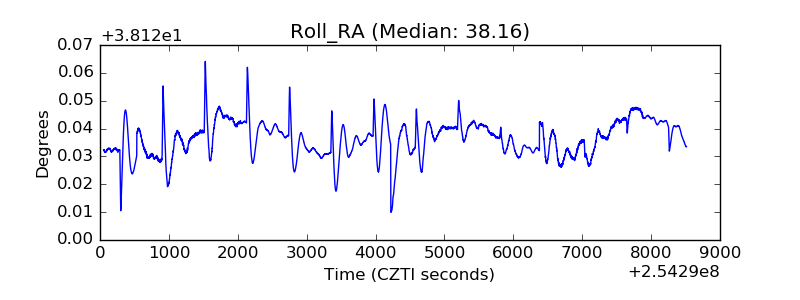 |
| Veto Counter | 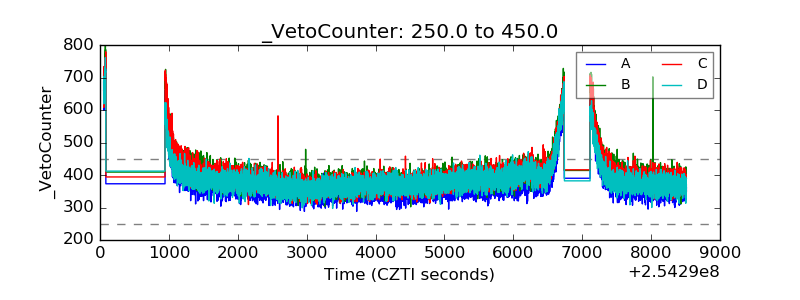 |