| Param | Original file | Final file |
|---|---|---|
| Filename | modeM0/AS1A04_130T01_9000001856_12539cztM0_level2.evt | modeM0/AS1A04_130T01_9000001856_12539cztM0_level2_quad_clean.evt |
| Size (bytes) | 550,200,960 | 81,368,640 |
| Size | 524.7 MB | 77.6 MB |
| Events in quadrant A | 4,088,592 | 481,896 |
| Events in quadrant B | 4,051,213 | 487,027 |
| Events in quadrant C | 3,719,441 | 481,751 |
| Events in quadrant D | 4,268,356 | 465,275 |
| Mode M9 | |||
|---|---|---|---|
| Quadrant | BADHDUFLAG | Total packets | Discarded packets |
| A | 0 | 4 | 0 |
| B | 0 | 4 | 0 |
| C | 0 | 4 | 0 |
| D | 0 | 4 | 0 |
| Mode M0 | |||
|---|---|---|---|
| Quadrant | BADHDUFLAG | Total packets | Discarded packets |
| A | 0 | 16988 | 3 |
| B | 0 | 17128 | 2 |
| C | 0 | 16385 | 2 |
| D | 0 | 17947 | 2 |
| Mode SS | |||
|---|---|---|---|
| Quadrant | BADHDUFLAG | Total packets | Discarded packets |
| A | 0 | 158 | 0 |
| B | 0 | 158 | 0 |
| C | 0 | 158 | 0 |
| D | 0 | 158 | 0 |
| Quadrant | Total seconds | Saturated seconds | Saturation percentage |
|---|---|---|---|
| A | 7885 | 306 | 3.880786% |
| B | 7885 | 359 | 4.552949% |
| C | 7885 | 137 | 1.737476% |
| D | 7885 | 207 | 2.625238% |
Noise dominated data is calculated using 1-second bins in cleaned event files. If a bin has >2000 counts, and if more than 50% of those come from <1% of pixels, then it is considered to be noise-dominated and hence unusable.
| Quadrant | # 1 sec bins | Bins with >0 counts | Bins with >2000 counts | High rate bins dominated by noise | Noise dominated (total time) | Noise dominated (detector-on time) | Marked lightcurve |
|---|---|---|---|---|---|---|---|
| A | 8276 | 7888 | 0 | 0 | 0.00% | 0.00% | 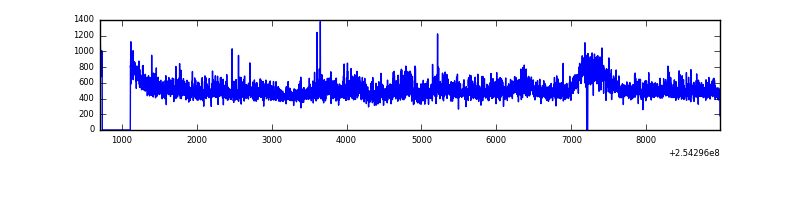 |
| B | 8276 | 7887 | 5 | 5 | 0.06% | 0.06% | 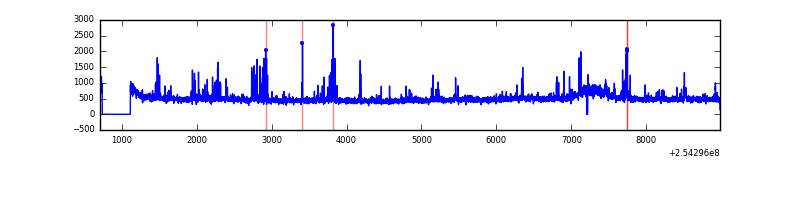 |
| C | 8276 | 7888 | 0 | 0 | 0.00% | 0.00% | 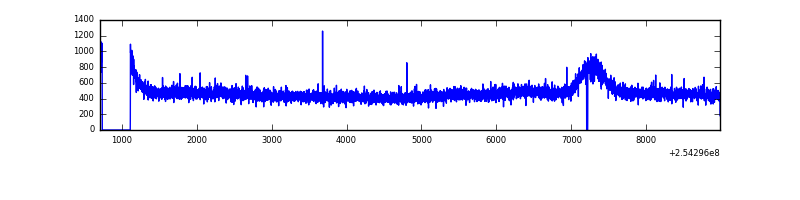 |
| D | 8276 | 7888 | 58 | 58 | 0.70% | 0.74% | 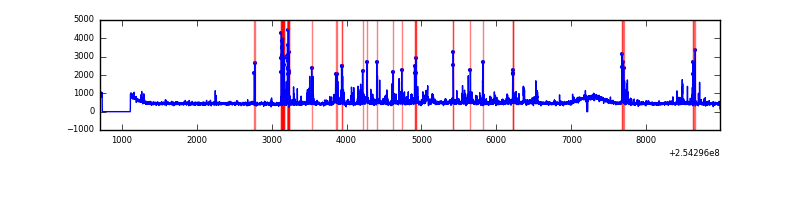 |
Top three noisy pixels from each quadrant. If the there are fewer than three noisy pixels in the level2.evt file, extra rows are filled as -1
| Pixel properties | Quadrant properties | ||||||
|---|---|---|---|---|---|---|---|
| Quadrant | DetID | PixID | Counts | Sigma | Mean | Median | Sigma |
| A | 1 | 162 | 138410 | 699.33 | 960 | 938 | 196.6 |
| A | 1 | 178 | 81176 | 408.18 | 960 | 938 | 196.6 |
| A | 1 | 161 | 67402 | 338.11 | 960 | 938 | 196.6 |
| B | 4 | 239 | 239846 | 1280.99 | 961 | 937 | 186.5 |
| B | 0 | 205 | 37777 | 197.53 | 961 | 937 | 186.5 |
| B | 12 | 111 | 22258 | 114.32 | 961 | 937 | 186.5 |
| C | 3 | 0 | 30905 | 135.95 | 943 | 945 | 220.4 |
| C | 13 | 61 | 7009 | 27.52 | 943 | 945 | 220.4 |
| C | 8 | 128 | 3928 | 13.53 | 943 | 945 | 220.4 |
| D | 1 | 52 | 345695 | 1532.85 | 936 | 910 | 224.9 |
| D | 13 | 104 | 150578 | 665.4 | 936 | 910 | 224.9 |
| D | 8 | 195 | 109158 | 481.25 | 936 | 910 | 224.9 |
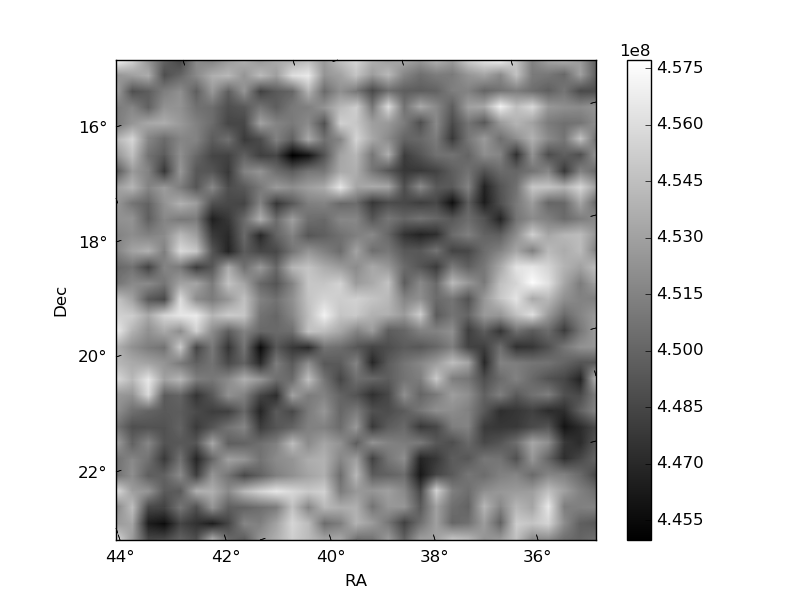
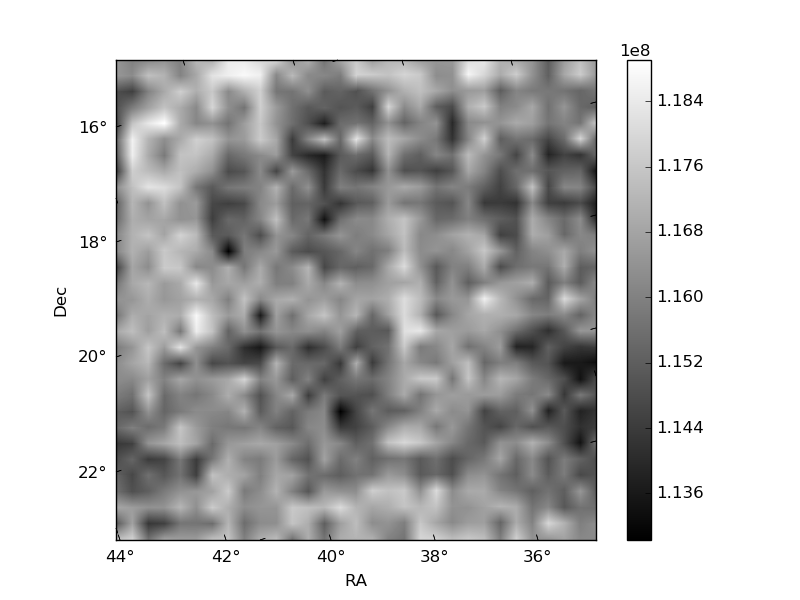
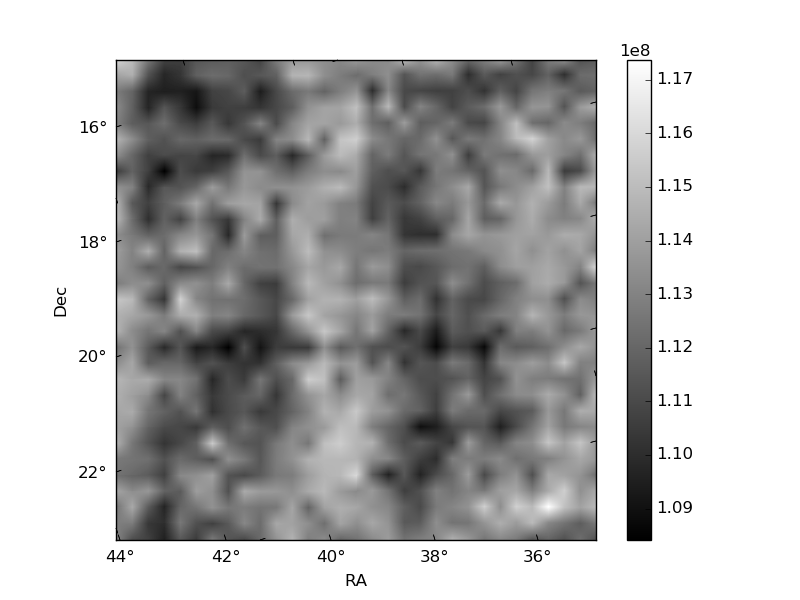
Histogram calculated using DETX and DETY for each event in the final _common_clean file
| Quadrant A | 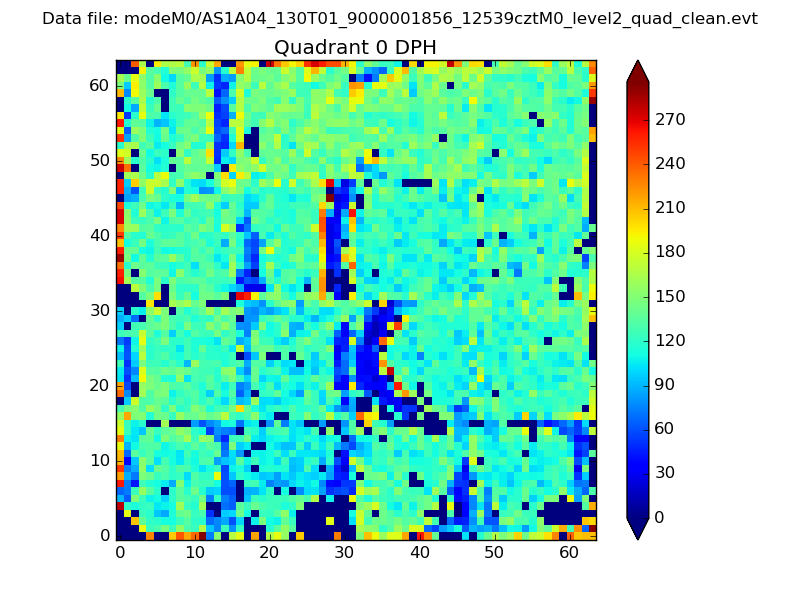 |
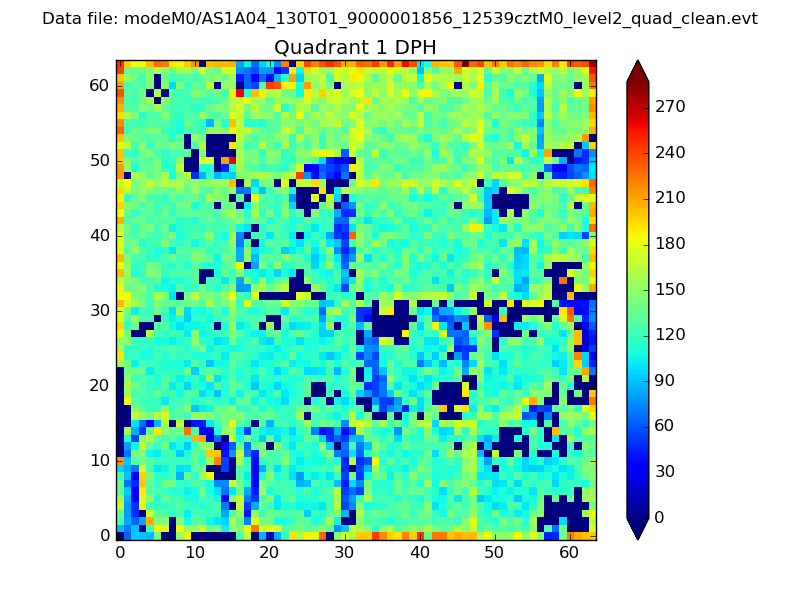 |
Quadrant B |
|---|---|---|---|
| Quadrant D | 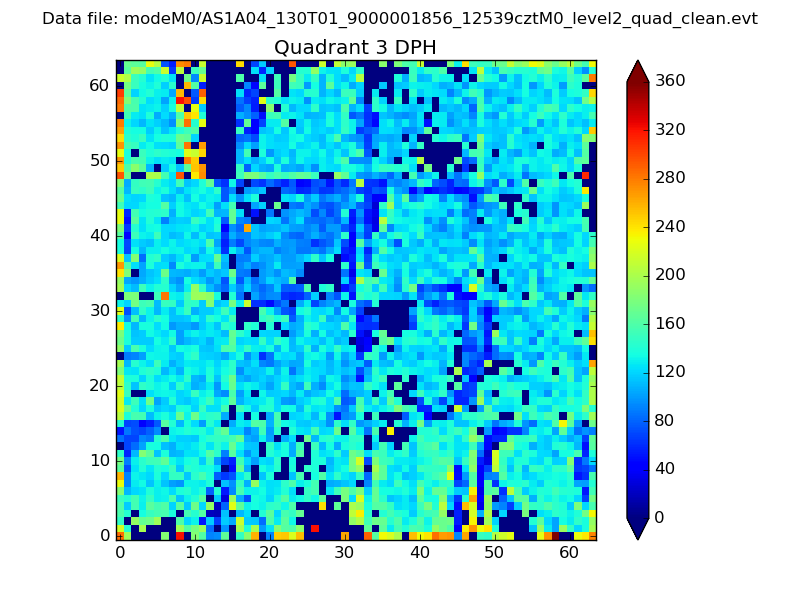 |
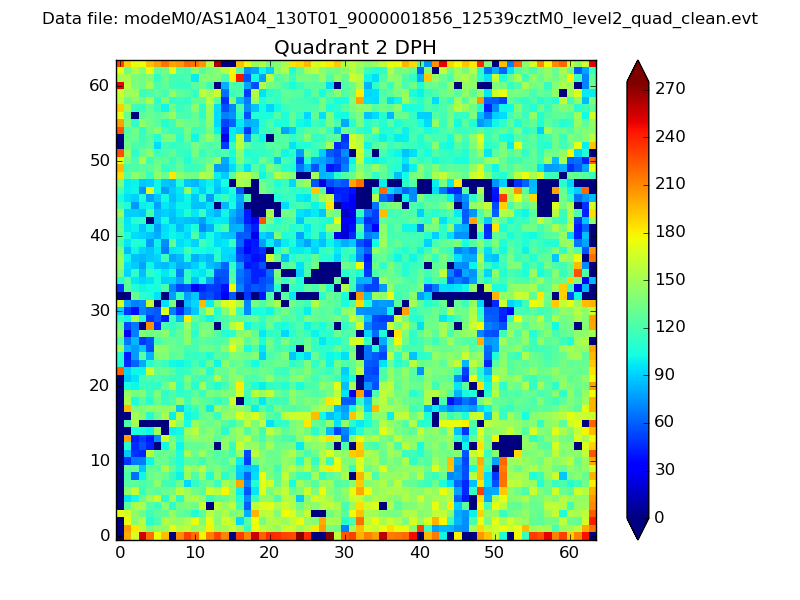 |
Quadrant C |
| Plot type | Count rate plots | Images |
|---|---|---|
| Comparison with Poisson distribution Blue bars denote a histogram of data divided into 1 sec bins. Red curve is a Poisson curve with rate = median count rate of data. |
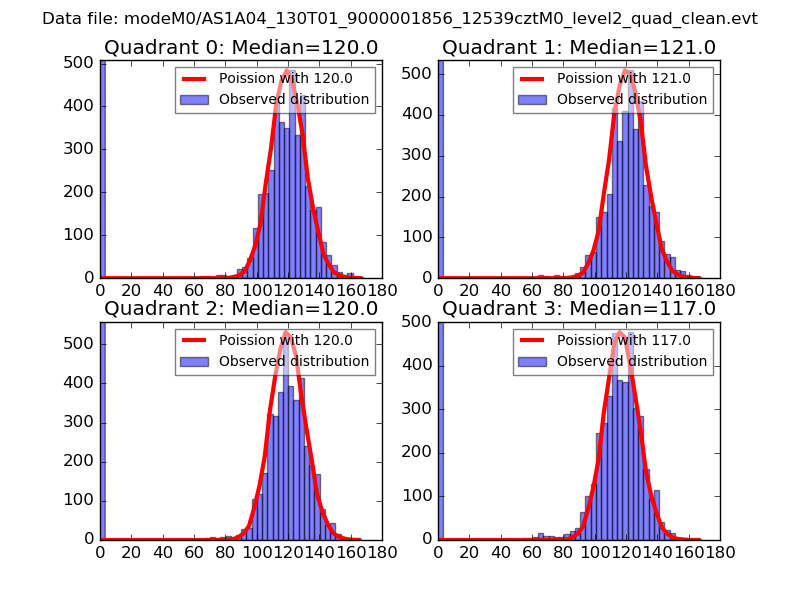 |
 |
| Quadrant-wise count rates Data is divided into 100 sec bins |
 |
|
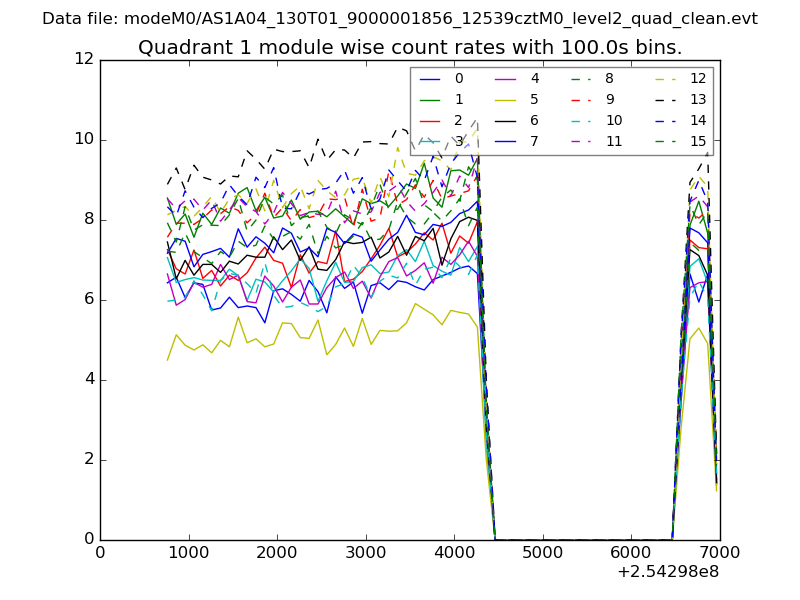
| Module-wise count rates for Quadrant A Data is divided into 100 sec bins |
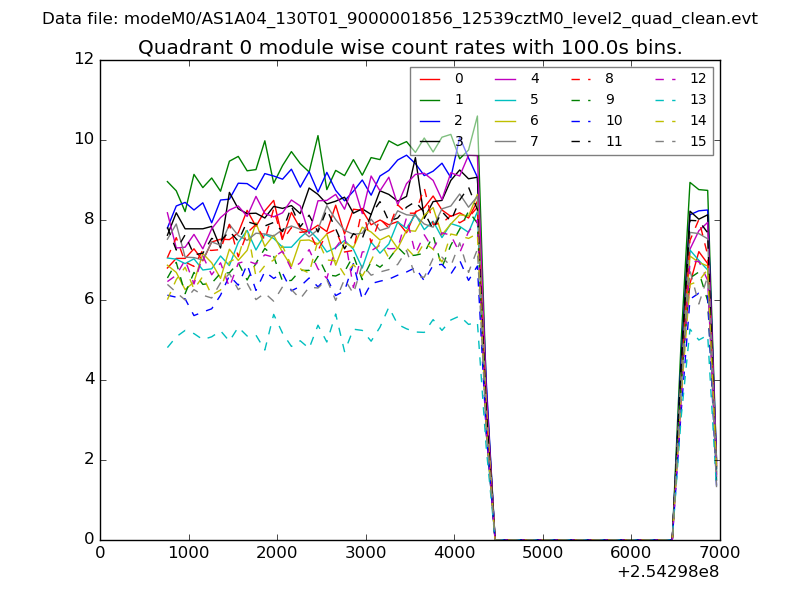 |
 |
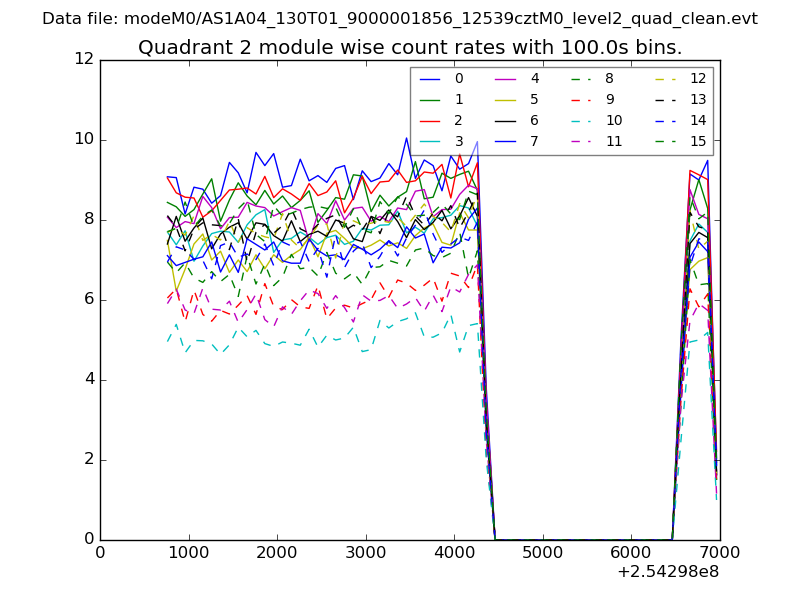
| Module-wise count rates for Quadrant B Data is divided into 100 sec bins |
 |
 |
| Module-wise count rates for Quadrant C Data is divided into 100 sec bins |
 |
 |
| Module-wise count rates for Quadrant D Data is divided into 100 sec bins |
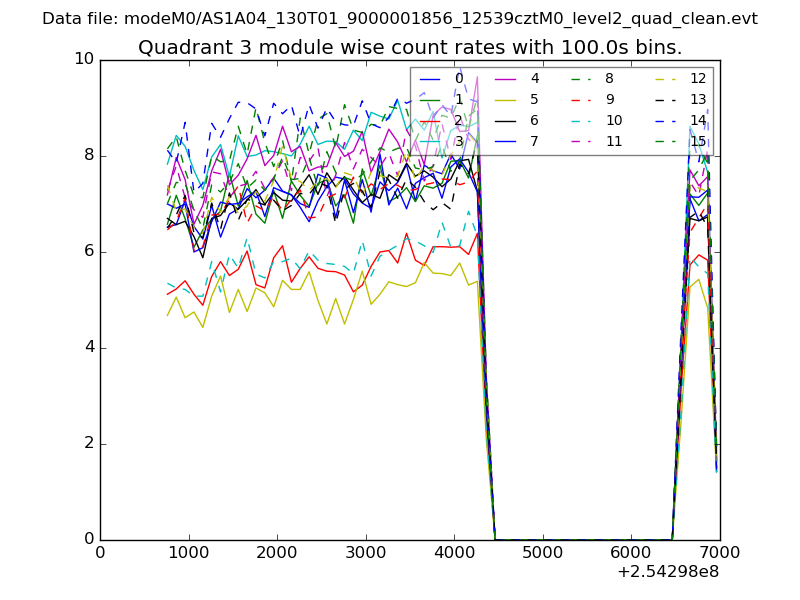 |
 |
| Parameter | Plot |
|---|---|
| CZT HV Monitor | 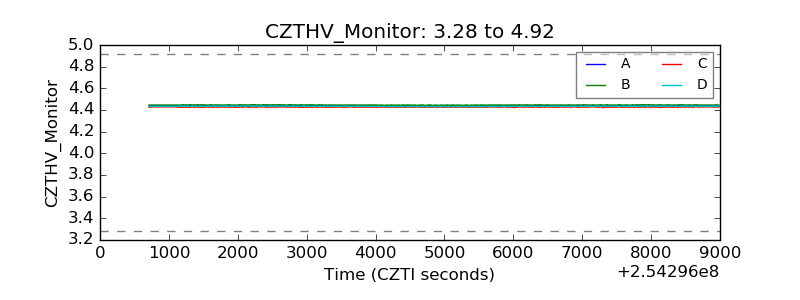 |
| D_VDD | 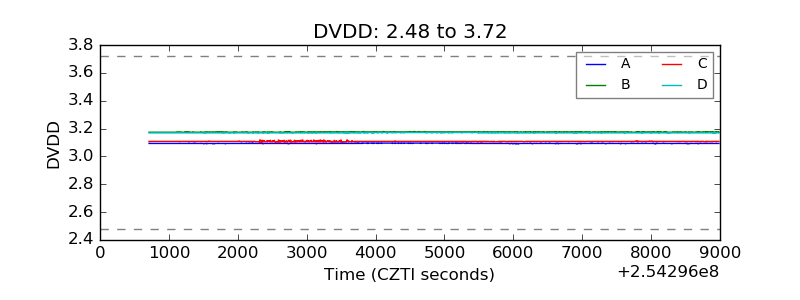 |
| Temperature 1 | 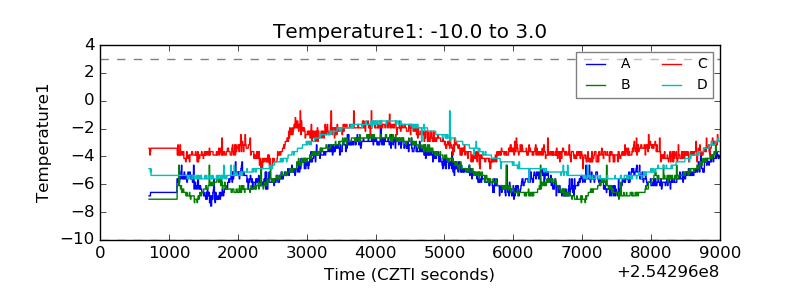 |
| Veto HV Monitor | 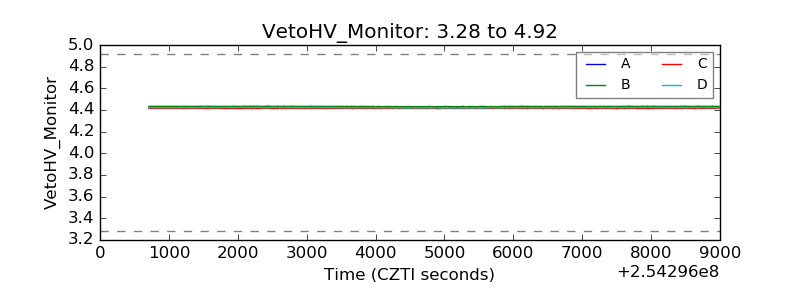 |
| Veto LLD | 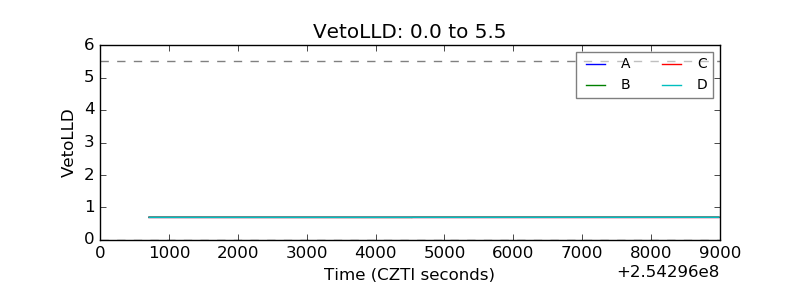 |
| Alpha Counter | 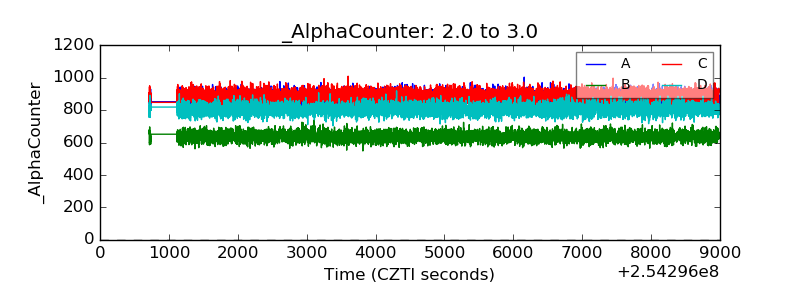 |
| _CPM_Rate |  |
| CZT Counter | 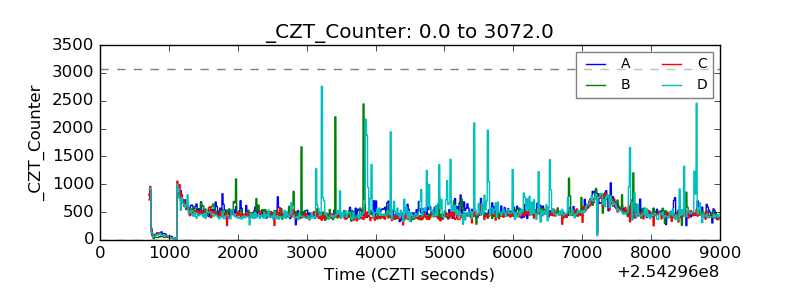 |
| +2.5 Volts monitor |  |
| +5 Volts monitor |  |
| _ROLL_ROT | 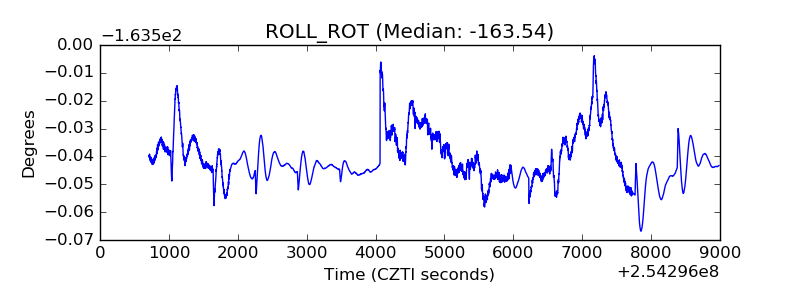 |
| _Roll_DEC | 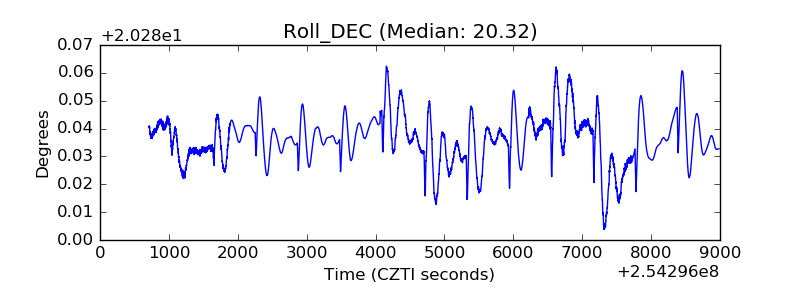 |
| _Roll_RA | 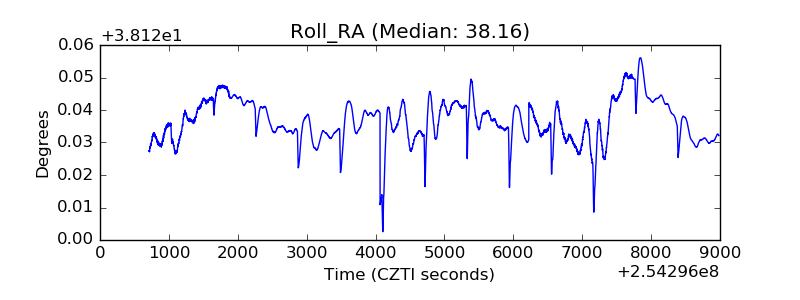 |
| Veto Counter | 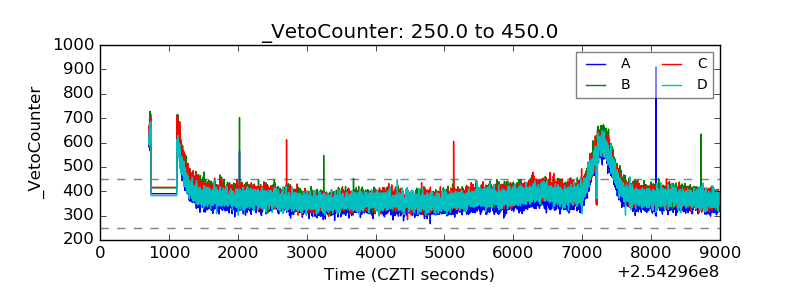 |