| Param | Original file | Final file |
|---|---|---|
| Filename | modeM0/AS1A04_130T01_9000001856_12540cztM0_level2.evt | modeM0/AS1A04_130T01_9000001856_12540cztM0_level2_quad_clean.evt |
| Size (bytes) | 614,540,160 | 87,664,320 |
| Size | 586.1 MB | 83.6 MB |
| Events in quadrant A | 4,145,304 | 535,739 |
| Events in quadrant B | 6,177,896 | 516,314 |
| Events in quadrant C | 3,653,890 | 538,784 |
| Events in quadrant D | 4,100,474 | 516,828 |
| Mode M9 | |||
|---|---|---|---|
| Quadrant | BADHDUFLAG | Total packets | Discarded packets |
| A | 0 | 3 | 0 |
| B | 0 | 3 | 0 |
| C | 0 | 3 | 0 |
| D | 0 | 3 | 0 |
| Mode M0 | |||
|---|---|---|---|
| Quadrant | BADHDUFLAG | Total packets | Discarded packets |
| A | 0 | 17185 | 3 |
| B | 0 | 23557 | 2 |
| C | 0 | 16272 | 2 |
| D | 0 | 17505 | 2 |
| Mode SS | |||
|---|---|---|---|
| Quadrant | BADHDUFLAG | Total packets | Discarded packets |
| A | 0 | 158 | 0 |
| B | 0 | 158 | 0 |
| C | 0 | 158 | 0 |
| D | 0 | 158 | 0 |
| Quadrant | Total seconds | Saturated seconds | Saturation percentage |
|---|---|---|---|
| A | 7869 | 280 | 3.558267% |
| B | 7869 | 1329 | 16.889058% |
| C | 7869 | 125 | 1.588512% |
| D | 7869 | 237 | 3.011819% |
Noise dominated data is calculated using 1-second bins in cleaned event files. If a bin has >2000 counts, and if more than 50% of those come from <1% of pixels, then it is considered to be noise-dominated and hence unusable.
| Quadrant | # 1 sec bins | Bins with >0 counts | Bins with >2000 counts | High rate bins dominated by noise | Noise dominated (total time) | Noise dominated (detector-on time) | Marked lightcurve |
|---|---|---|---|---|---|---|---|
| A | 8080 | 7871 | 0 | 0 | 0.00% | 0.00% | 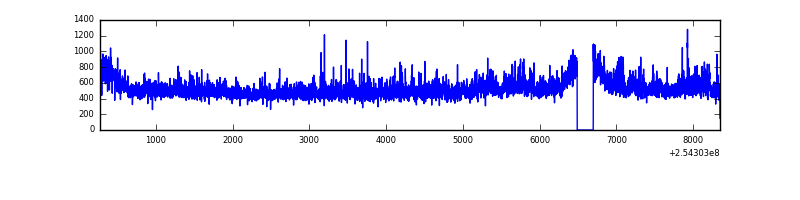 |
| B | 8080 | 7870 | 885 | 885 | 10.95% | 11.25% | 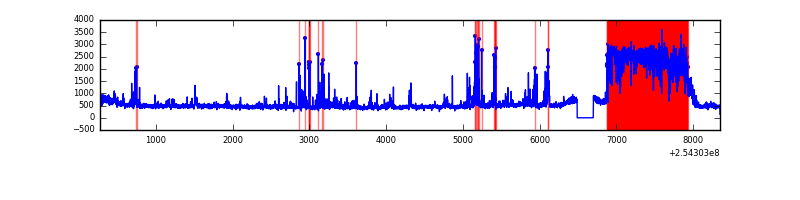 |
| C | 8080 | 7871 | 0 | 0 | 0.00% | 0.00% | 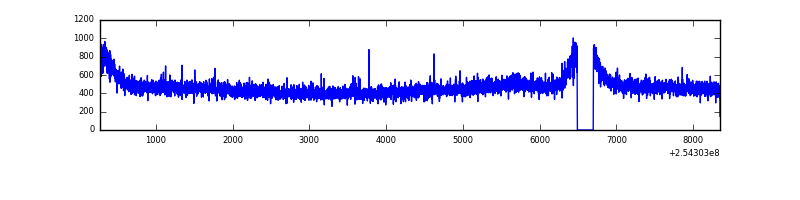 |
| D | 8080 | 7871 | 80 | 80 | 0.99% | 1.02% | 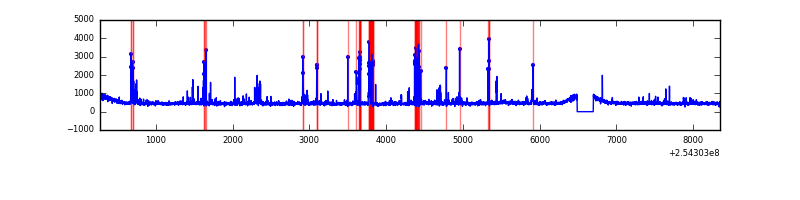 |
Top three noisy pixels from each quadrant. If the there are fewer than three noisy pixels in the level2.evt file, extra rows are filled as -1
| Pixel properties | Quadrant properties | ||||||
|---|---|---|---|---|---|---|---|
| Quadrant | DetID | PixID | Counts | Sigma | Mean | Median | Sigma |
| A | 1 | 162 | 148842 | 754.91 | 953 | 929 | 195.9 |
| A | 8 | 15 | 91914 | 464.37 | 953 | 929 | 195.9 |
| A | 1 | 178 | 86475 | 436.61 | 953 | 929 | 195.9 |
| B | 3 | 64 | 2287258 | 13161.62 | 895 | 870 | 173.7 |
| B | 4 | 239 | 286033 | 1641.54 | 895 | 870 | 173.7 |
| B | 0 | 205 | 29370 | 164.06 | 895 | 870 | 173.7 |
| C | 13 | 61 | 6878 | 27.2 | 934 | 937 | 218.4 |
| C | 8 | 128 | 5380 | 20.34 | 934 | 937 | 218.4 |
| C | 14 | 234 | 2652 | 7.85 | 934 | 937 | 218.4 |
| D | 1 | 52 | 208138 | 930.71 | 926 | 894 | 222.7 |
| D | 10 | 157 | 151164 | 674.84 | 926 | 894 | 222.7 |
| D | 13 | 249 | 88155 | 391.88 | 926 | 894 | 222.7 |
Histogram calculated using DETX and DETY for each event in the final _common_clean file
| Quadrant A | 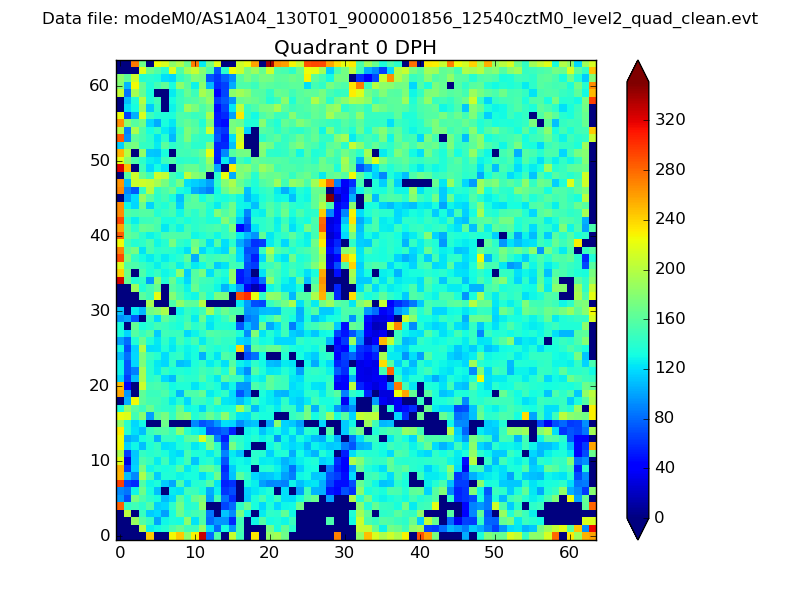 |
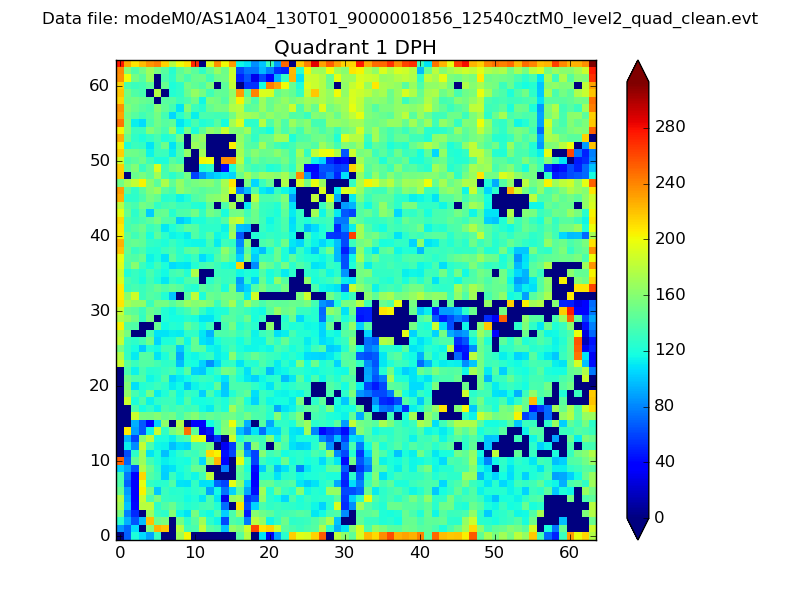 |
Quadrant B |
|---|---|---|---|
| Quadrant D |  |
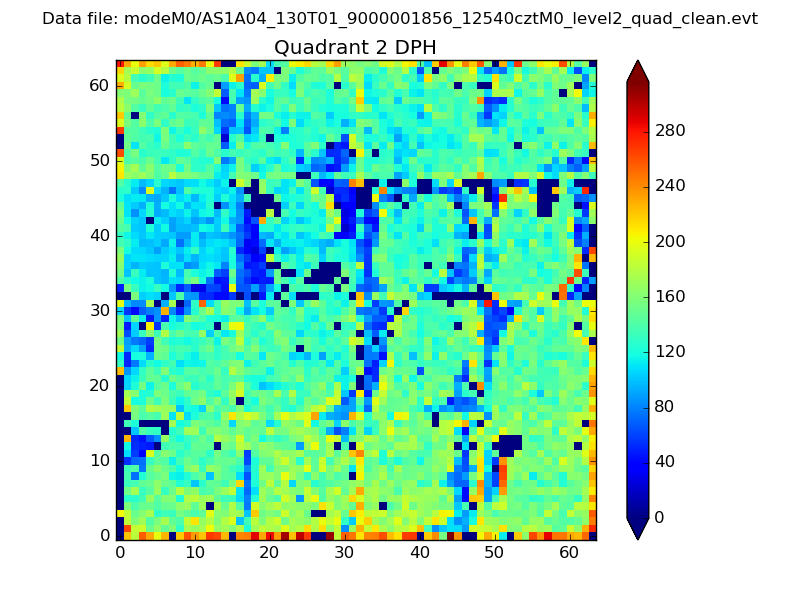 |
Quadrant C |
| Plot type | Count rate plots | Images |
|---|---|---|
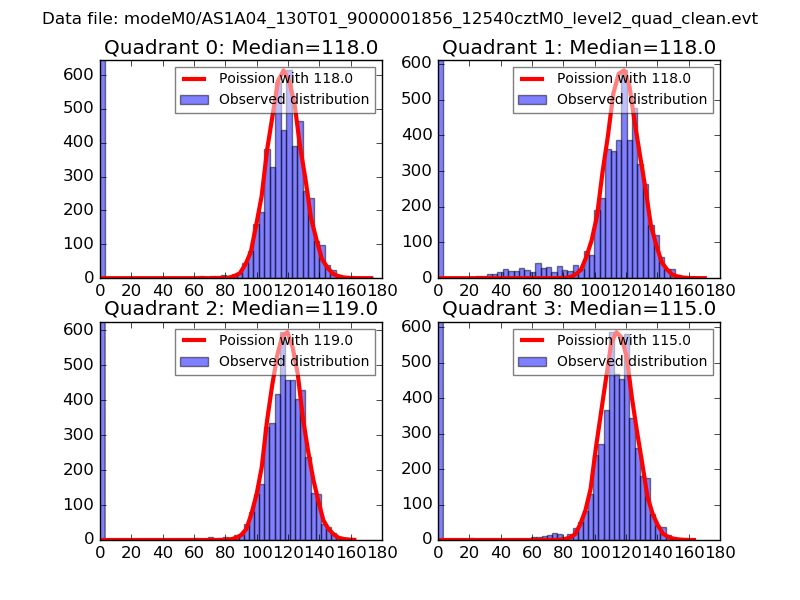
| Comparison with Poisson distribution Blue bars denote a histogram of data divided into 1 sec bins. Red curve is a Poisson curve with rate = median count rate of data. |
 |
 |
| Quadrant-wise count rates Data is divided into 100 sec bins |
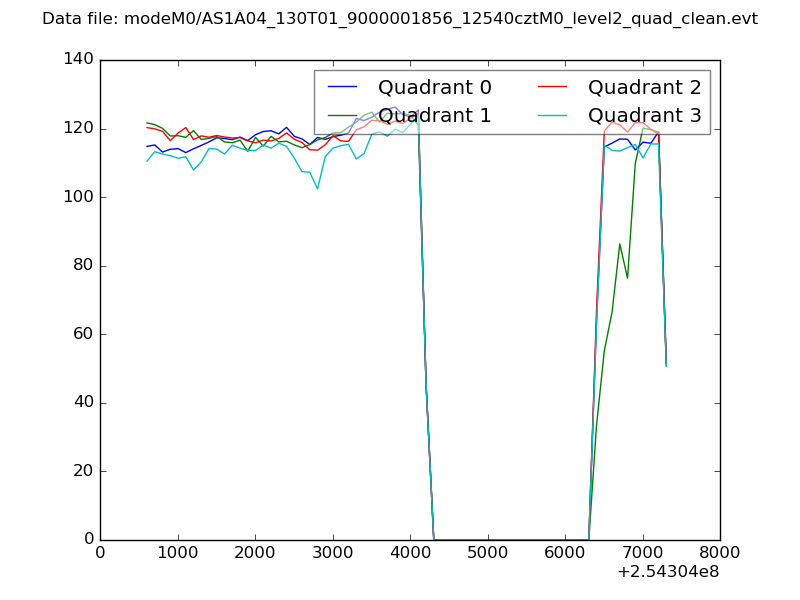 |
|
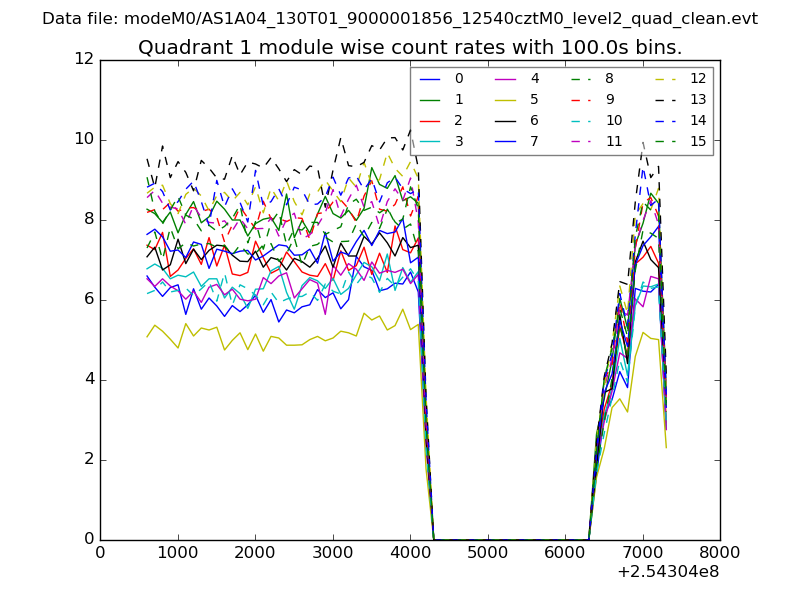
| Module-wise count rates for Quadrant A Data is divided into 100 sec bins |
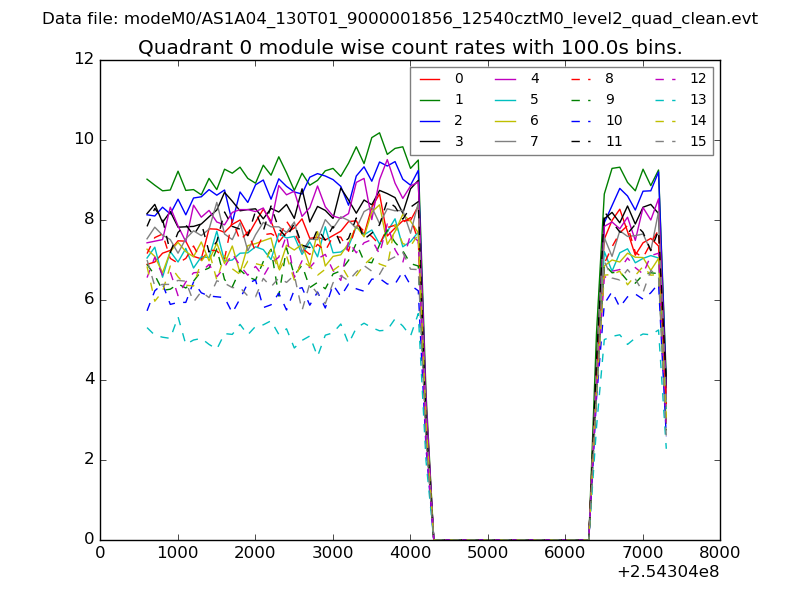 |
 |
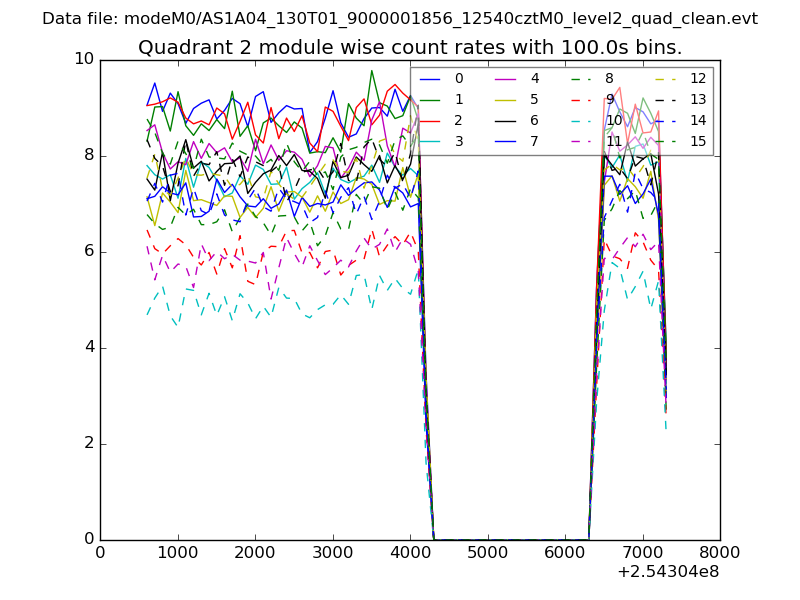
| Module-wise count rates for Quadrant B Data is divided into 100 sec bins |
 |
 |
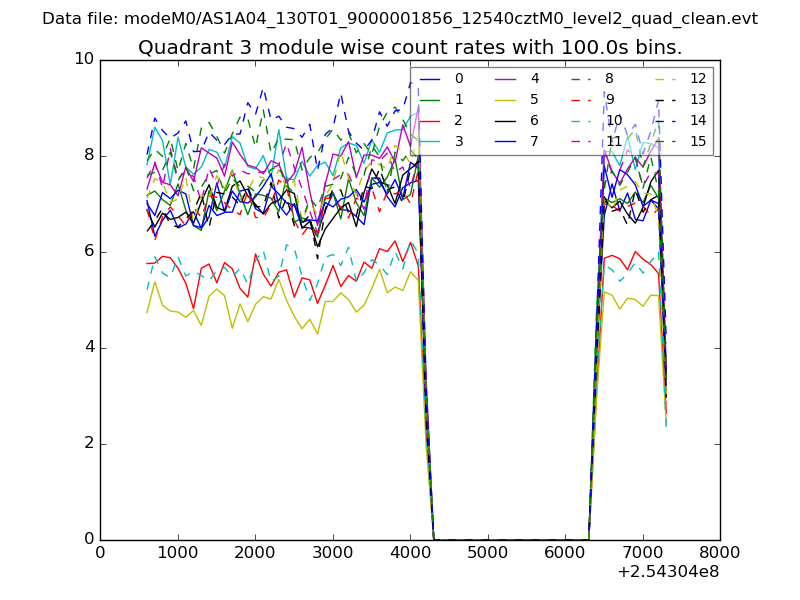
| Module-wise count rates for Quadrant C Data is divided into 100 sec bins |
 |
 |
| Module-wise count rates for Quadrant D Data is divided into 100 sec bins |
 |
 |
| Parameter | Plot |
|---|---|
| CZT HV Monitor | 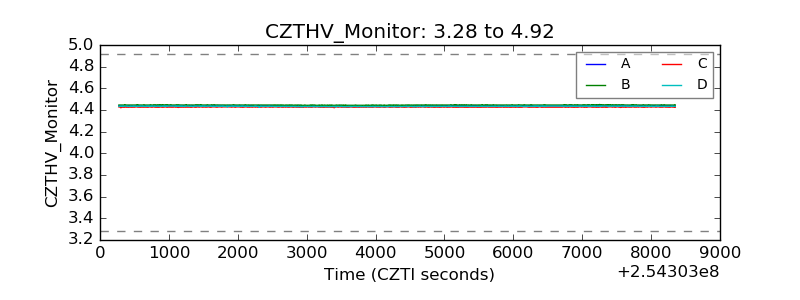 |
| D_VDD | 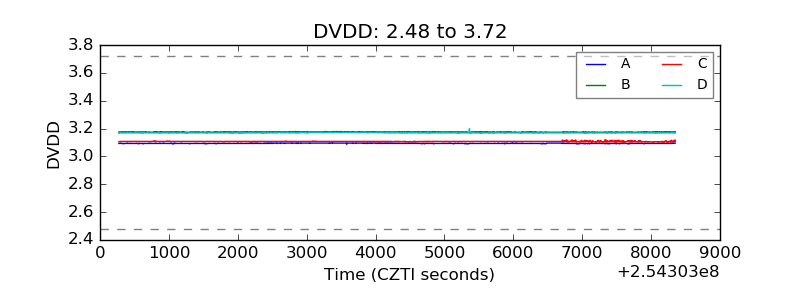 |
| Temperature 1 | 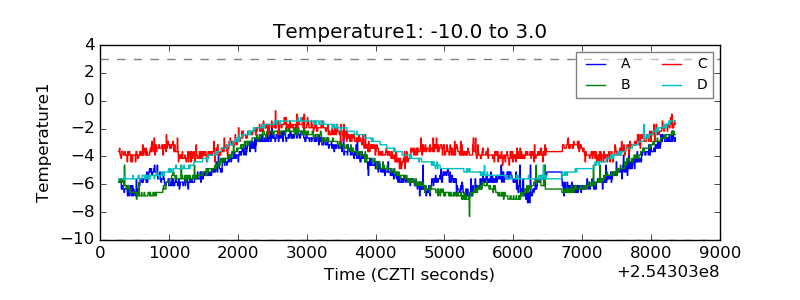 |
| Veto HV Monitor | 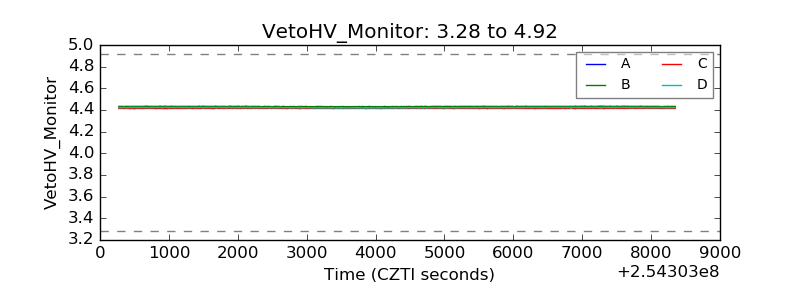 |
| Veto LLD | 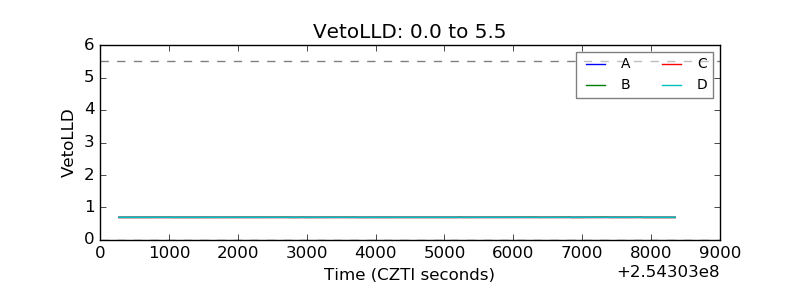 |
| Alpha Counter | 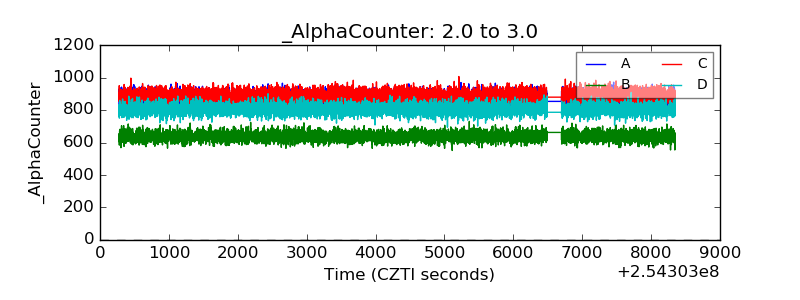 |
| _CPM_Rate | 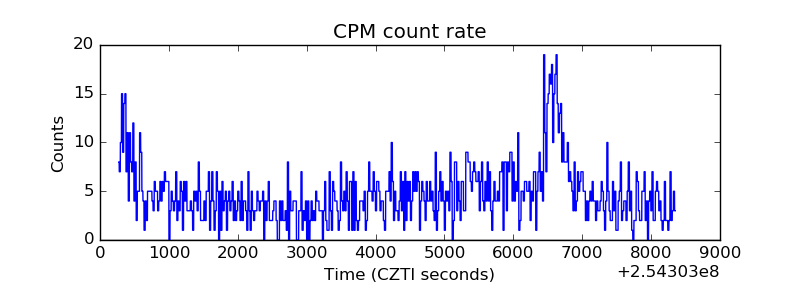 |
| CZT Counter | 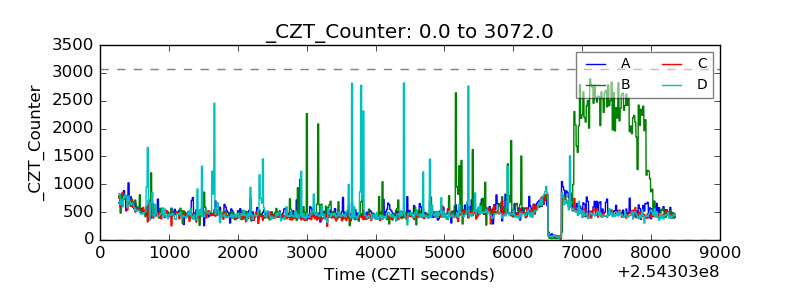 |
| +2.5 Volts monitor |  |
| +5 Volts monitor |  |
| _ROLL_ROT | 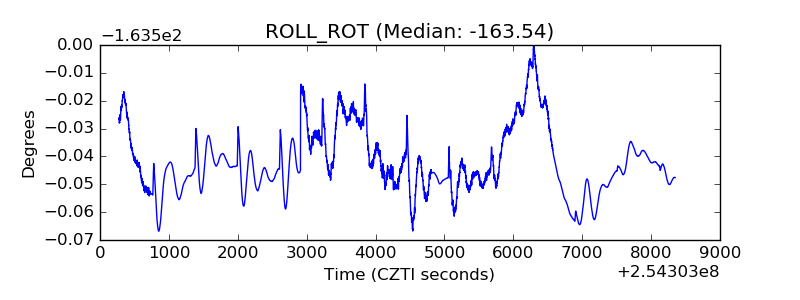 |
| _Roll_DEC | 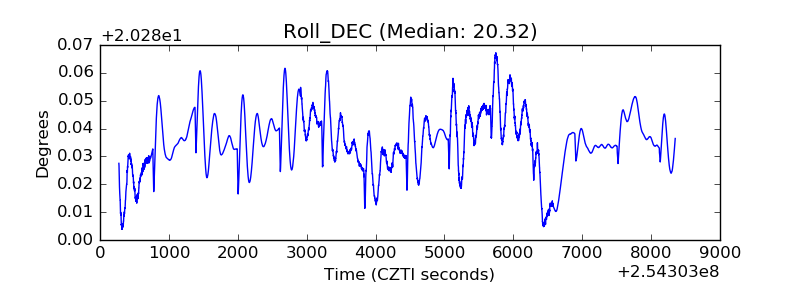 |
| _Roll_RA | 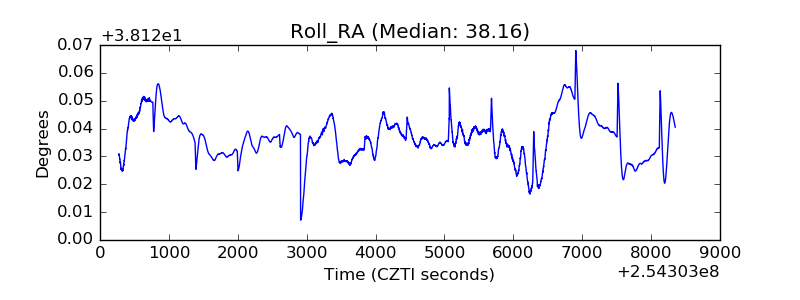 |
| Veto Counter | 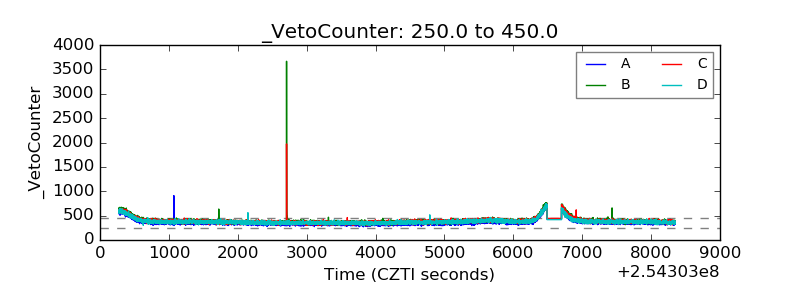 |