| Param | Original file | Final file |
|---|---|---|
| Filename | modeM0/AS1A04_130T01_9000001856_12542cztM0_level2.evt | modeM0/AS1A04_130T01_9000001856_12542cztM0_level2_quad_clean.evt |
| Size (bytes) | 889,352,640 | 161,167,680 |
| Size | 848.2 MB | 153.7 MB |
| Events in quadrant A | 6,908,549 | 1,019,475 |
| Events in quadrant B | 7,630,223 | 1,001,933 |
| Events in quadrant C | 5,491,402 | 1,025,139 |
| Events in quadrant D | 6,078,872 | 991,616 |
| Mode M9 | |||
|---|---|---|---|
| Quadrant | BADHDUFLAG | Total packets | Discarded packets |
| A | 0 | 10 | 0 |
| B | 0 | 10 | 0 |
| C | 0 | 10 | 0 |
| D | 0 | 10 | 0 |
| Mode M0 | |||
|---|---|---|---|
| Quadrant | BADHDUFLAG | Total packets | Discarded packets |
| A | 0 | 28232 | 3 |
| B | 0 | 30535 | 2 |
| C | 0 | 24812 | 2 |
| D | 0 | 26413 | 2 |
| Mode SS | |||
|---|---|---|---|
| Quadrant | BADHDUFLAG | Total packets | Discarded packets |
| A | 0 | 248 | 0 |
| B | 0 | 248 | 0 |
| C | 0 | 248 | 0 |
| D | 0 | 248 | 0 |
| Quadrant | Total seconds | Saturated seconds | Saturation percentage |
|---|---|---|---|
| A | 12189 | 243 | 1.993601% |
| B | 12189 | 701 | 5.751087% |
| C | 12189 | 88 | 0.721962% |
| D | 12189 | 155 | 1.271638% |
Noise dominated data is calculated using 1-second bins in cleaned event files. If a bin has >2000 counts, and if more than 50% of those come from <1% of pixels, then it is considered to be noise-dominated and hence unusable.
| Quadrant | # 1 sec bins | Bins with >0 counts | Bins with >2000 counts | High rate bins dominated by noise | Noise dominated (total time) | Noise dominated (detector-on time) | Marked lightcurve |
|---|---|---|---|---|---|---|---|
| A | 13265 | 12191 | 56 | 56 | 0.42% | 0.46% | 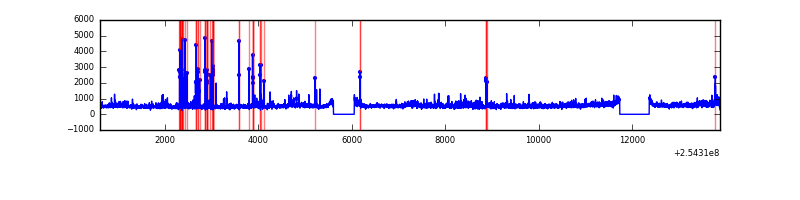 |
| B | 13265 | 12191 | 426 | 426 | 3.21% | 3.49% | 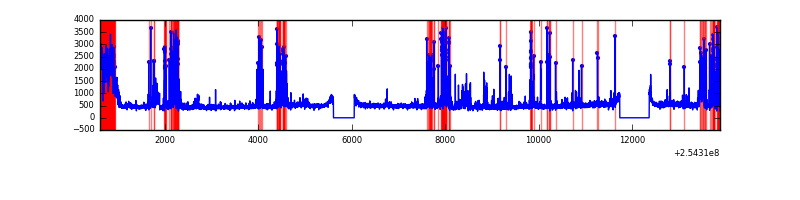 |
| C | 13265 | 12191 | 0 | 0 | 0.00% | 0.00% | 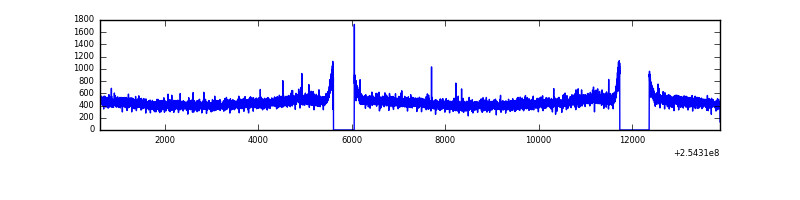 |
| D | 13265 | 12190 | 42 | 42 | 0.32% | 0.34% | 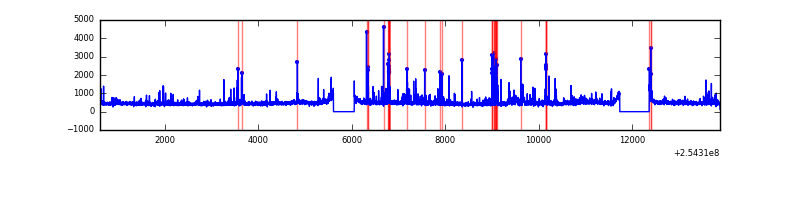 |
Top three noisy pixels from each quadrant. If the there are fewer than three noisy pixels in the level2.evt file, extra rows are filled as -1
| Pixel properties | Quadrant properties | ||||||
|---|---|---|---|---|---|---|---|
| Quadrant | DetID | PixID | Counts | Sigma | Mean | Median | Sigma |
| A | 8 | 15 | 522577 | 1768.8 | 1439 | 1406 | 294.6 |
| A | 1 | 162 | 261210 | 881.75 | 1439 | 1406 | 294.6 |
| A | 1 | 178 | 159691 | 537.2 | 1439 | 1406 | 294.6 |
| B | 4 | 239 | 985438 | 3622.17 | 1415 | 1378 | 271.7 |
| B | 3 | 64 | 673410 | 2473.64 | 1415 | 1378 | 271.7 |
| B | 15 | 222 | 146248 | 533.24 | 1415 | 1378 | 271.7 |
| C | 3 | 233 | 14086 | 39.06 | 1400 | 1405 | 324.6 |
| C | 8 | 128 | 10950 | 29.4 | 1400 | 1405 | 324.6 |
| C | 13 | 61 | 10060 | 26.66 | 1400 | 1405 | 324.6 |
| D | 1 | 52 | 332497 | 987.26 | 1400 | 1360 | 335.4 |
| D | 8 | 195 | 102737 | 302.25 | 1400 | 1360 | 335.4 |
| D | 13 | 104 | 97438 | 286.45 | 1400 | 1360 | 335.4 |
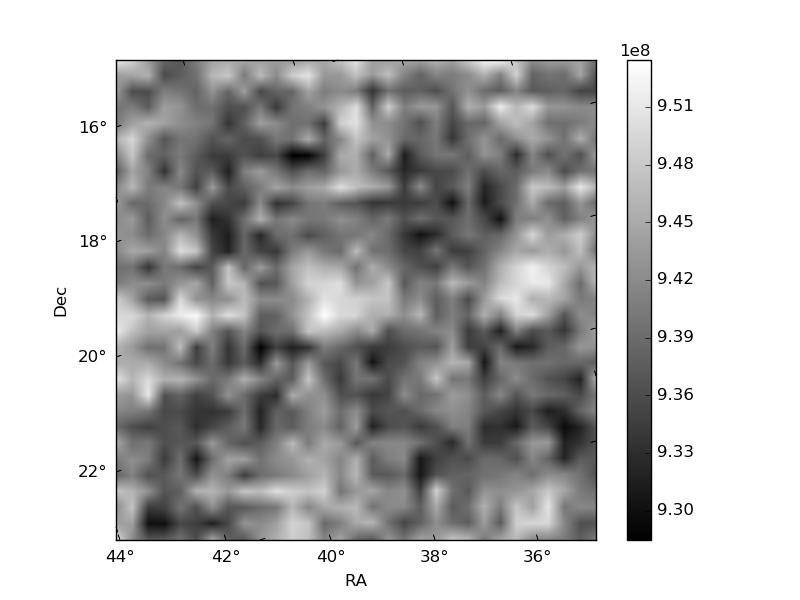
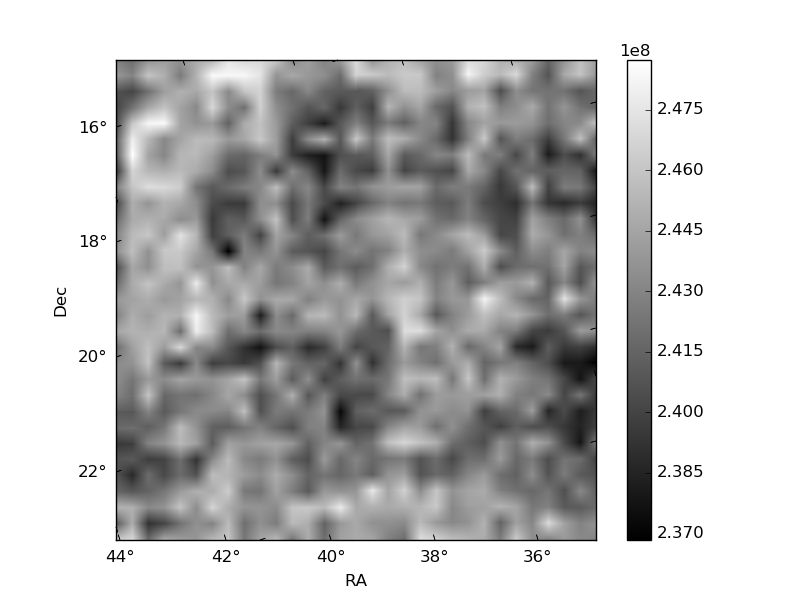
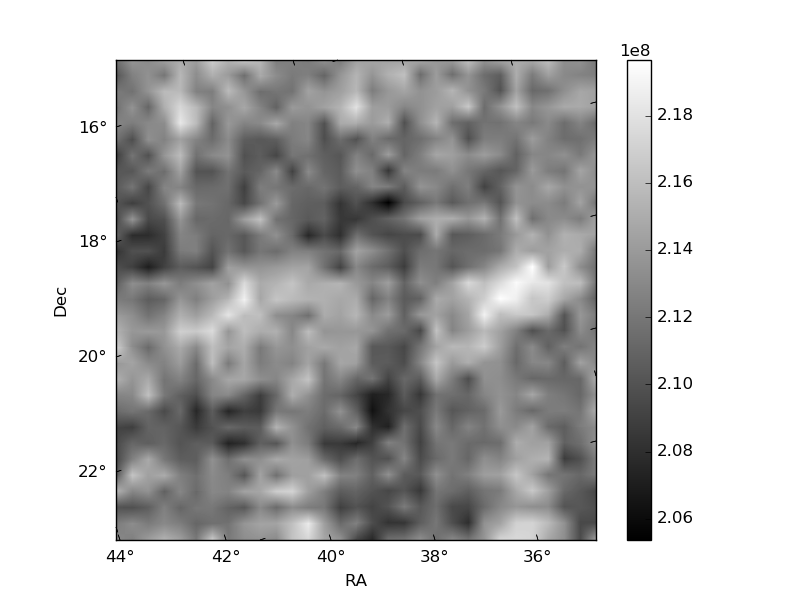
Histogram calculated using DETX and DETY for each event in the final _common_clean file
| Quadrant A | 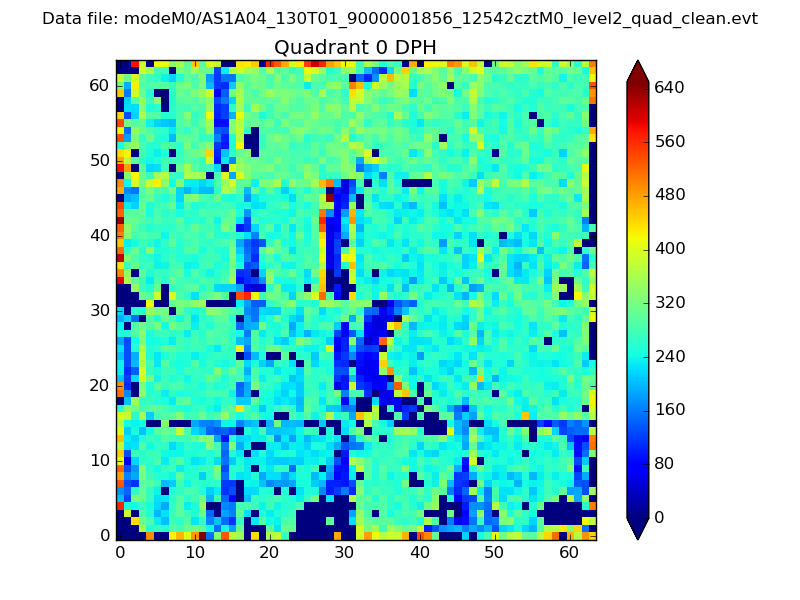 |
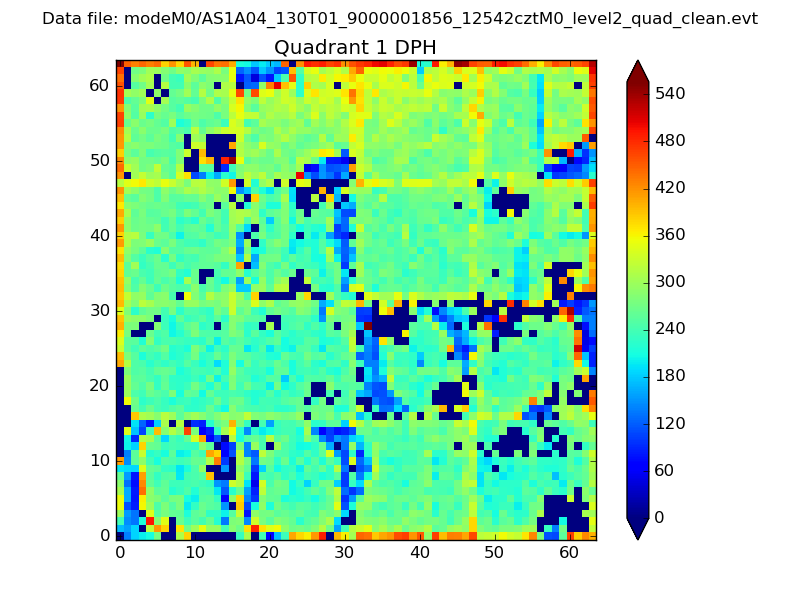 |
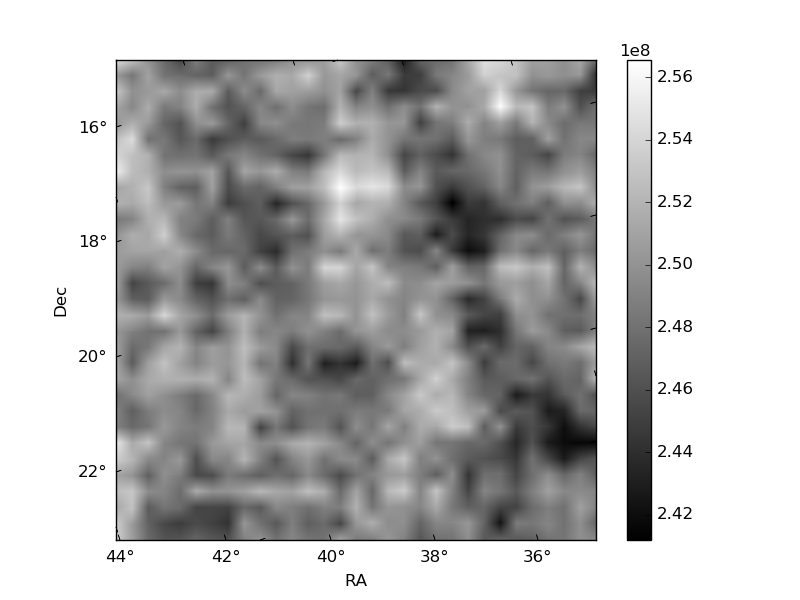
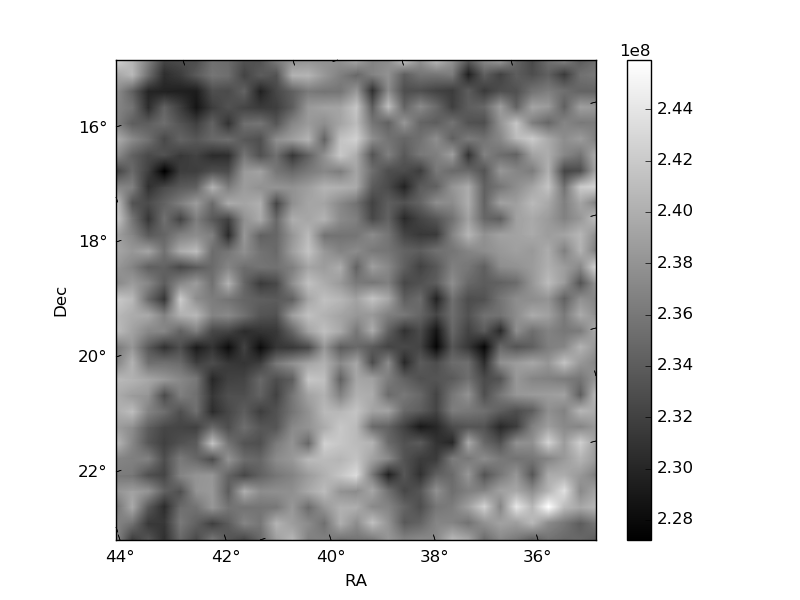
Quadrant B |
|---|---|---|---|
| Quadrant D | 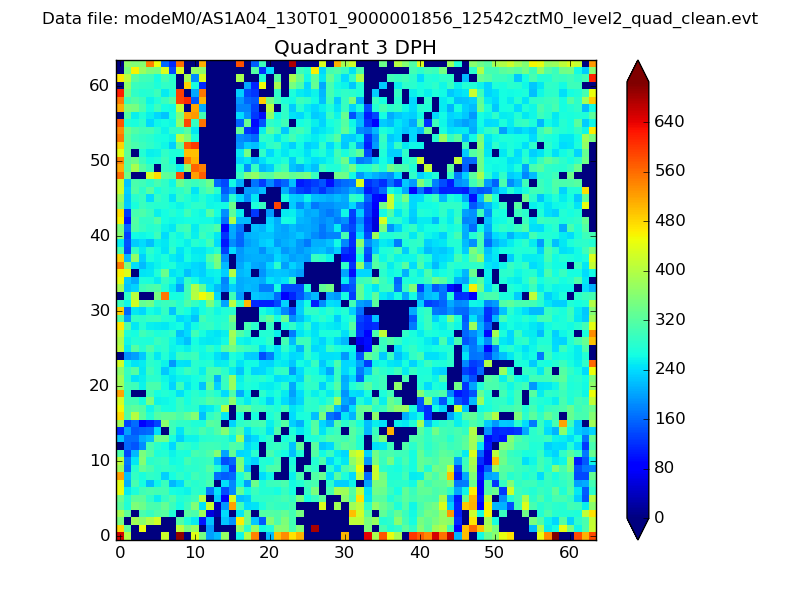 |
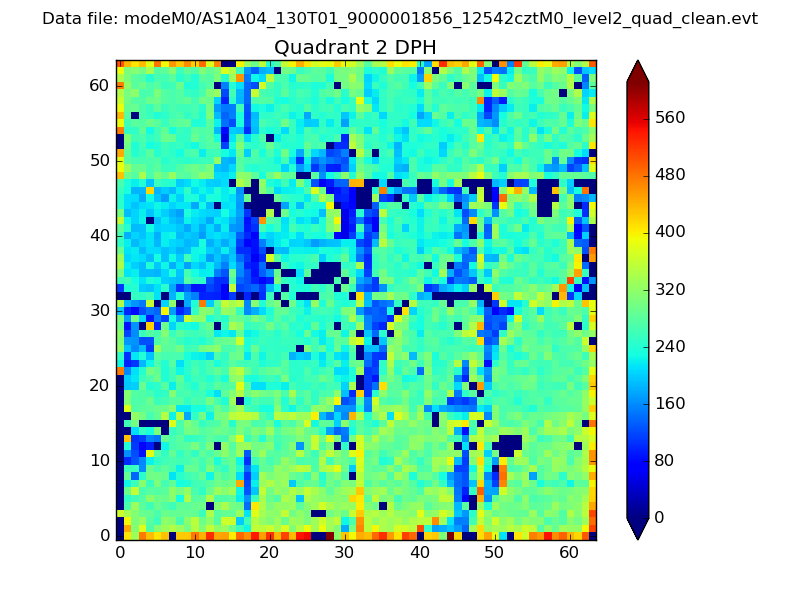 |
Quadrant C |
| Plot type | Count rate plots | Images |
|---|---|---|
| Comparison with Poisson distribution Blue bars denote a histogram of data divided into 1 sec bins. Red curve is a Poisson curve with rate = median count rate of data. |
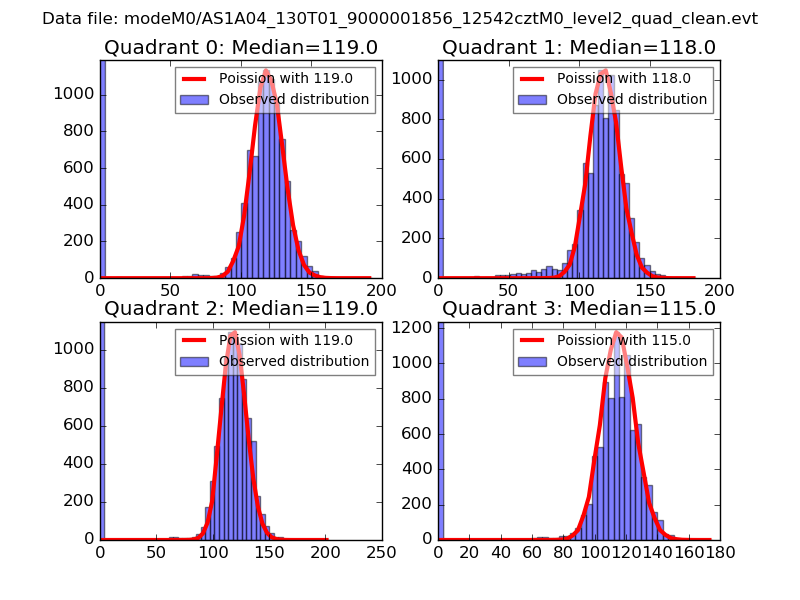 |
 |
| Quadrant-wise count rates Data is divided into 100 sec bins |
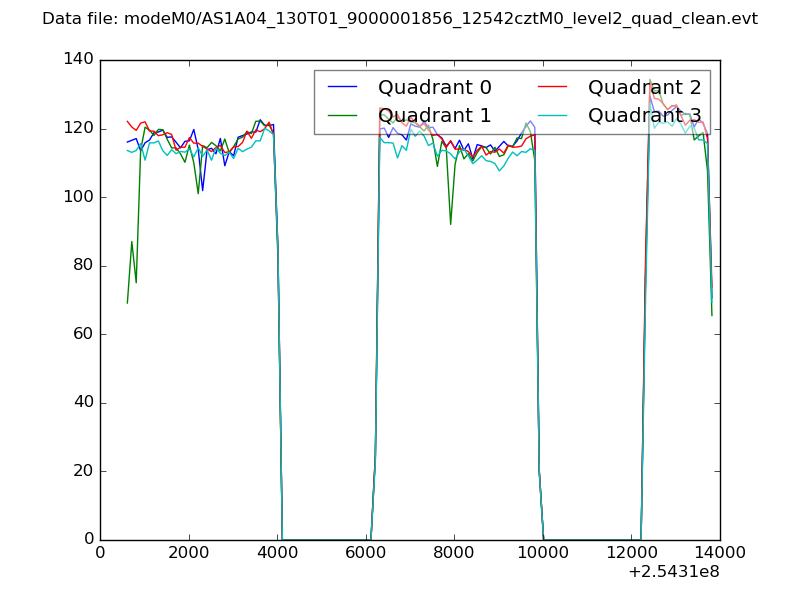 |
|
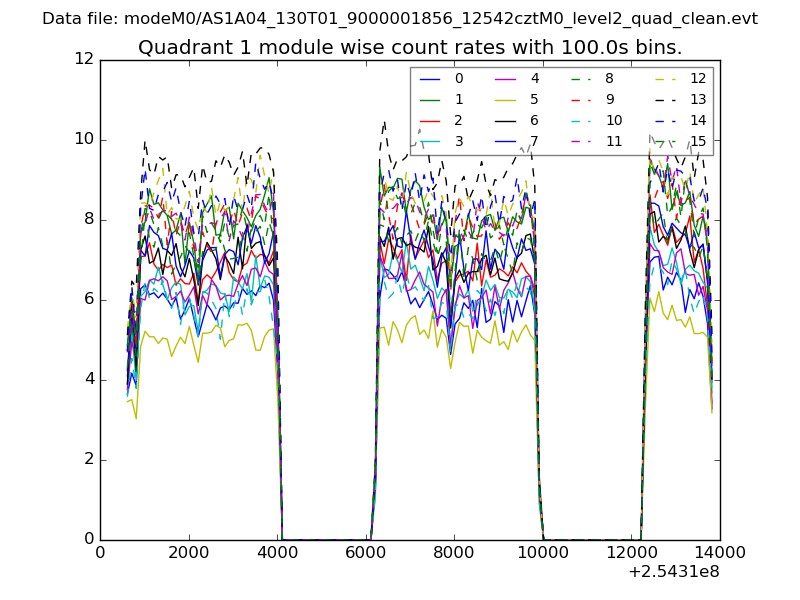
| Module-wise count rates for Quadrant A Data is divided into 100 sec bins |
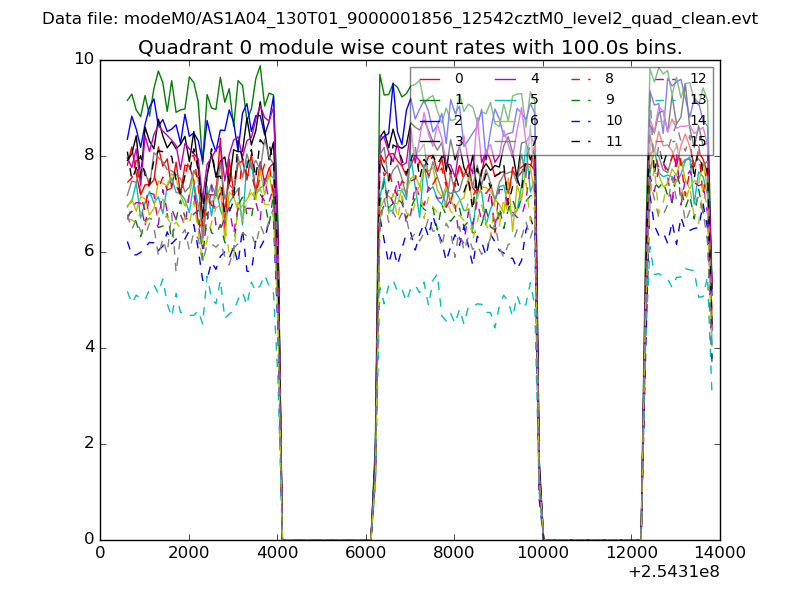 |
 |
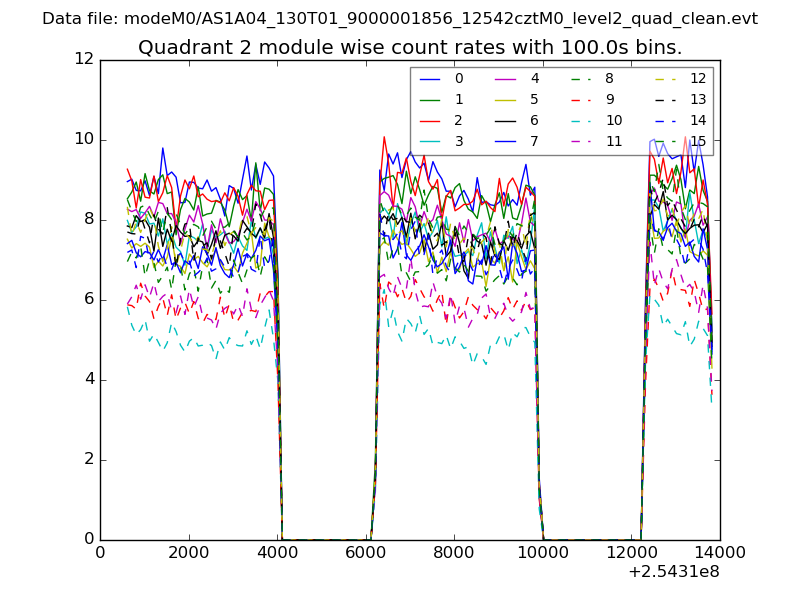
| Module-wise count rates for Quadrant B Data is divided into 100 sec bins |
 |
 |
| Module-wise count rates for Quadrant C Data is divided into 100 sec bins |
 |
 |
| Module-wise count rates for Quadrant D Data is divided into 100 sec bins |
 |
 |
| Parameter | Plot |
|---|---|
| CZT HV Monitor | 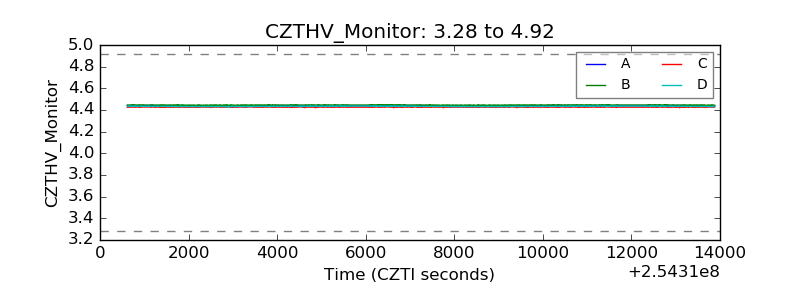 |
| D_VDD | 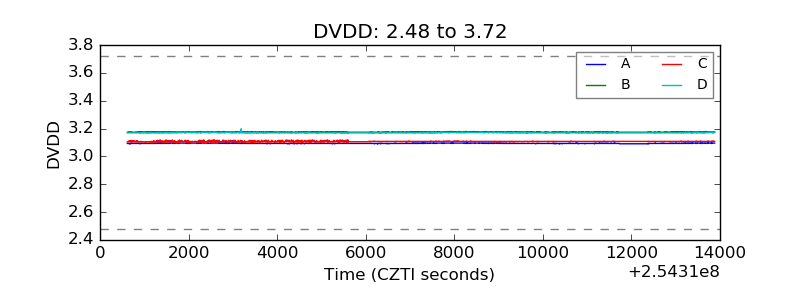 |
| Temperature 1 | 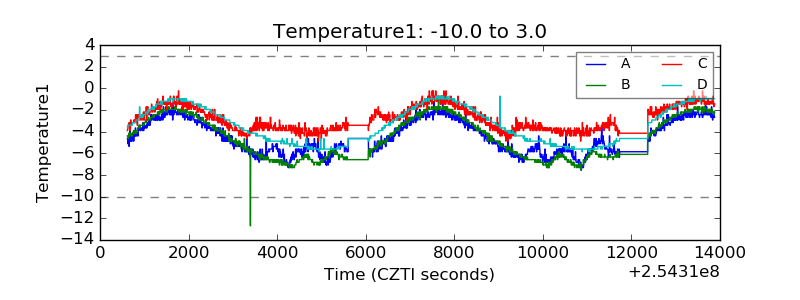 |
| Veto HV Monitor | 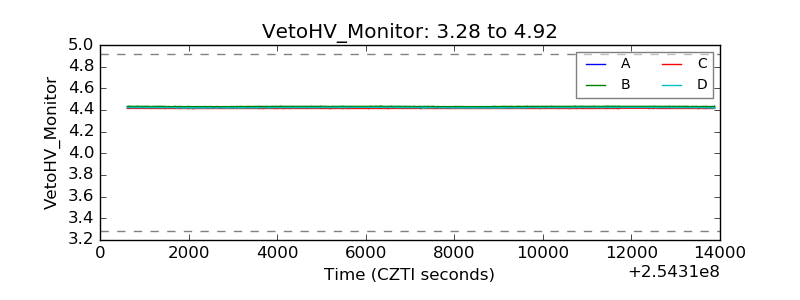 |
| Veto LLD | 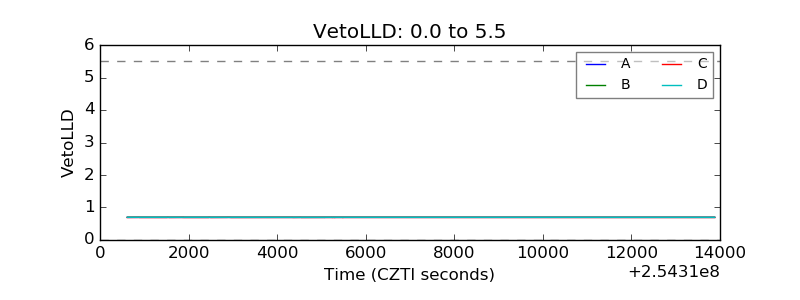 |
| Alpha Counter | 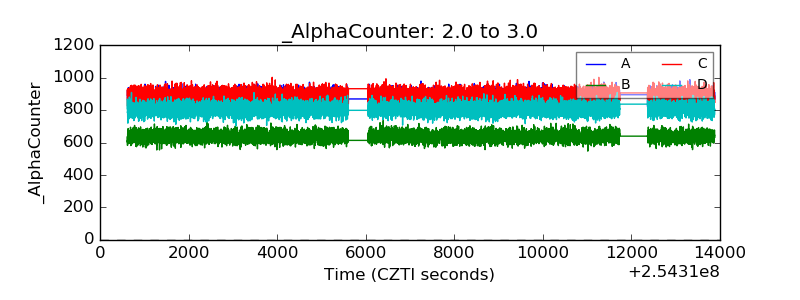 |
| _CPM_Rate | 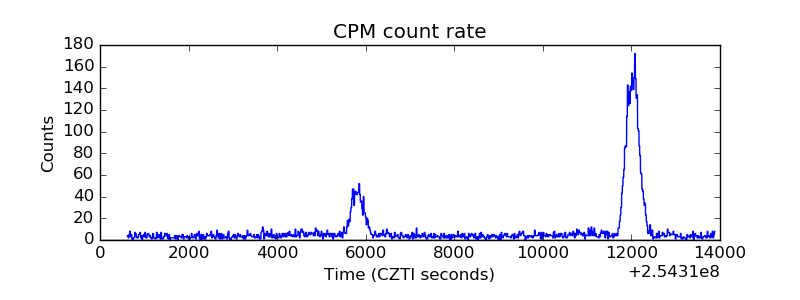 |
| CZT Counter | 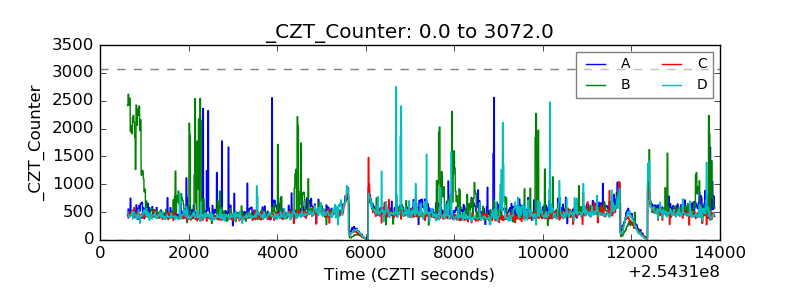 |
| +2.5 Volts monitor |  |
| +5 Volts monitor |  |
| _ROLL_ROT |  |
| _Roll_DEC | 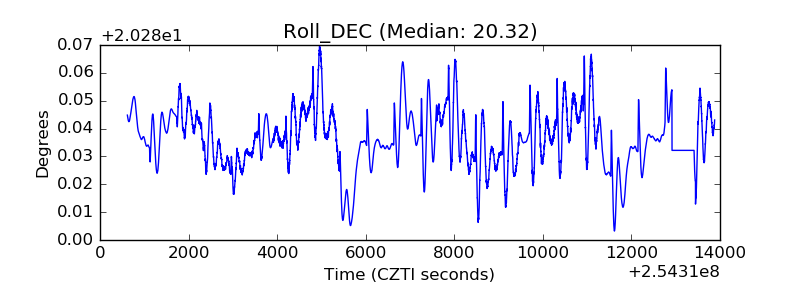 |
| _Roll_RA |  |
| Veto Counter | 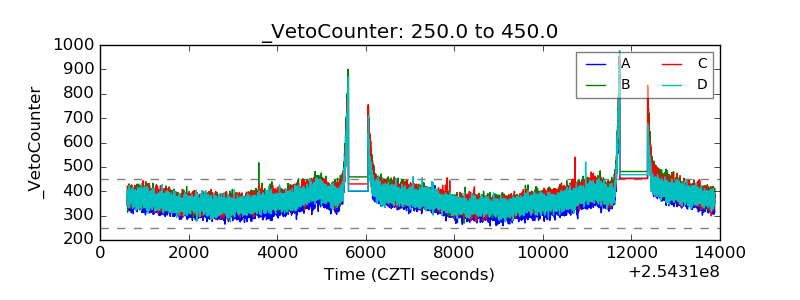 |