| Param | Original file | Final file |
|---|---|---|
| Filename | modeM0/AS1A04_130T01_9000001856_12544cztM0_level2.evt | modeM0/AS1A04_130T01_9000001856_12544cztM0_level2_quad_clean.evt |
| Size (bytes) | 498,467,520 | 88,813,440 |
| Size | 475.4 MB | 84.7 MB |
| Events in quadrant A | 3,743,113 | 562,357 |
| Events in quadrant B | 3,747,949 | 561,018 |
| Events in quadrant C | 3,021,966 | 561,890 |
| Events in quadrant D | 4,130,655 | 539,495 |
| Mode M9 | |||
|---|---|---|---|
| Quadrant | BADHDUFLAG | Total packets | Discarded packets |
| A | 0 | 13 | 0 |
| B | 0 | 13 | 0 |
| C | 0 | 13 | 0 |
| D | 0 | 14 | 0 |
| Mode M0 | |||
|---|---|---|---|
| Quadrant | BADHDUFLAG | Total packets | Discarded packets |
| A | 0 | 15444 | 3 |
| B | 0 | 15523 | 2 |
| C | 0 | 13624 | 2 |
| D | 0 | 16716 | 2 |
| Mode SS | |||
|---|---|---|---|
| Quadrant | BADHDUFLAG | Total packets | Discarded packets |
| A | 0 | 136 | 0 |
| B | 0 | 136 | 0 |
| C | 0 | 136 | 0 |
| D | 0 | 136 | 0 |
| Quadrant | Total seconds | Saturated seconds | Saturation percentage |
|---|---|---|---|
| A | 6663 | 132 | 1.981090% |
| B | 6663 | 185 | 2.776527% |
| C | 6663 | 27 | 0.405223% |
| D | 6663 | 112 | 1.680925% |
Noise dominated data is calculated using 1-second bins in cleaned event files. If a bin has >2000 counts, and if more than 50% of those come from <1% of pixels, then it is considered to be noise-dominated and hence unusable.
| Quadrant | # 1 sec bins | Bins with >0 counts | Bins with >2000 counts | High rate bins dominated by noise | Noise dominated (total time) | Noise dominated (detector-on time) | Marked lightcurve |
|---|---|---|---|---|---|---|---|
| A | 7679 | 6665 | 60 | 60 | 0.78% | 0.90% | 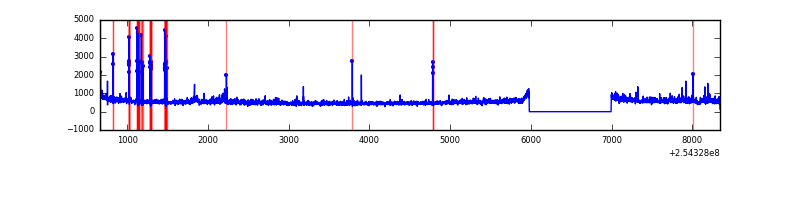 |
| B | 7679 | 6665 | 94 | 94 | 1.22% | 1.41% | 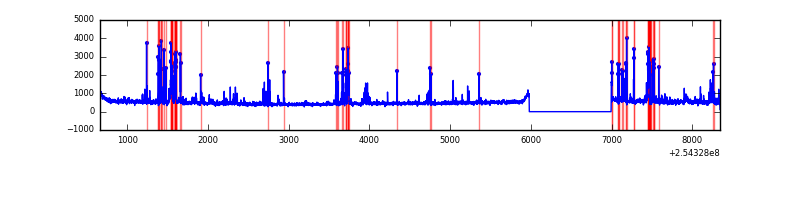 |
| C | 7679 | 6665 | 1 | 1 | 0.01% | 0.02% | 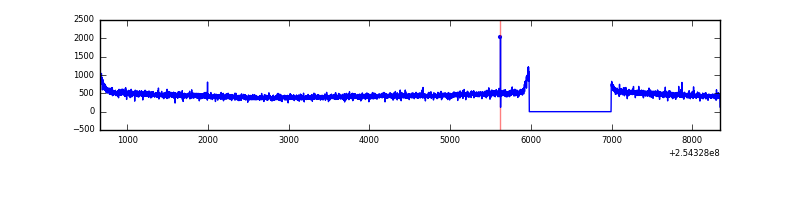 |
| D | 7679 | 6665 | 56 | 56 | 0.73% | 0.84% | 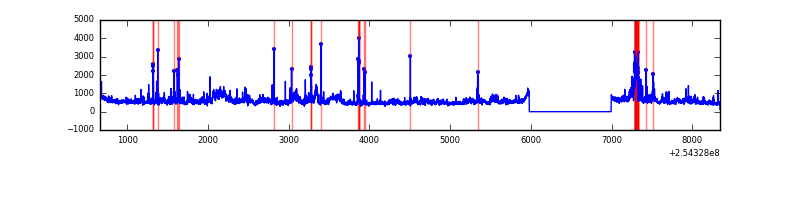 |
Top three noisy pixels from each quadrant. If the there are fewer than three noisy pixels in the level2.evt file, extra rows are filled as -1
| Pixel properties | Quadrant properties | ||||||
|---|---|---|---|---|---|---|---|
| Quadrant | DetID | PixID | Counts | Sigma | Mean | Median | Sigma |
| A | 8 | 15 | 153398 | 945.65 | 793 | 776 | 161.4 |
| A | 0 | 23 | 152059 | 937.35 | 793 | 776 | 161.4 |
| A | 1 | 162 | 145155 | 894.58 | 793 | 776 | 161.4 |
| B | 4 | 239 | 507311 | 3346.77 | 789 | 767 | 151.4 |
| B | 0 | 230 | 59588 | 388.63 | 789 | 767 | 151.4 |
| B | 15 | 222 | 32731 | 211.19 | 789 | 767 | 151.4 |
| C | 13 | 61 | 5705 | 27.33 | 774 | 778 | 180.3 |
| C | 3 | 233 | 1971 | 6.62 | 774 | 778 | 180.3 |
| C | 3 | 202 | 1933 | 6.41 | 774 | 778 | 180.3 |
| D | 1 | 52 | 383361 | 2061.2 | 773 | 751 | 185.6 |
| D | 8 | 195 | 273602 | 1469.91 | 773 | 751 | 185.6 |
| D | 1 | 255 | 234459 | 1259.04 | 773 | 751 | 185.6 |
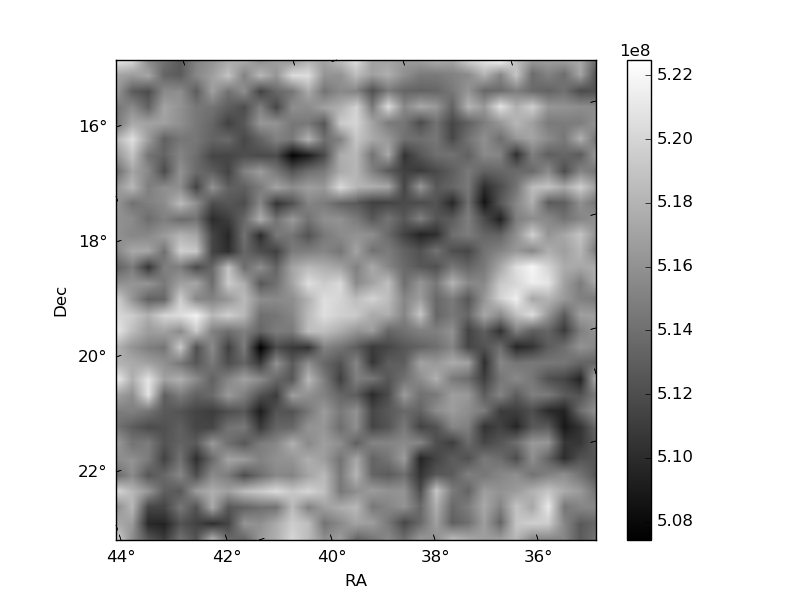
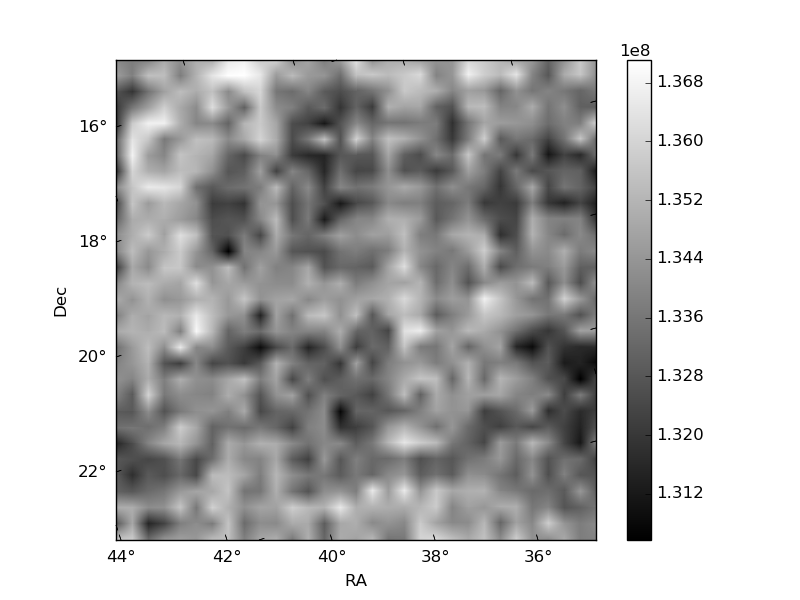
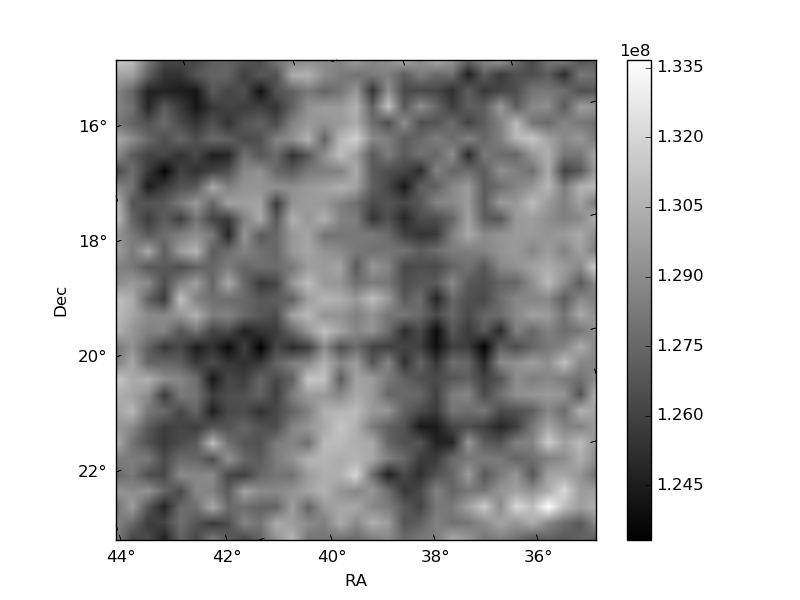
Histogram calculated using DETX and DETY for each event in the final _common_clean file
| Quadrant A | 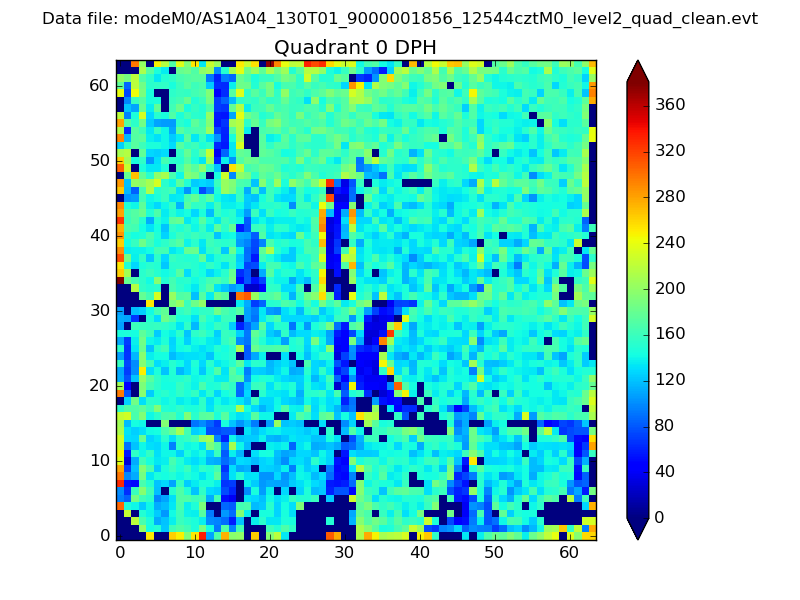 |
 |
Quadrant B |
|---|---|---|---|
| Quadrant D | 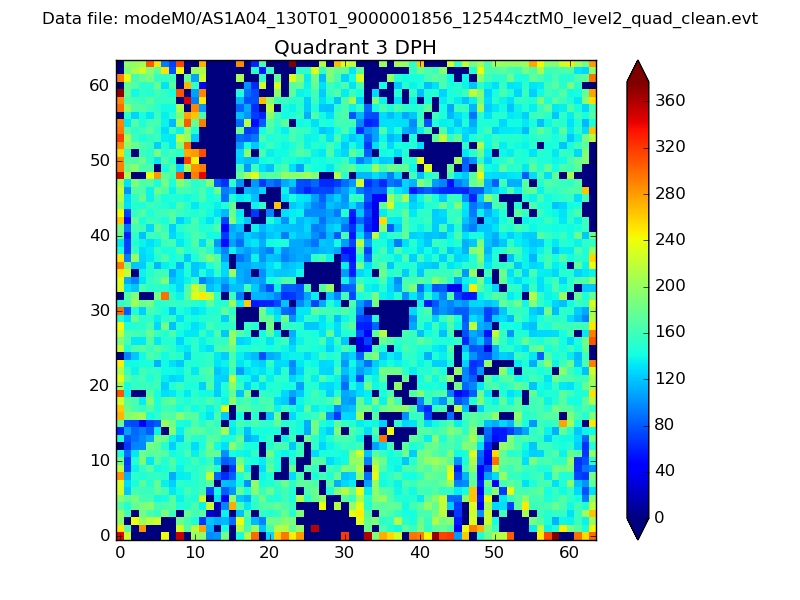 |
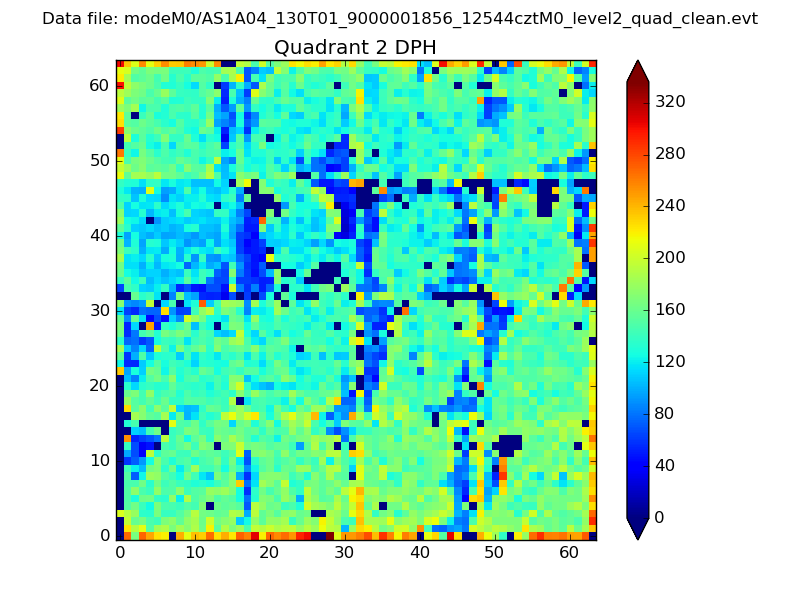 |
Quadrant C |
| Plot type | Count rate plots | Images |
|---|---|---|
| Comparison with Poisson distribution Blue bars denote a histogram of data divided into 1 sec bins. Red curve is a Poisson curve with rate = median count rate of data. |
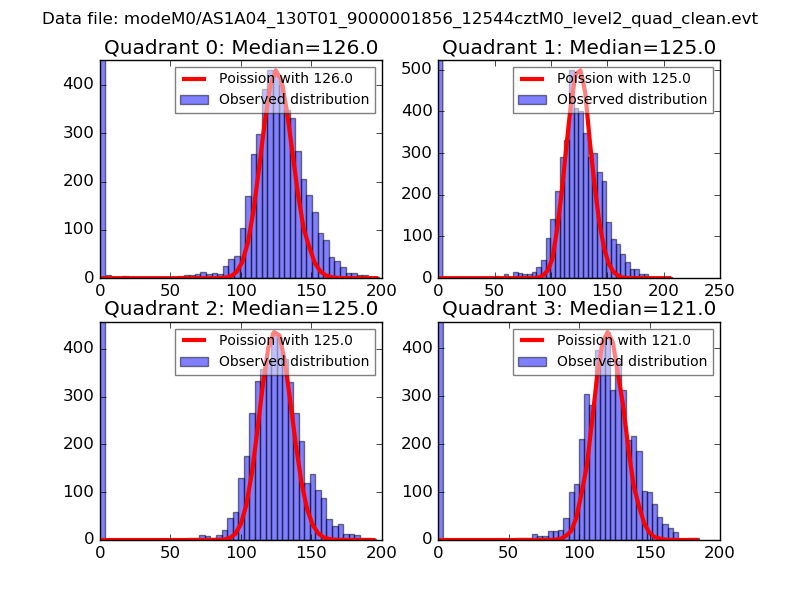 |
 |
| Quadrant-wise count rates Data is divided into 100 sec bins |
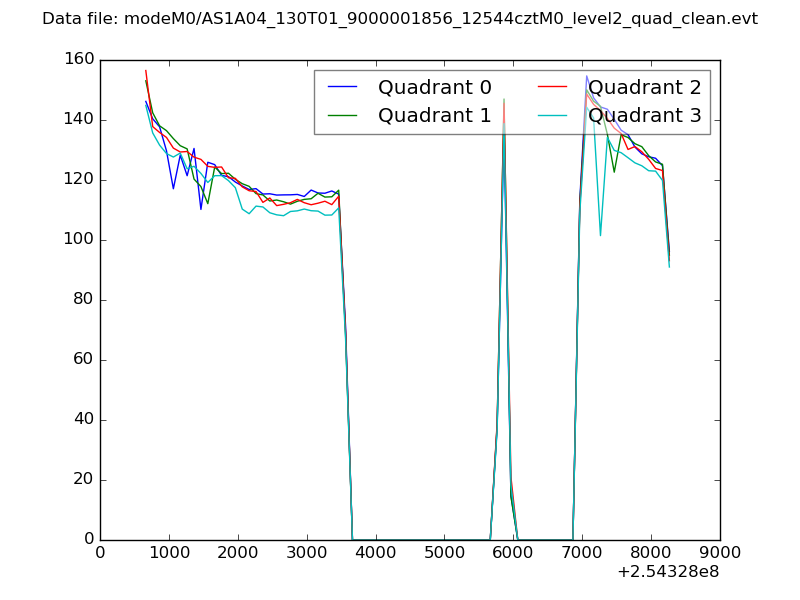 |
|
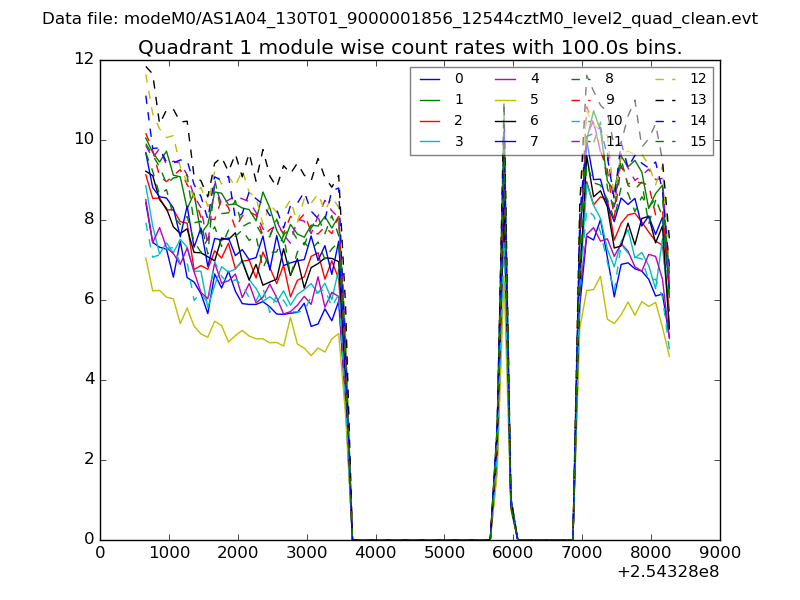
| Module-wise count rates for Quadrant A Data is divided into 100 sec bins |
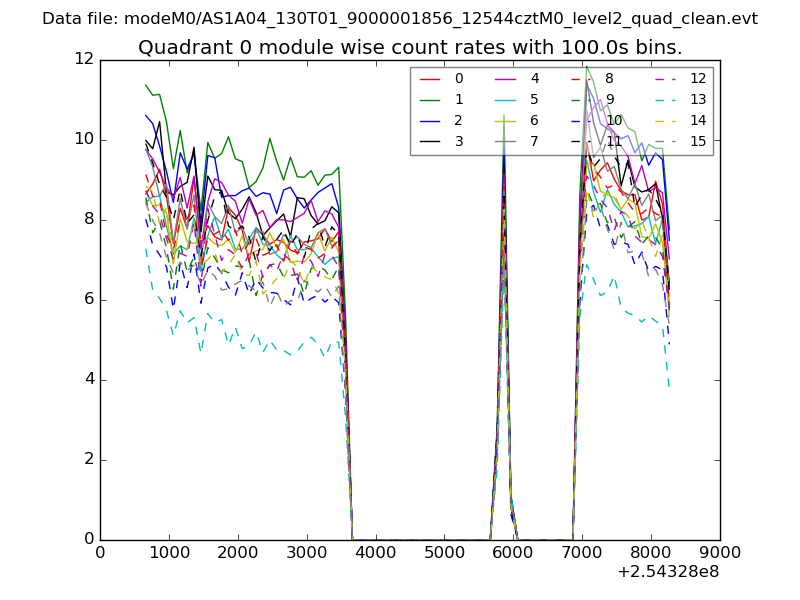 |
 |
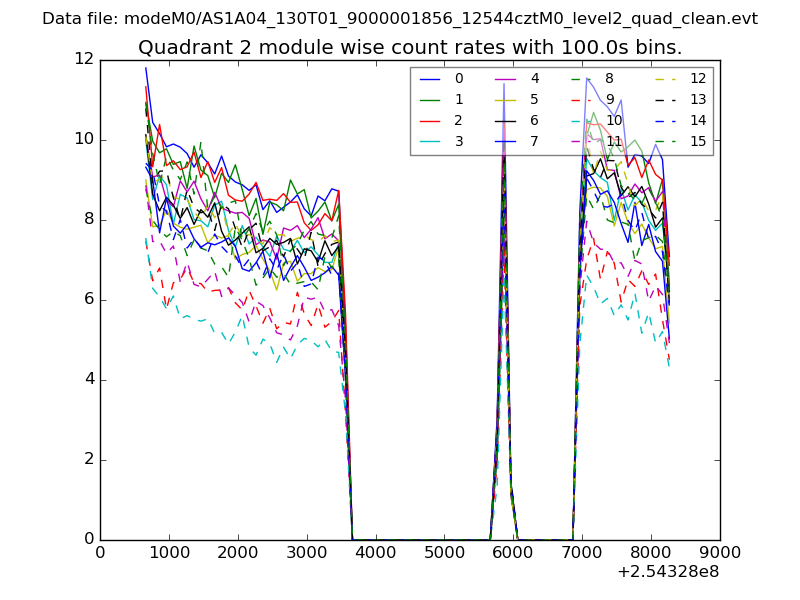
| Module-wise count rates for Quadrant B Data is divided into 100 sec bins |
 |
 |
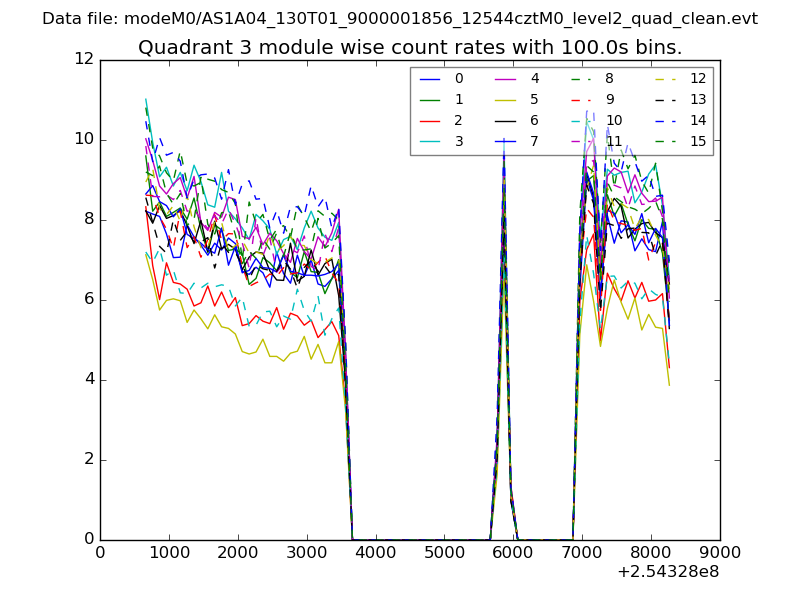
| Module-wise count rates for Quadrant C Data is divided into 100 sec bins |
 |
 |
| Module-wise count rates for Quadrant D Data is divided into 100 sec bins |
 |
 |
| Parameter | Plot |
|---|---|
| CZT HV Monitor | 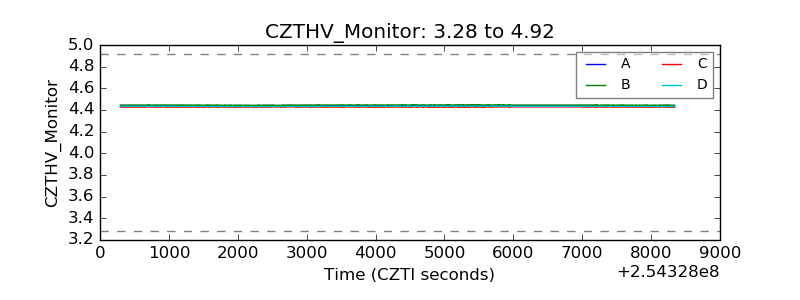 |
| D_VDD |  |
| Temperature 1 | 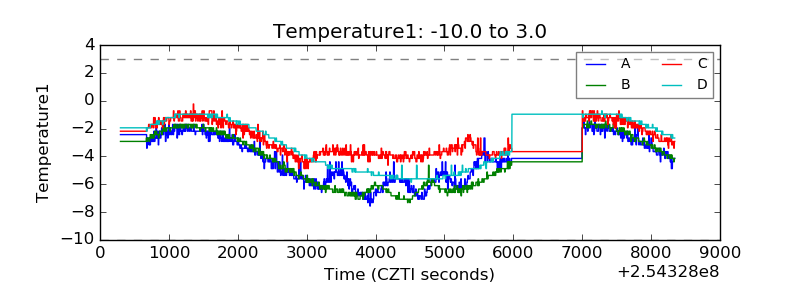 |
| Veto HV Monitor | 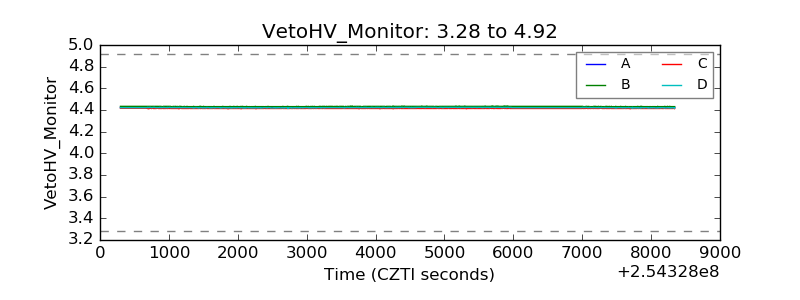 |
| Veto LLD | 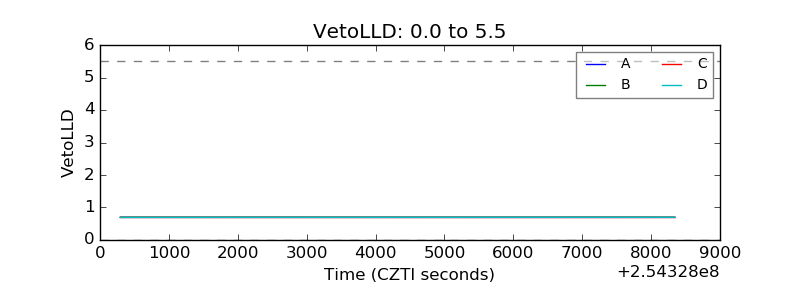 |
| Alpha Counter | 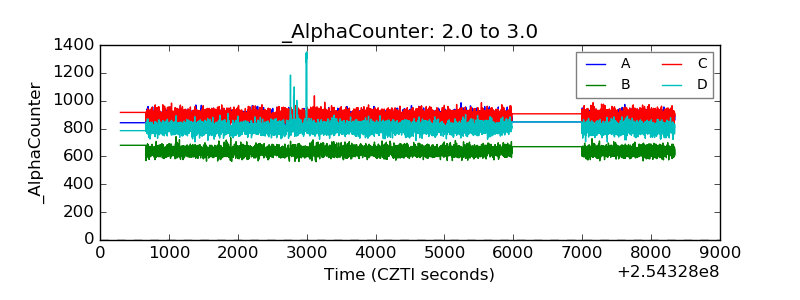 |
| _CPM_Rate | 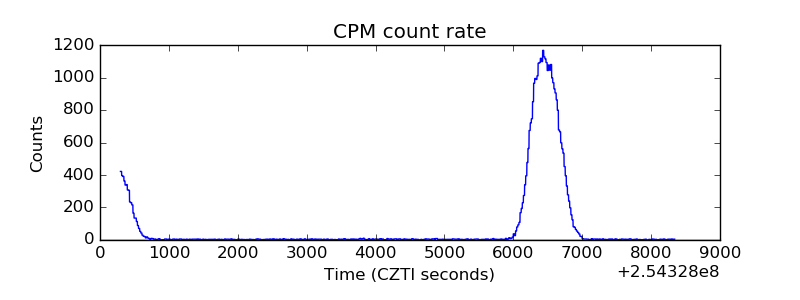 |
| CZT Counter | 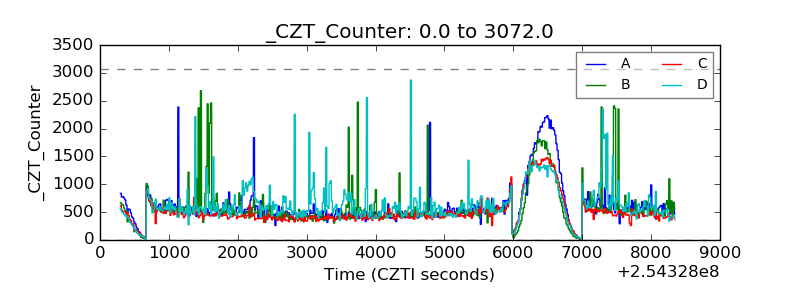 |
| +2.5 Volts monitor |  |
| +5 Volts monitor |  |
| _ROLL_ROT | 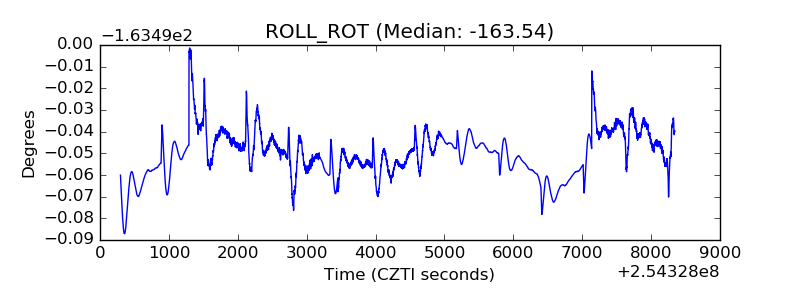 |
| _Roll_DEC | 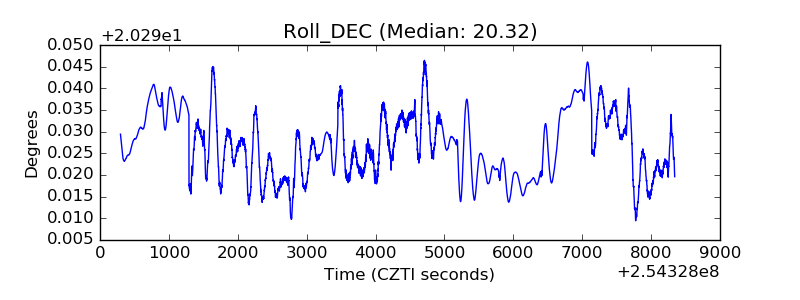 |
| _Roll_RA | 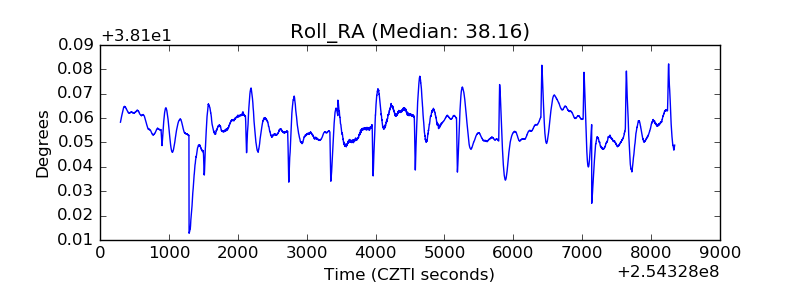 |
| Veto Counter | 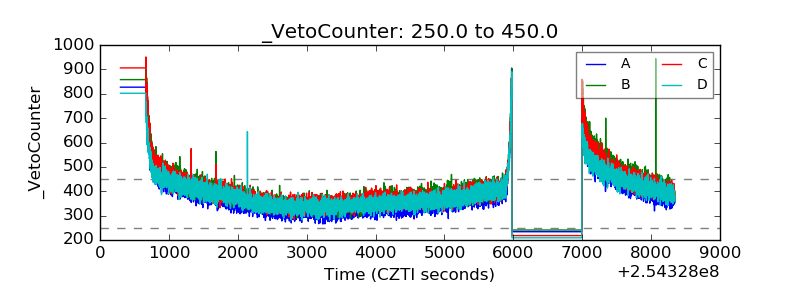 |