| Param | Original file | Final file |
|---|---|---|
| Filename | modeM0/AS1A04_130T01_9000001856_12546cztM0_level2.evt | modeM0/AS1A04_130T01_9000001856_12546cztM0_level2_quad_clean.evt |
| Size (bytes) | 122,736,960 | 29,917,440 |
| Size | 117.1 MB | 28.5 MB |
| Events in quadrant A | 916,497 | 203,553 |
| Events in quadrant B | 980,329 | 200,771 |
| Events in quadrant C | 709,592 | 200,244 |
| Events in quadrant D | 1,006,107 | 189,788 |
| Mode M9 | |||
|---|---|---|---|
| Quadrant | BADHDUFLAG | Total packets | Discarded packets |
| A | 0 | 3 | 0 |
| B | 0 | 3 | 0 |
| C | 0 | 3 | 0 |
| D | 0 | 4 | 0 |
| Mode M0 | |||
|---|---|---|---|
| Quadrant | BADHDUFLAG | Total packets | Discarded packets |
| A | 0 | 3751 | 1 |
| B | 0 | 3871 | 1 |
| C | 0 | 3075 | 1 |
| D | 0 | 4018 | 1 |
| Mode SS | |||
|---|---|---|---|
| Quadrant | BADHDUFLAG | Total packets | Discarded packets |
| A | 0 | 30 | 0 |
| B | 0 | 30 | 0 |
| C | 0 | 30 | 0 |
| D | 0 | 30 | 0 |
| Quadrant | Total seconds | Saturated seconds | Saturation percentage |
|---|---|---|---|
| A | 1500 | 10 | 0.666667% |
| B | 1500 | 69 | 4.600000% |
| C | 1500 | 1 | 0.066667% |
| D | 1500 | 59 | 3.933333% |
Noise dominated data is calculated using 1-second bins in cleaned event files. If a bin has >2000 counts, and if more than 50% of those come from <1% of pixels, then it is considered to be noise-dominated and hence unusable.
| Quadrant | # 1 sec bins | Bins with >0 counts | Bins with >2000 counts | High rate bins dominated by noise | Noise dominated (total time) | Noise dominated (detector-on time) | Marked lightcurve |
|---|---|---|---|---|---|---|---|
| A | 1501 | 1501 | 1 | 1 | 0.07% | 0.07% | 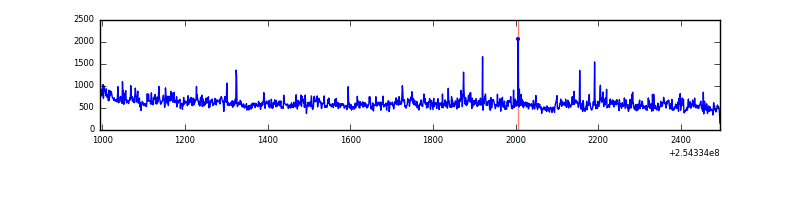 |
| B | 1501 | 1501 | 41 | 41 | 2.73% | 2.73% | 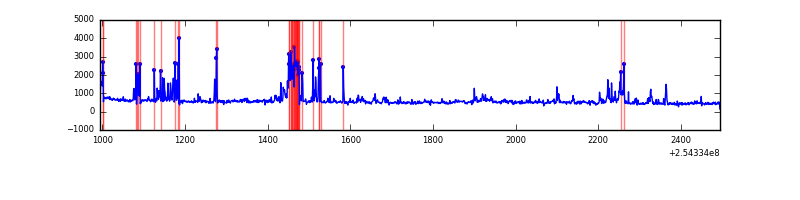 |
| C | 1501 | 1501 | 0 | 0 | 0.00% | 0.00% | 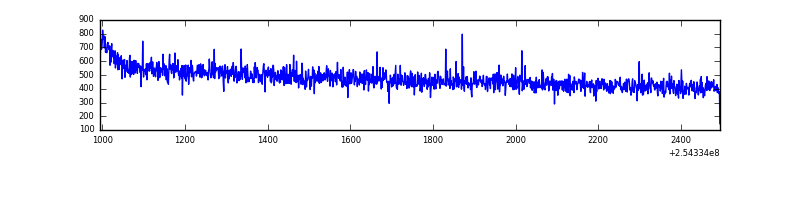 |
| D | 1501 | 1501 | 33 | 33 | 2.20% | 2.20% | 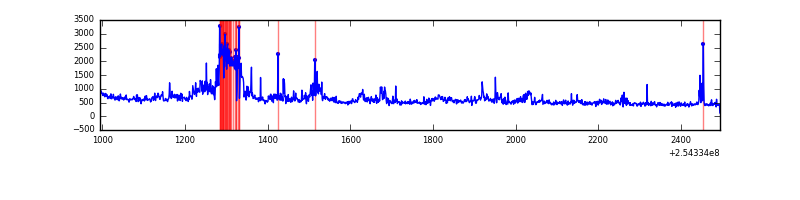 |
Top three noisy pixels from each quadrant. If the there are fewer than three noisy pixels in the level2.evt file, extra rows are filled as -1
| Pixel properties | Quadrant properties | ||||||
|---|---|---|---|---|---|---|---|
| Quadrant | DetID | PixID | Counts | Sigma | Mean | Median | Sigma |
| A | 1 | 162 | 53756 | 1332.75 | 190 | 186 | 40.2 |
| A | 1 | 178 | 33201 | 821.37 | 190 | 186 | 40.2 |
| A | 1 | 161 | 27891 | 689.26 | 190 | 186 | 40.2 |
| B | 4 | 239 | 215941 | 5835.01 | 185 | 180 | 37.0 |
| B | 0 | 230 | 18035 | 482.87 | 185 | 180 | 37.0 |
| B | 15 | 222 | 13373 | 356.79 | 185 | 180 | 37.0 |
| C | 13 | 61 | 1391 | 27.82 | 181 | 182 | 43.5 |
| C | 3 | 202 | 474 | 6.72 | 181 | 182 | 43.5 |
| C | 7 | 247 | 448 | 6.12 | 181 | 182 | 43.5 |
| D | 13 | 104 | 131062 | 2984.31 | 181 | 176 | 43.9 |
| D | 8 | 195 | 112919 | 2570.63 | 181 | 176 | 43.9 |
| D | 1 | 52 | 64366 | 1463.58 | 181 | 176 | 43.9 |
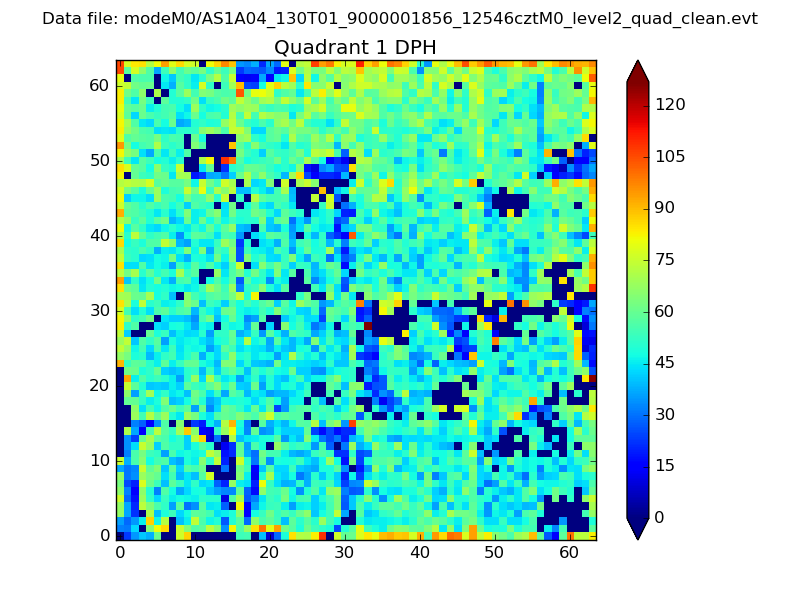
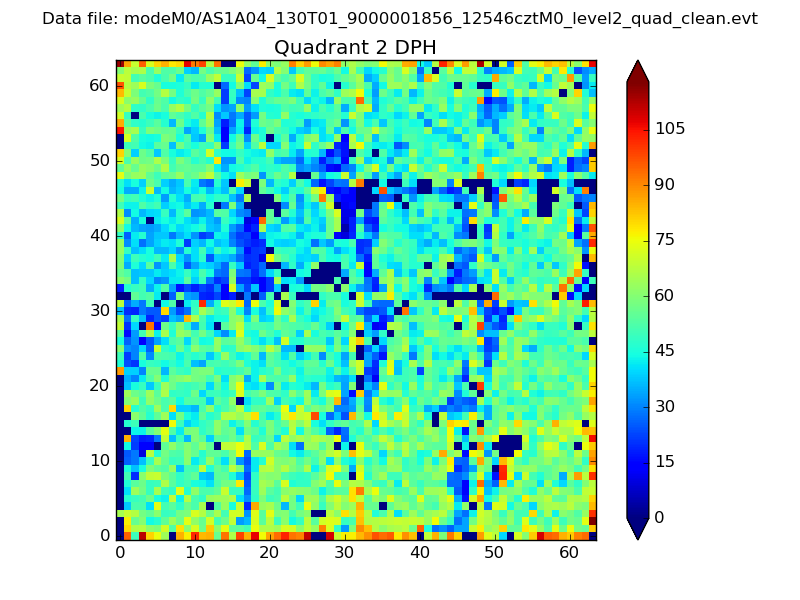
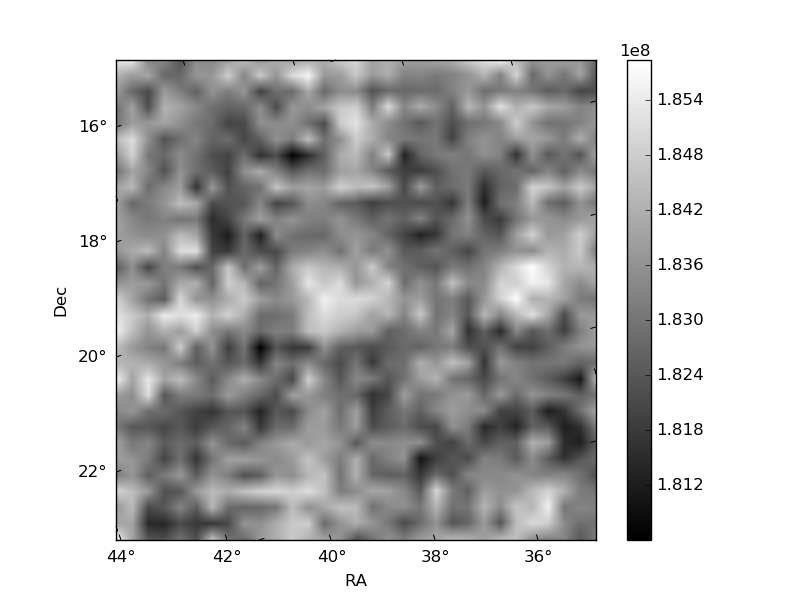
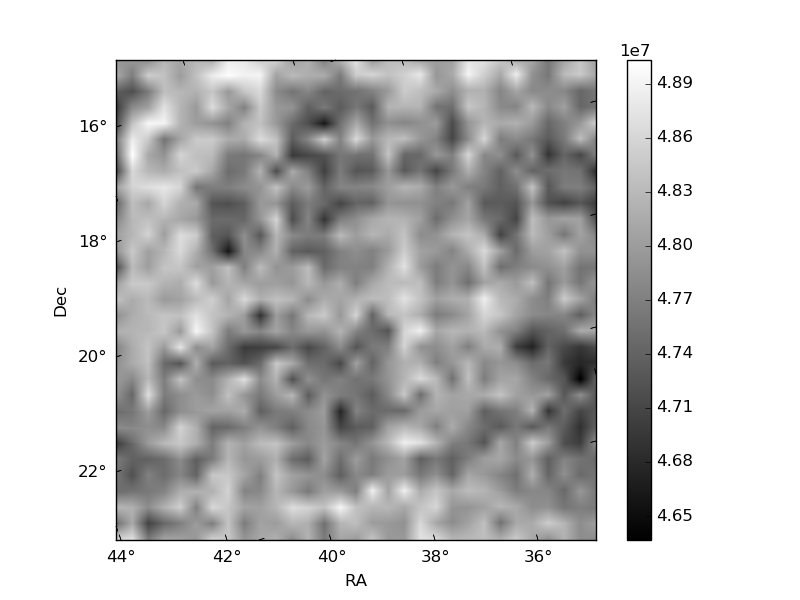
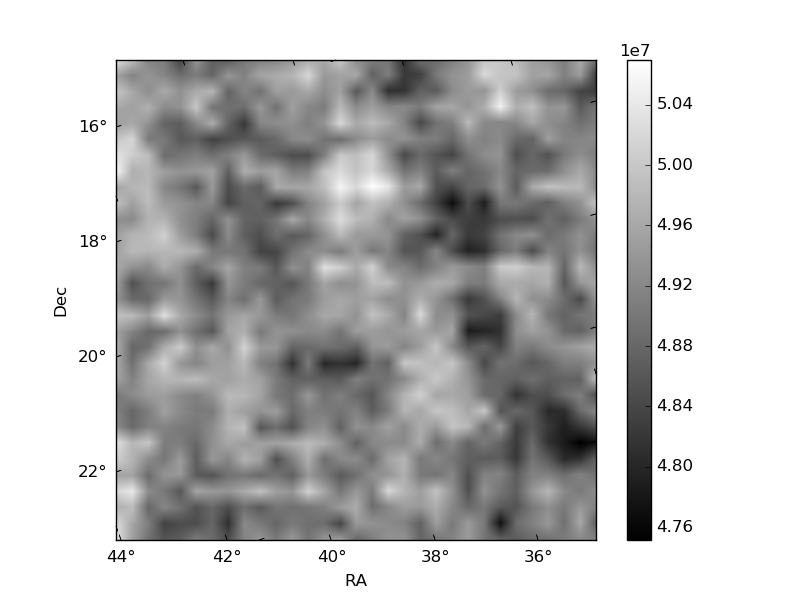
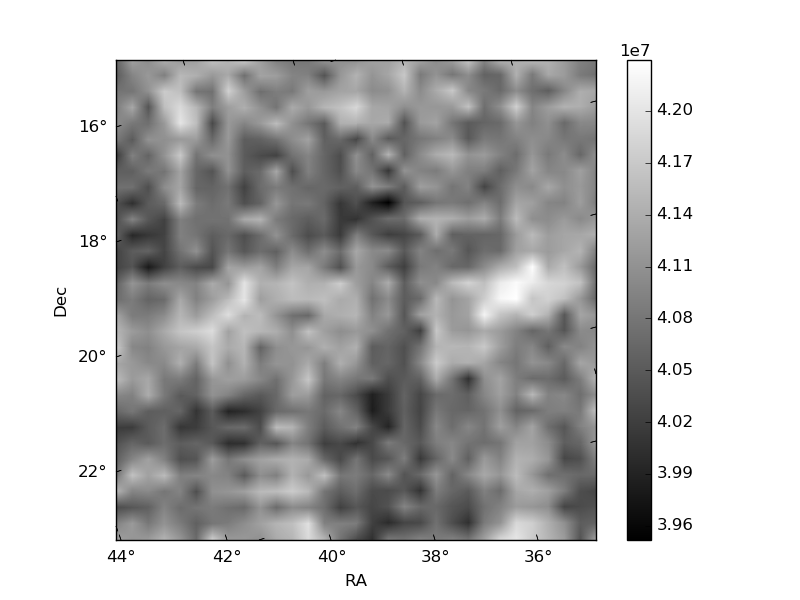
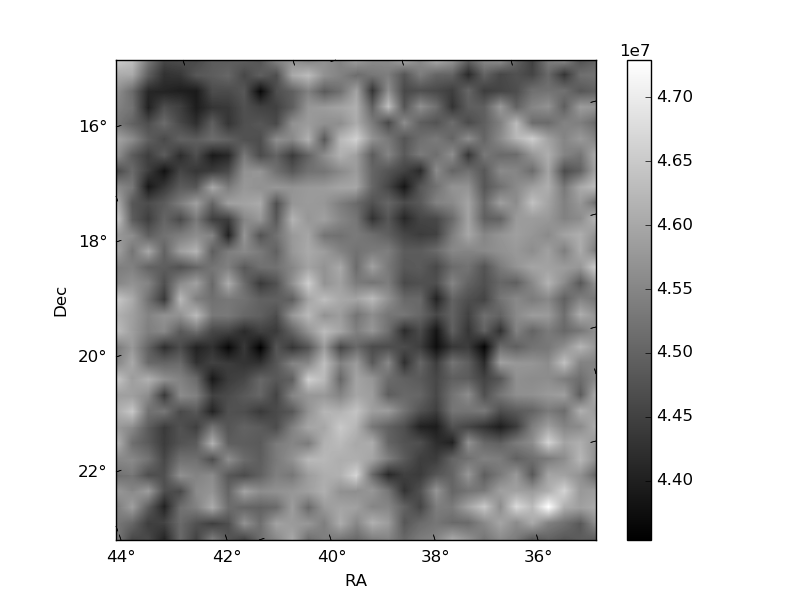
Histogram calculated using DETX and DETY for each event in the final _common_clean file
| Quadrant A |  |
 |
Quadrant B |
|---|---|---|---|
| Quadrant D | 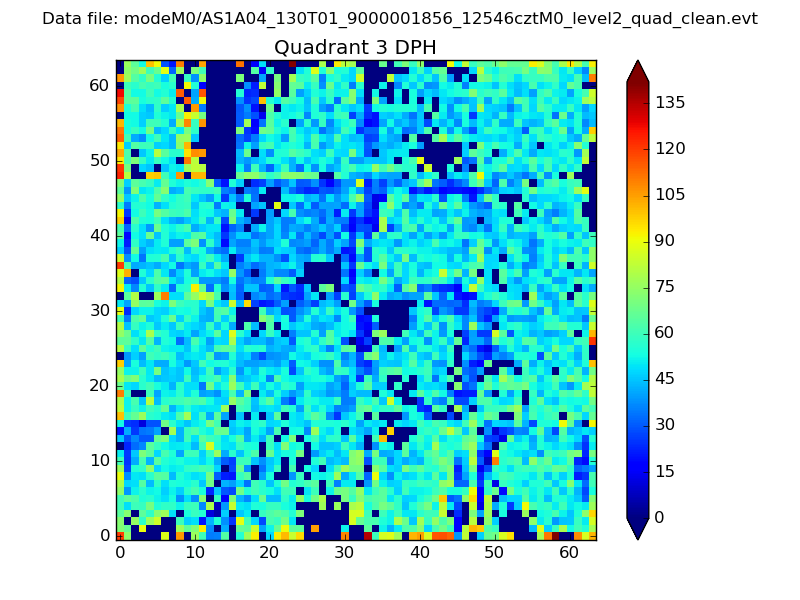 |
 |
Quadrant C |
| Plot type | Count rate plots | Images |
|---|---|---|
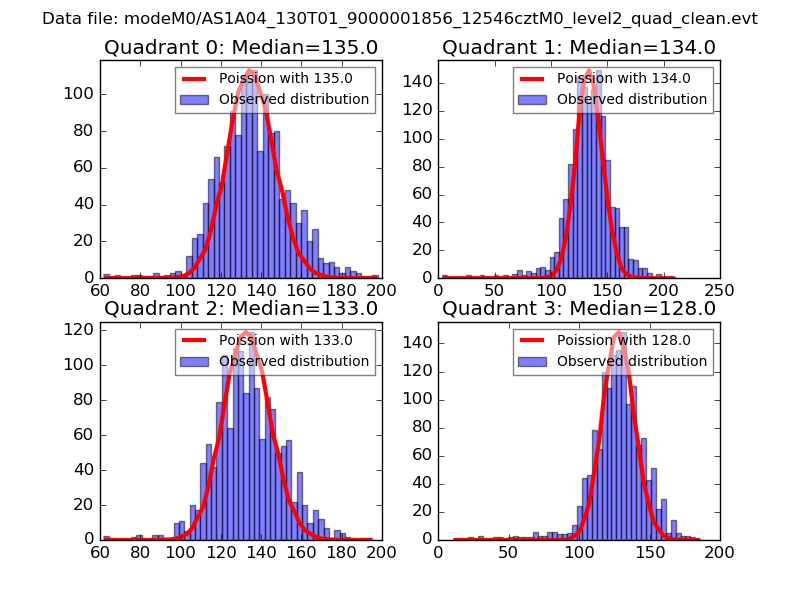
| Comparison with Poisson distribution Blue bars denote a histogram of data divided into 1 sec bins. Red curve is a Poisson curve with rate = median count rate of data. |
 |
 |
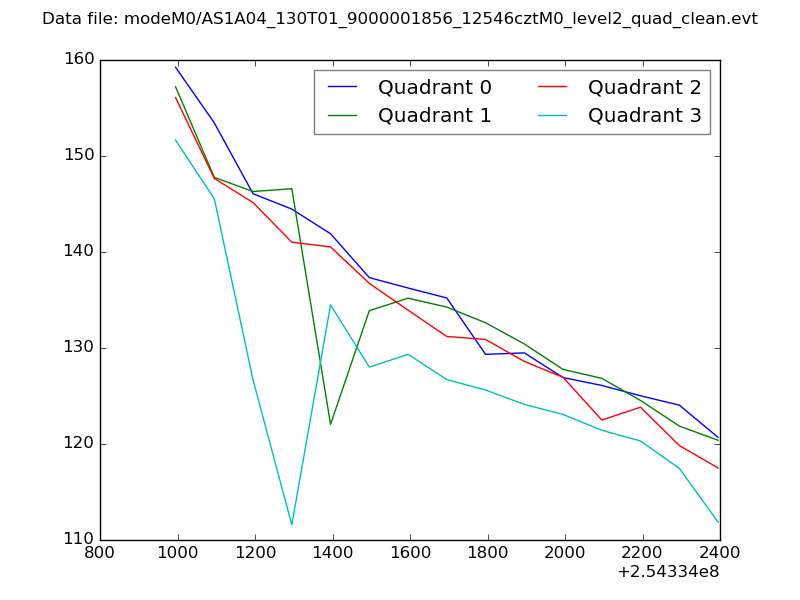
| Quadrant-wise count rates Data is divided into 100 sec bins |
 |
|
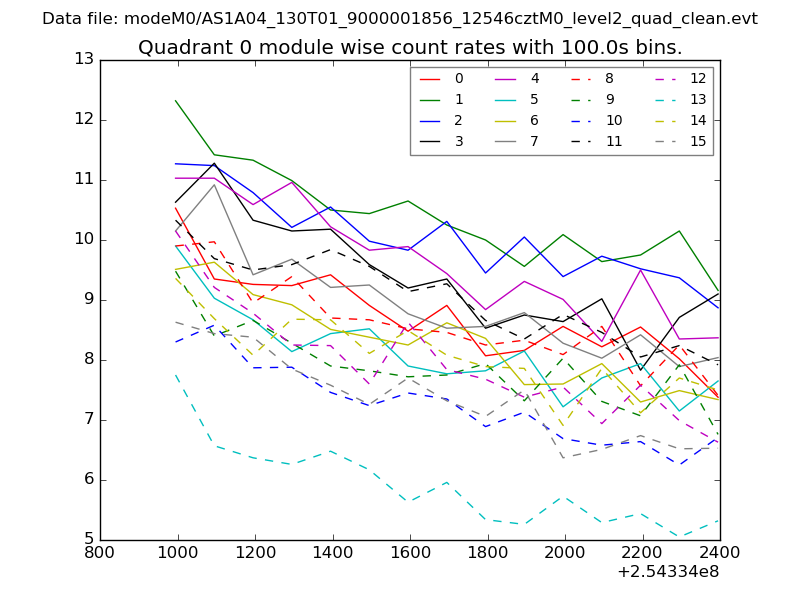
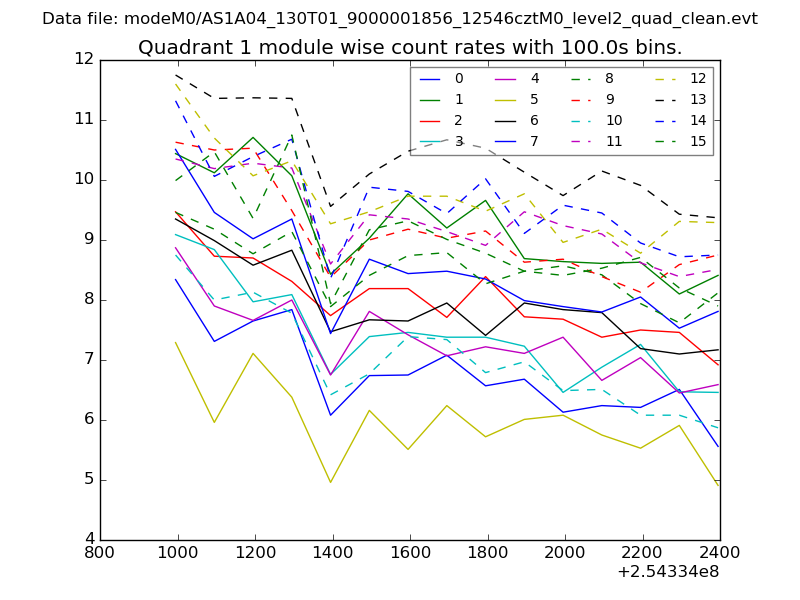
| Module-wise count rates for Quadrant A Data is divided into 100 sec bins |
 |
 |
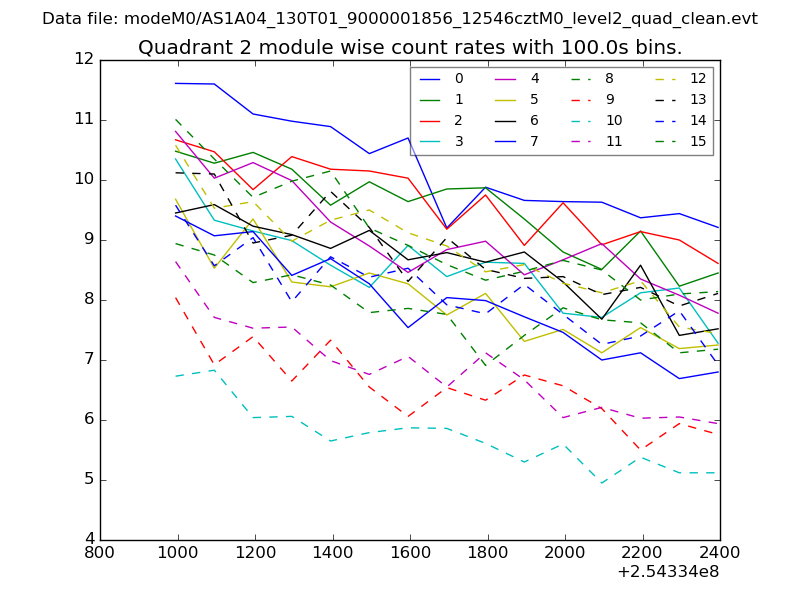
| Module-wise count rates for Quadrant B Data is divided into 100 sec bins |
 |
 |
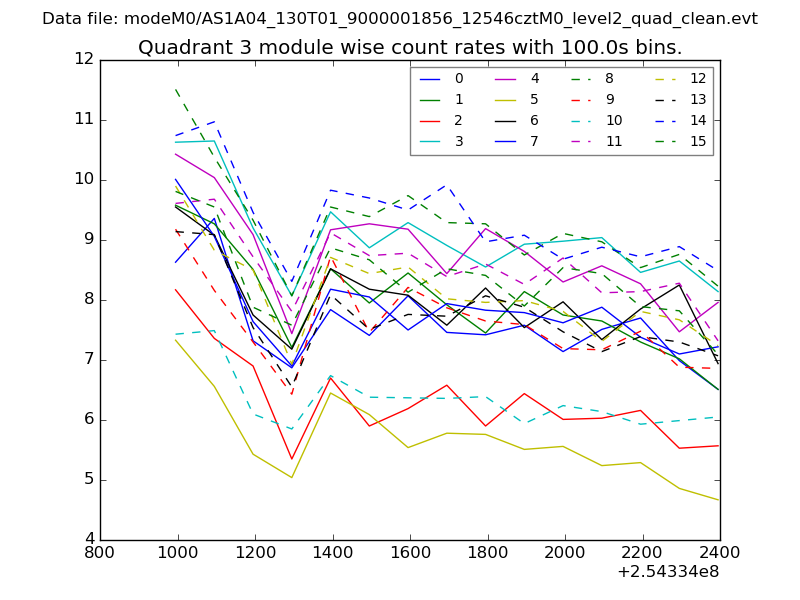
| Module-wise count rates for Quadrant C Data is divided into 100 sec bins |
 |
 |
| Module-wise count rates for Quadrant D Data is divided into 100 sec bins |
 |
 |
| Parameter | Plot |
|---|---|
| CZT HV Monitor | 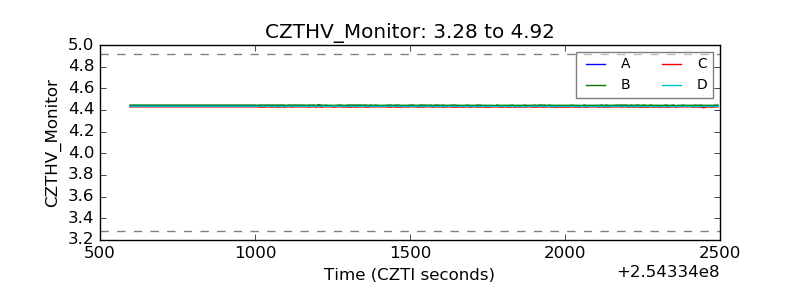 |
| D_VDD | 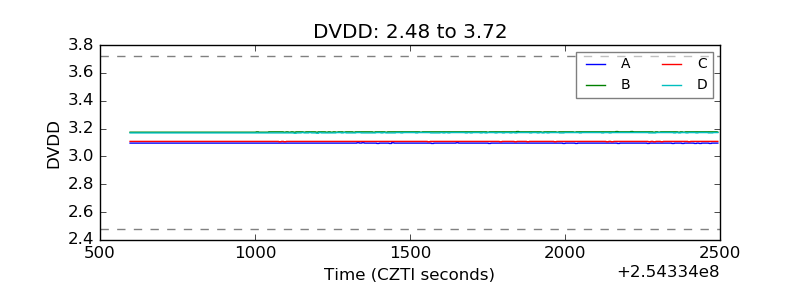 |
| Temperature 1 | 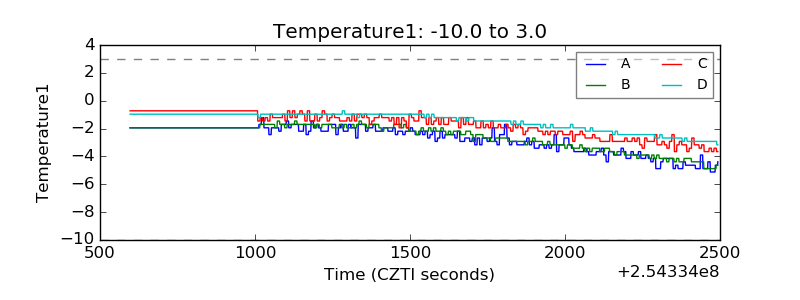 |
| Veto HV Monitor | 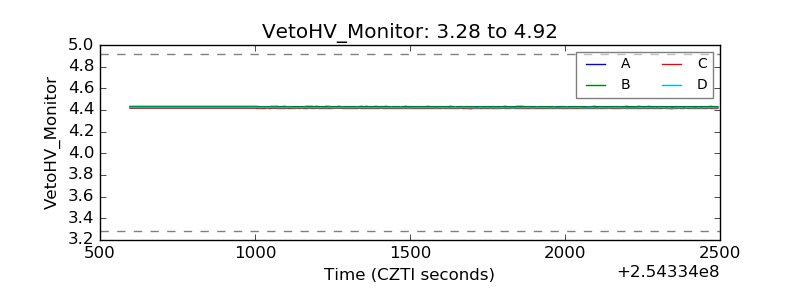 |
| Veto LLD | 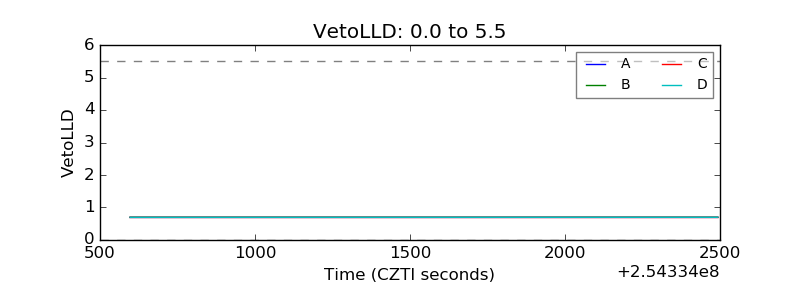 |
| Alpha Counter | 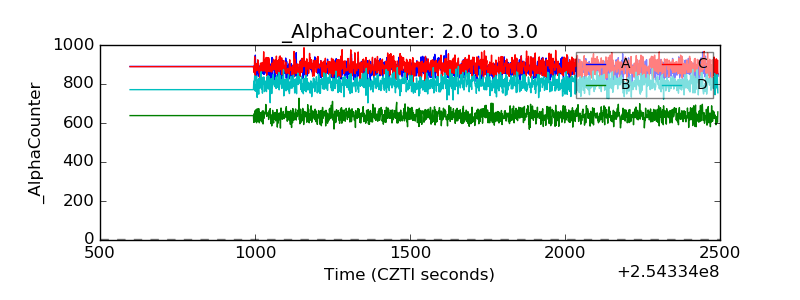 |
| _CPM_Rate | 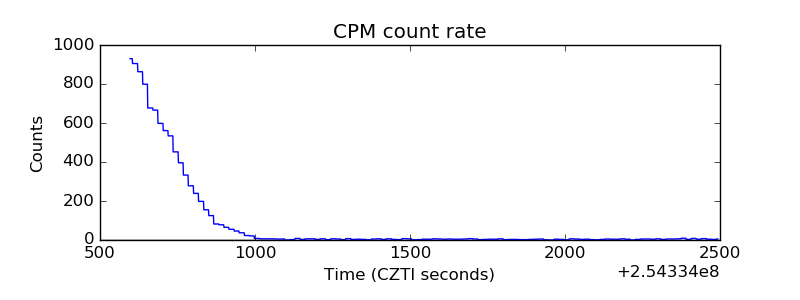 |
| CZT Counter | 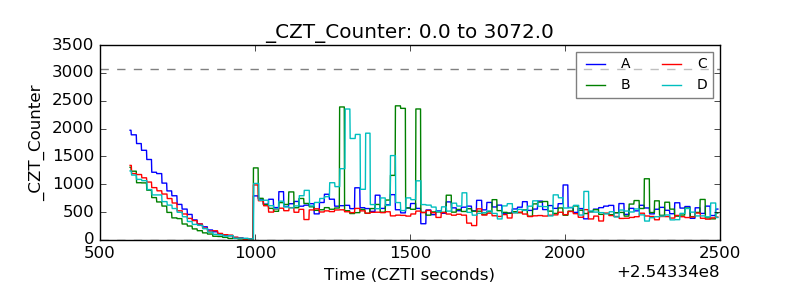 |
| +2.5 Volts monitor |  |
| +5 Volts monitor | 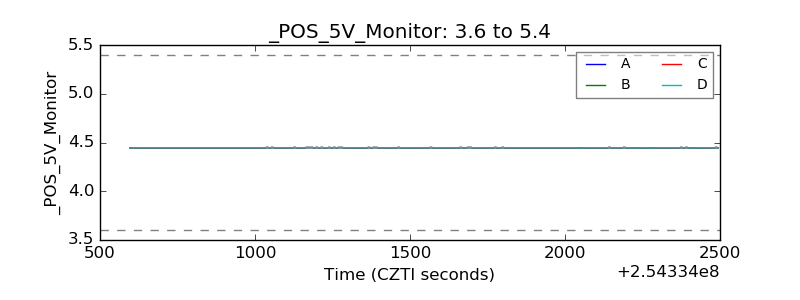 |
| _ROLL_ROT | 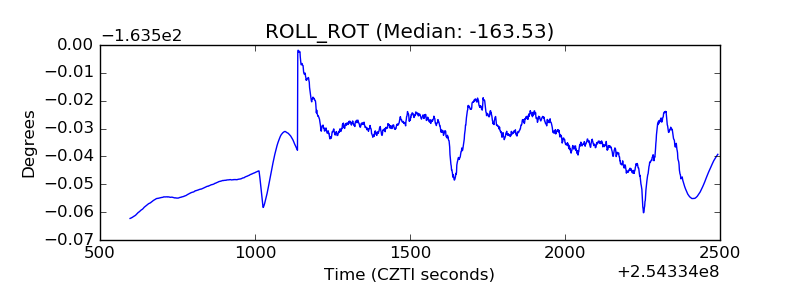 |
| _Roll_DEC | 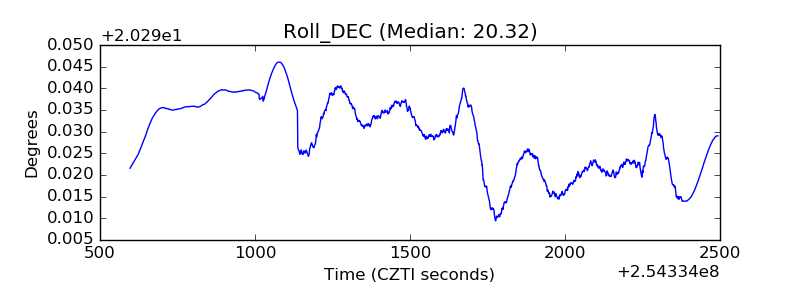 |
| _Roll_RA | 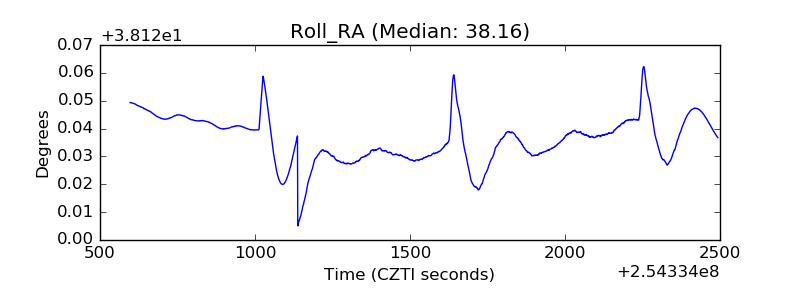 |
| Veto Counter | 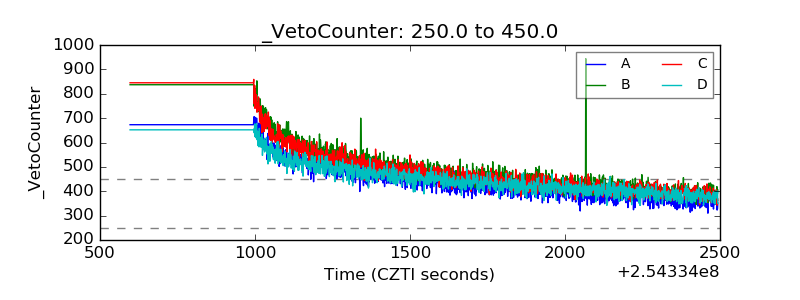 |