| Param | Original file | Final file |
|---|---|---|
| Filename | modeM0/AS1C02_016T01_9000001858_12547cztM0_level2.evt | modeM0/AS1C02_016T01_9000001858_12547cztM0_level2_quad_clean.evt |
| Size (bytes) | 377,066,880 | 96,413,760 |
| Size | 359.6 MB | 91.9 MB |
| Events in quadrant A | 2,691,434 | 644,027 |
| Events in quadrant B | 2,923,128 | 655,656 |
| Events in quadrant C | 2,232,414 | 658,734 |
| Events in quadrant D | 3,234,279 | 613,033 |
| Mode M0 | |||
|---|---|---|---|
| Quadrant | BADHDUFLAG | Total packets | Discarded packets |
| A | 0 | 11338 | 1 |
| B | 0 | 12152 | 1 |
| C | 0 | 10199 | 1 |
| D | 0 | 13125 | 1 |
| Mode M9 | |||
|---|---|---|---|
| Quadrant | BADHDUFLAG | Total packets | Discarded packets |
| A | 0 | 1 | 0 |
| B | 0 | 1 | 0 |
| C | 0 | 1 | 0 |
| D | 0 | 1 | 0 |
| Mode SS | |||
|---|---|---|---|
| Quadrant | BADHDUFLAG | Total packets | Discarded packets |
| A | 0 | 102 | 0 |
| B | 0 | 102 | 0 |
| C | 0 | 102 | 0 |
| D | 0 | 102 | 0 |
| Quadrant | Total seconds | Saturated seconds | Saturation percentage |
|---|---|---|---|
| A | 4965 | 26 | 0.523666% |
| B | 4965 | 240 | 4.833837% |
| C | 4965 | 5 | 0.100705% |
| D | 4966 | 168 | 3.383004% |
Noise dominated data is calculated using 1-second bins in cleaned event files. If a bin has >2000 counts, and if more than 50% of those come from <1% of pixels, then it is considered to be noise-dominated and hence unusable.
| Quadrant | # 1 sec bins | Bins with >0 counts | Bins with >2000 counts | High rate bins dominated by noise | Noise dominated (total time) | Noise dominated (detector-on time) | Marked lightcurve |
|---|---|---|---|---|---|---|---|
| A | 4966 | 4966 | 7 | 7 | 0.14% | 0.14% | 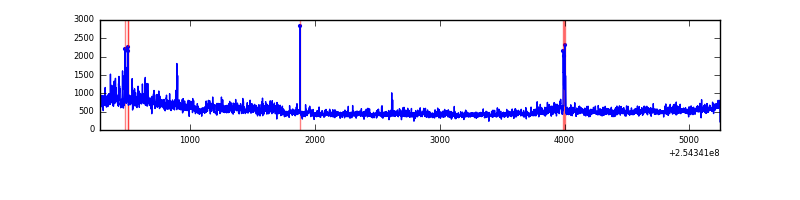 |
| B | 4966 | 4966 | 136 | 136 | 2.74% | 2.74% | 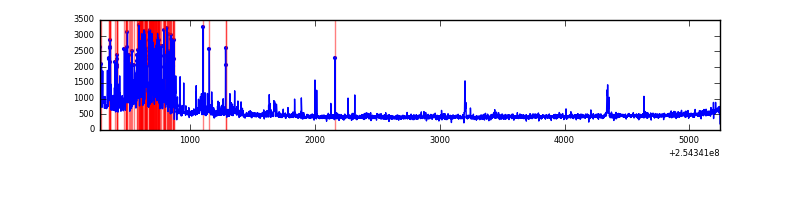 |
| C | 4966 | 4966 | 0 | 0 | 0.00% | 0.00% |  |
| D | 4967 | 4967 | 120 | 120 | 2.42% | 2.42% | 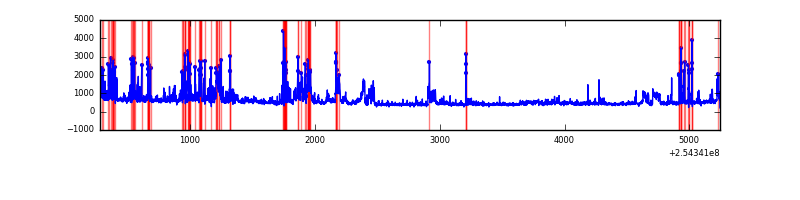 |
Top three noisy pixels from each quadrant. If the there are fewer than three noisy pixels in the level2.evt file, extra rows are filled as -1
| Pixel properties | Quadrant properties | ||||||
|---|---|---|---|---|---|---|---|
| Quadrant | DetID | PixID | Counts | Sigma | Mean | Median | Sigma |
| A | 1 | 162 | 128780 | 1093.94 | 578 | 566 | 117.2 |
| A | 8 | 15 | 111452 | 946.1 | 578 | 566 | 117.2 |
| A | 1 | 178 | 73939 | 626.03 | 578 | 566 | 117.2 |
| B | 4 | 239 | 589795 | 5488.81 | 575 | 561 | 107.4 |
| B | 15 | 222 | 31694 | 290.01 | 575 | 561 | 107.4 |
| B | 5 | 250 | 18861 | 170.47 | 575 | 561 | 107.4 |
| C | 13 | 61 | 4191 | 27.56 | 571 | 575 | 131.2 |
| C | 3 | 233 | 1885 | 9.98 | 571 | 575 | 131.2 |
| C | 3 | 202 | 1502 | 7.07 | 571 | 575 | 131.2 |
| D | 1 | 52 | 604234 | 4580.09 | 556 | 539 | 131.8 |
| D | 1 | 255 | 288672 | 2186.0 | 556 | 539 | 131.8 |
| D | 13 | 104 | 120546 | 910.46 | 556 | 539 | 131.8 |
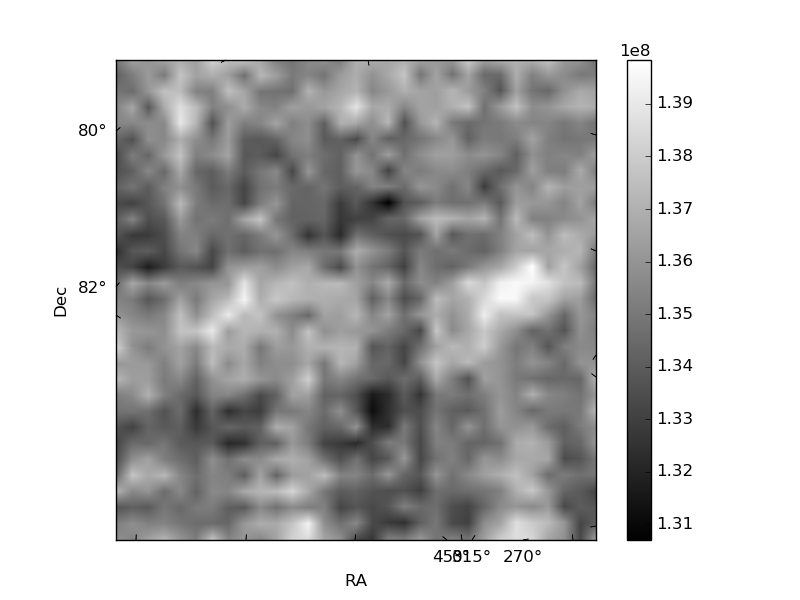
Histogram calculated using DETX and DETY for each event in the final _common_clean file
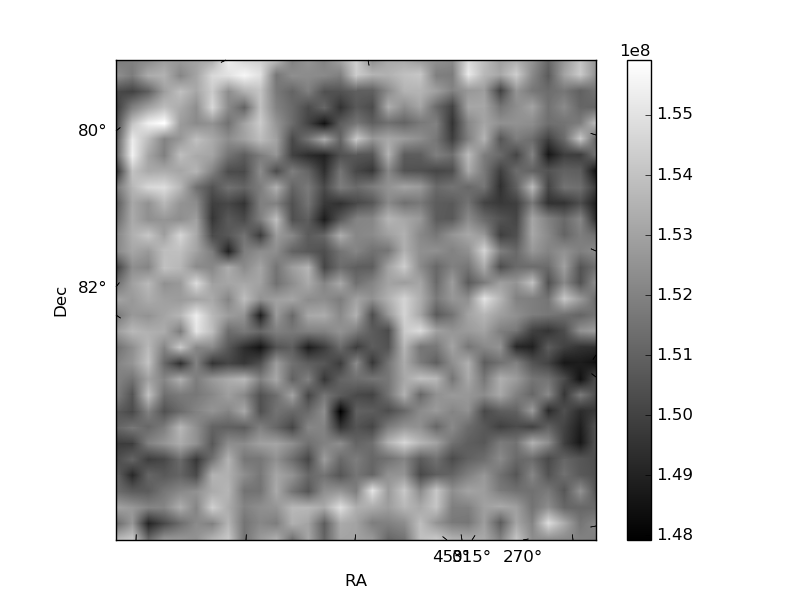
| Quadrant A | 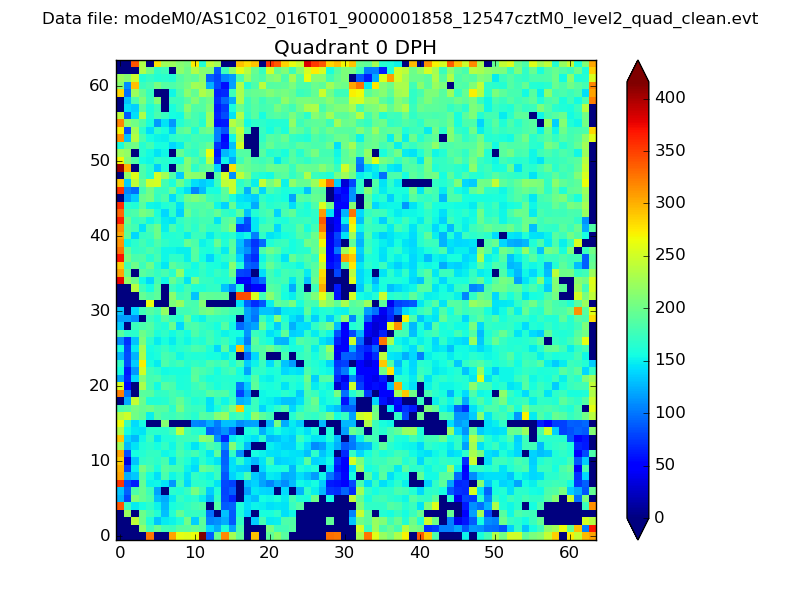 |
 |
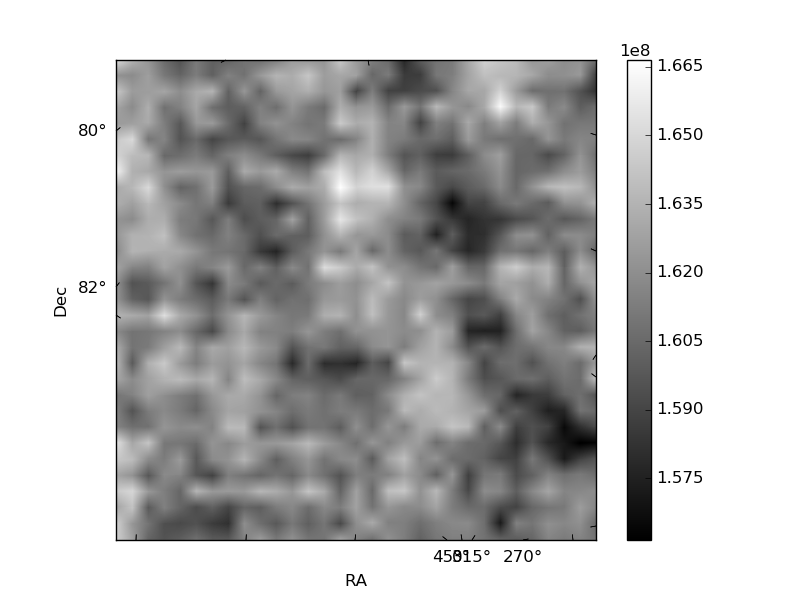
Quadrant B |
|---|---|---|---|
| Quadrant D | 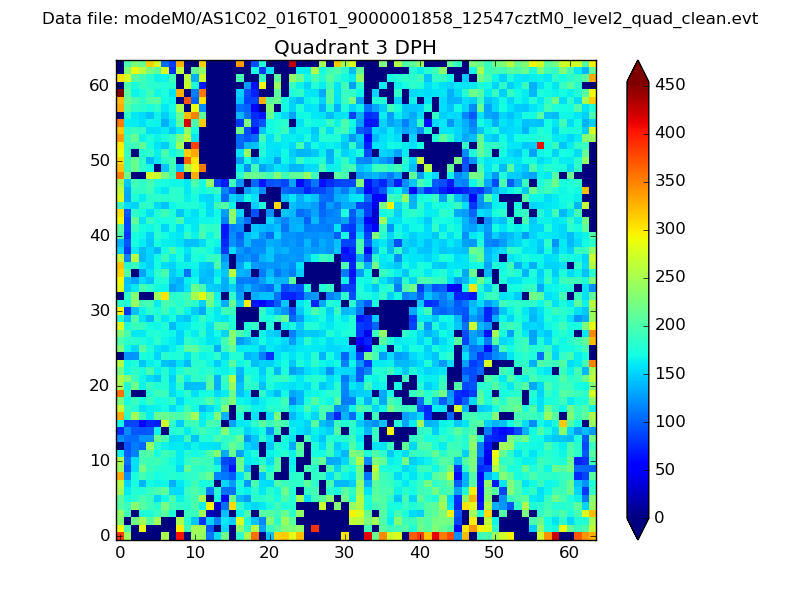 |
 |
Quadrant C |
| Plot type | Count rate plots | Images |
|---|---|---|
| Comparison with Poisson distribution Blue bars denote a histogram of data divided into 1 sec bins. Red curve is a Poisson curve with rate = median count rate of data. |
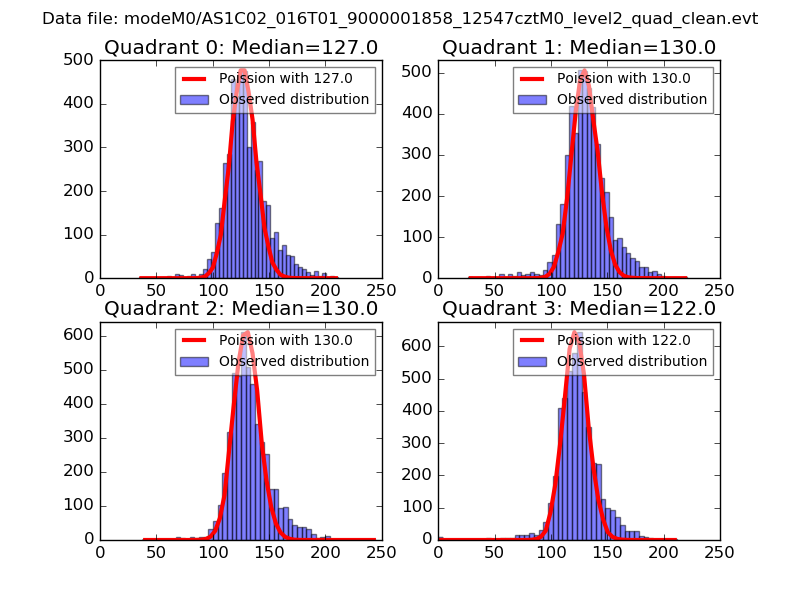 |
 |
| Quadrant-wise count rates Data is divided into 100 sec bins |
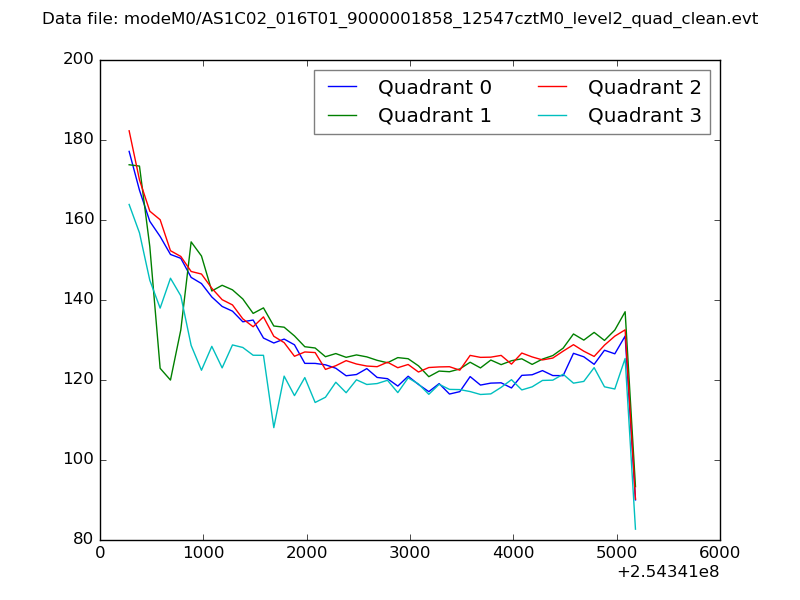 |
|
| Module-wise count rates for Quadrant A Data is divided into 100 sec bins |
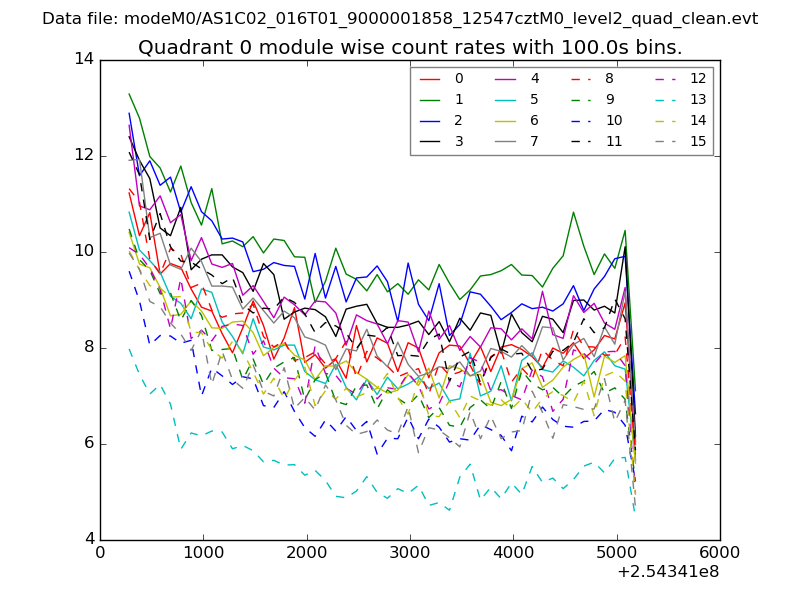 |
 |
| Module-wise count rates for Quadrant B Data is divided into 100 sec bins |
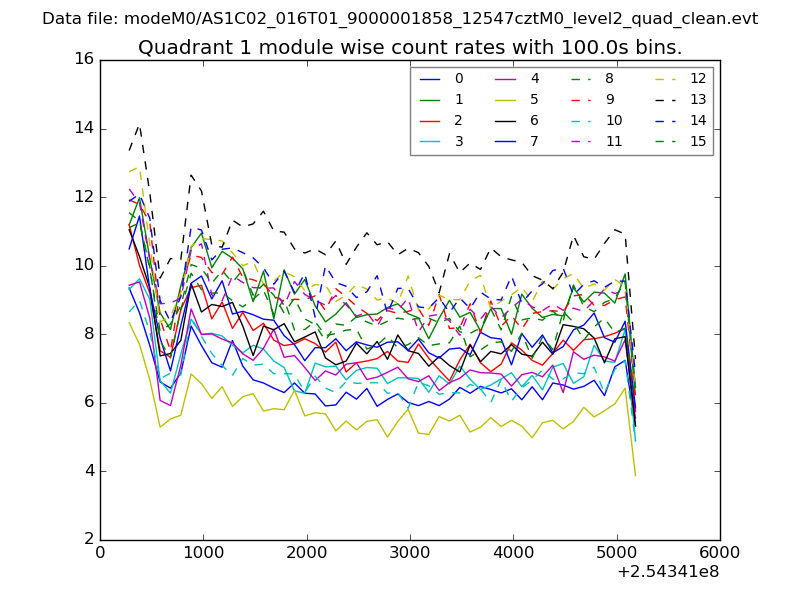 |
 |
| Module-wise count rates for Quadrant C Data is divided into 100 sec bins |
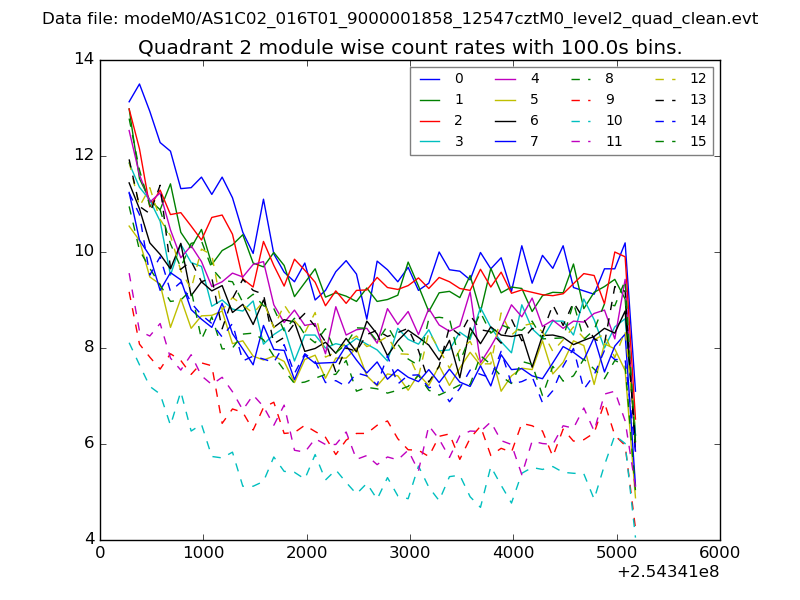 |
 |
| Module-wise count rates for Quadrant D Data is divided into 100 sec bins |
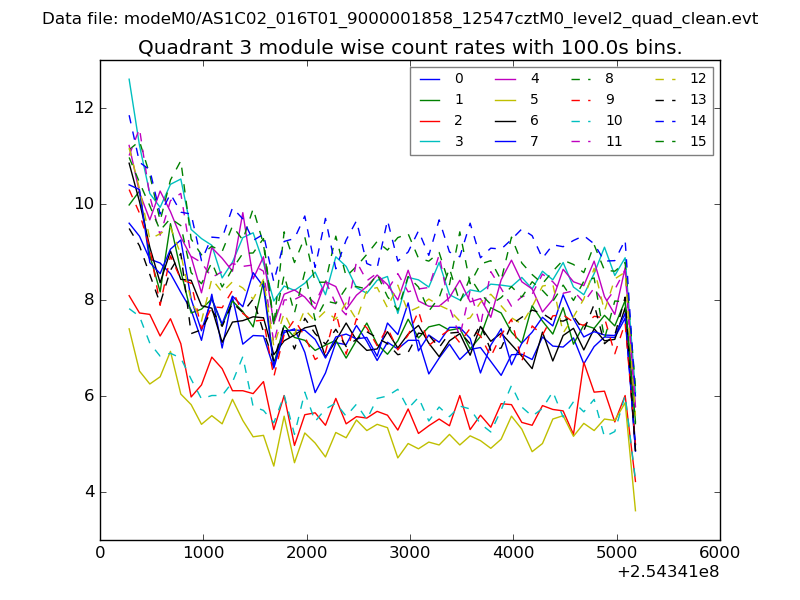 |
 |
| Parameter | Plot |
|---|---|
| CZT HV Monitor | 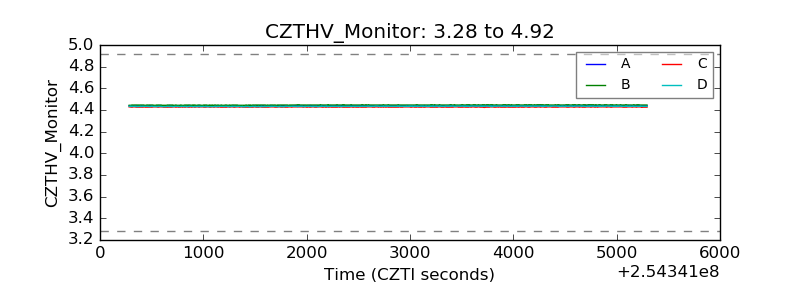 |
| D_VDD | 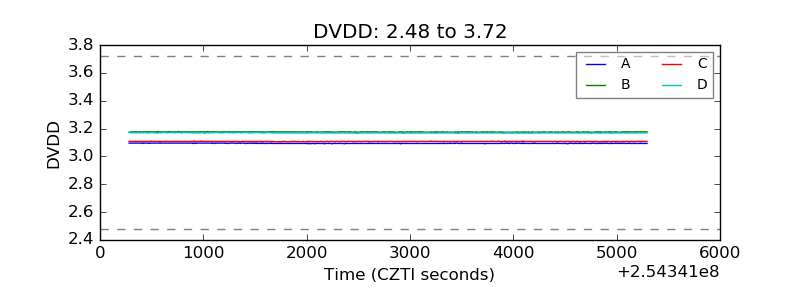 |
| Temperature 1 |  |
| Veto HV Monitor | 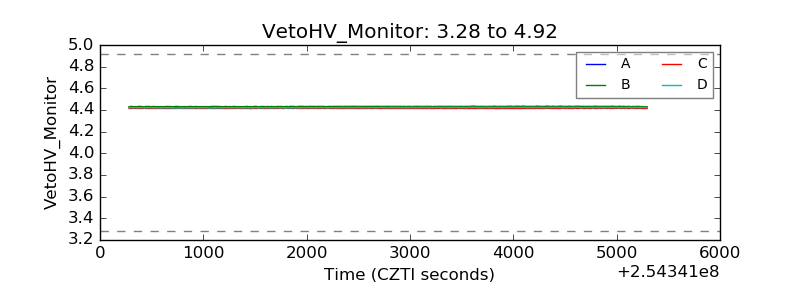 |
| Veto LLD | 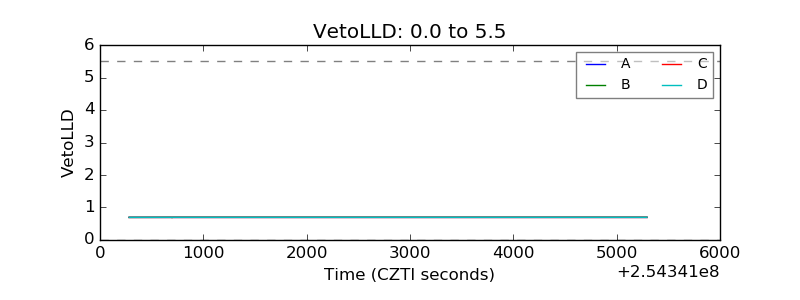 |
| Alpha Counter | 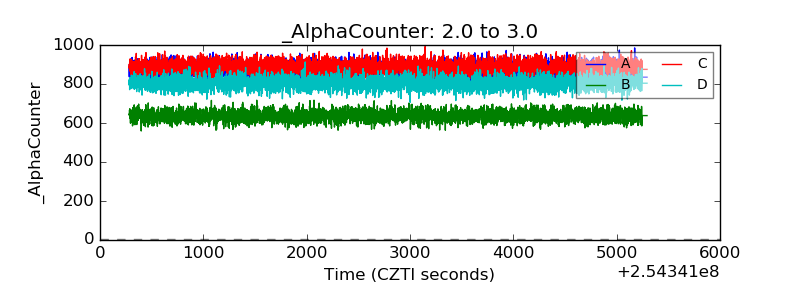 |
| _CPM_Rate | 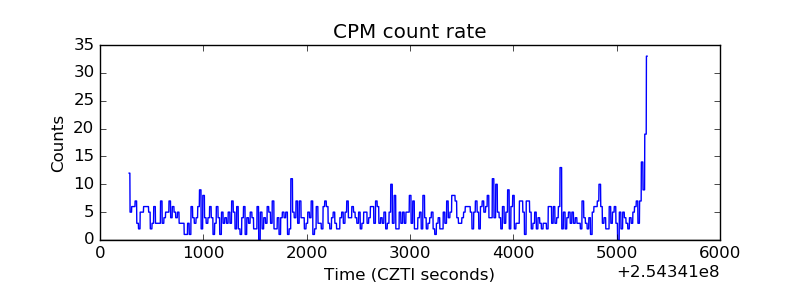 |
| CZT Counter | 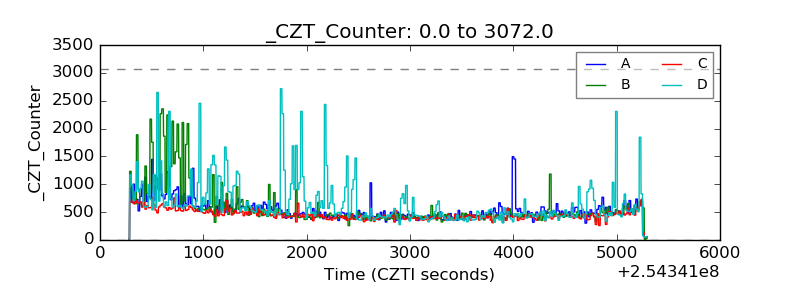 |
| +2.5 Volts monitor |  |
| +5 Volts monitor | 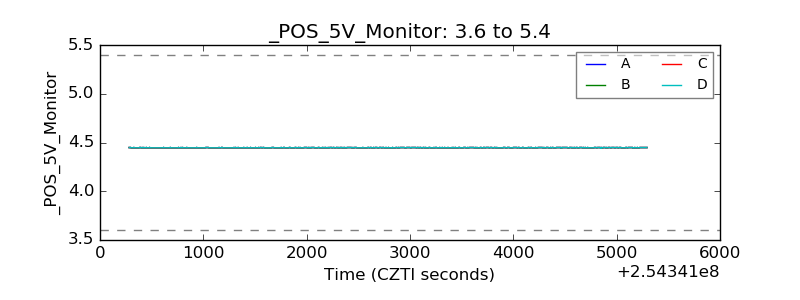 |
| _ROLL_ROT | 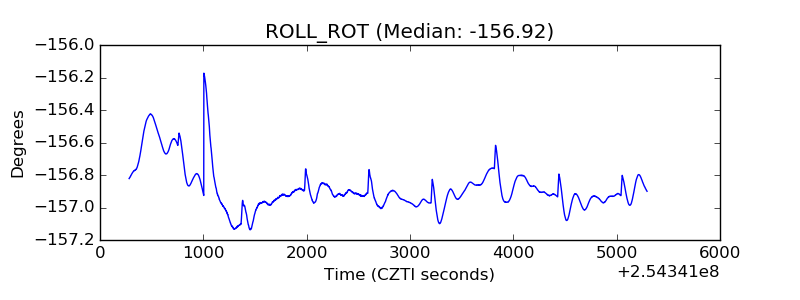 |
| _Roll_DEC | 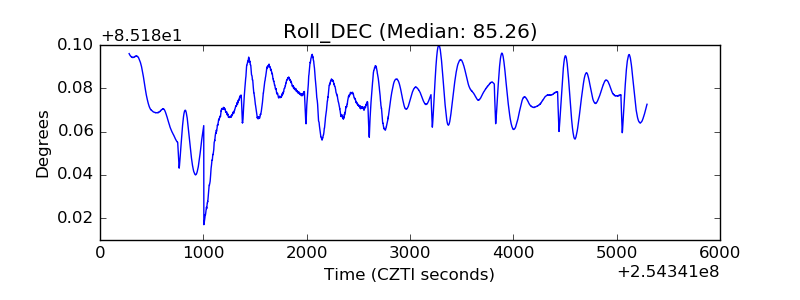 |
| _Roll_RA | 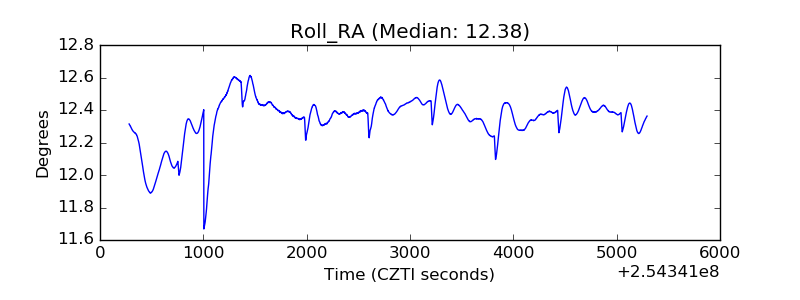 |
| Veto Counter | 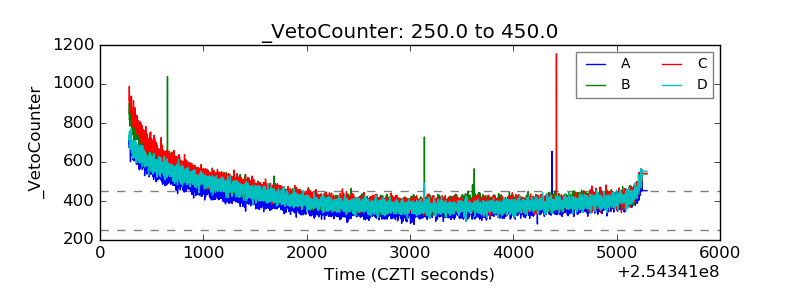 |