| Param | Original file | Final file |
|---|---|---|
| Filename | modeM0/AS1G06_067T01_9000001860_12547cztM0_level2.evt | modeM0/AS1G06_067T01_9000001860_12547cztM0_level2_quad_clean.evt |
| Size (bytes) | 100,488,960 | 28,296,000 |
| Size | 95.8 MB | 27.0 MB |
| Events in quadrant A | 723,394 | 191,697 |
| Events in quadrant B | 742,115 | 199,408 |
| Events in quadrant C | 666,205 | 195,972 |
| Events in quadrant D | 827,349 | 178,978 |
| Mode M0 | |||
|---|---|---|---|
| Quadrant | BADHDUFLAG | Total packets | Discarded packets |
| A | 0 | 3008 | 2 |
| B | 0 | 3003 | 1 |
| C | 0 | 2721 | 1 |
| D | 0 | 3286 | 1 |
| Mode SS | |||
|---|---|---|---|
| Quadrant | BADHDUFLAG | Total packets | Discarded packets |
| A | 0 | 24 | 0 |
| B | 0 | 24 | 0 |
| C | 0 | 24 | 0 |
| D | 0 | 24 | 0 |
| Mode M9 | |||
|---|---|---|---|
| Quadrant | BADHDUFLAG | Total packets | Discarded packets |
| A | 0 | 6 | 0 |
| B | 0 | 6 | 0 |
| C | 0 | 6 | 0 |
| D | 0 | 6 | 0 |
| Quadrant | Total seconds | Saturated seconds | Saturation percentage |
|---|---|---|---|
| A | 1197 | 1 | 0.083542% |
| B | 1197 | 16 | 1.336675% |
| C | 1197 | 3 | 0.250627% |
| D | 1197 | 13 | 1.086048% |
Noise dominated data is calculated using 1-second bins in cleaned event files. If a bin has >2000 counts, and if more than 50% of those come from <1% of pixels, then it is considered to be noise-dominated and hence unusable.
| Quadrant | # 1 sec bins | Bins with >0 counts | Bins with >2000 counts | High rate bins dominated by noise | Noise dominated (total time) | Noise dominated (detector-on time) | Marked lightcurve |
|---|---|---|---|---|---|---|---|
| A | 1198 | 1198 | 0 | 0 | 0.00% | 0.00% | 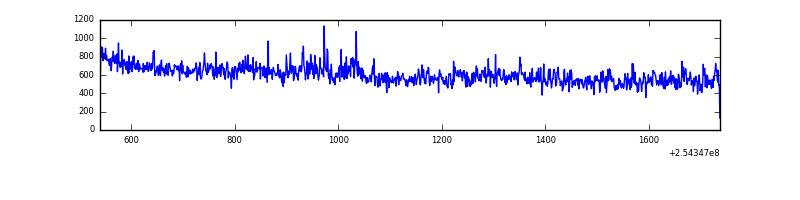 |
| B | 1198 | 1198 | 8 | 8 | 0.67% | 0.67% | 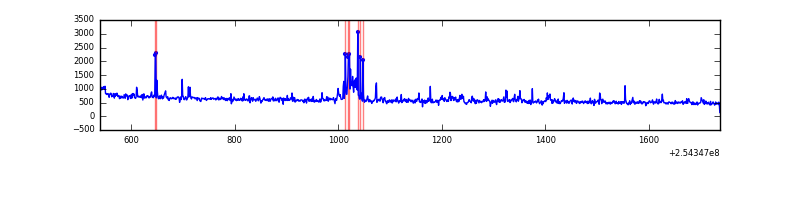 |
| C | 1198 | 1198 | 0 | 0 | 0.00% | 0.00% |  |
| D | 1198 | 1198 | 7 | 7 | 0.58% | 0.58% | 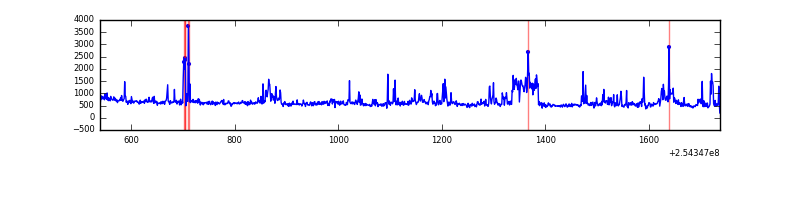 |
Top three noisy pixels from each quadrant. If the there are fewer than three noisy pixels in the level2.evt file, extra rows are filled as -1
| Pixel properties | Quadrant properties | ||||||
|---|---|---|---|---|---|---|---|
| Quadrant | DetID | PixID | Counts | Sigma | Mean | Median | Sigma |
| A | 1 | 162 | 25405 | 719.84 | 166 | 163 | 35.1 |
| A | 8 | 15 | 18339 | 518.33 | 166 | 163 | 35.1 |
| A | 1 | 178 | 13869 | 390.86 | 166 | 163 | 35.1 |
| B | 4 | 239 | 56097 | 1707.84 | 169 | 166 | 32.7 |
| B | 0 | 190 | 8857 | 265.38 | 169 | 166 | 32.7 |
| B | 0 | 230 | 5760 | 170.81 | 169 | 166 | 32.7 |
| C | 3 | 233 | 1258 | 26.9 | 170 | 171 | 40.4 |
| C | 9 | 221 | 1241 | 26.48 | 170 | 171 | 40.4 |
| C | 13 | 61 | 1172 | 24.77 | 170 | 171 | 40.4 |
| D | 1 | 52 | 152334 | 3732.02 | 165 | 161 | 40.8 |
| D | 8 | 195 | 30214 | 737.05 | 165 | 161 | 40.8 |
| D | 13 | 104 | 12284 | 297.31 | 165 | 161 | 40.8 |
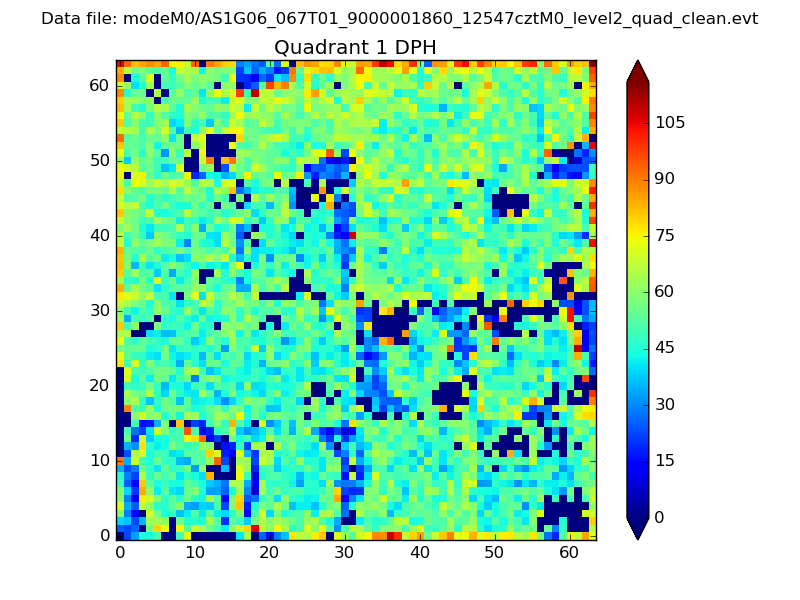
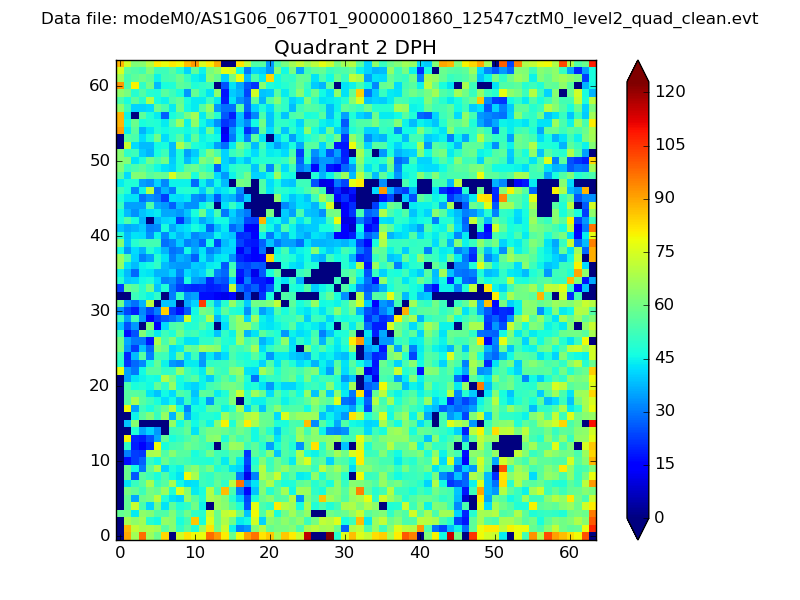
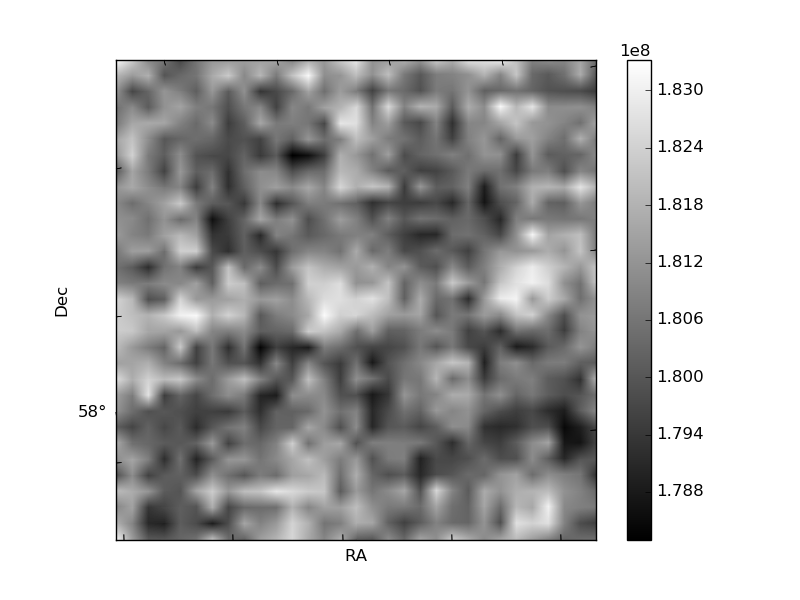
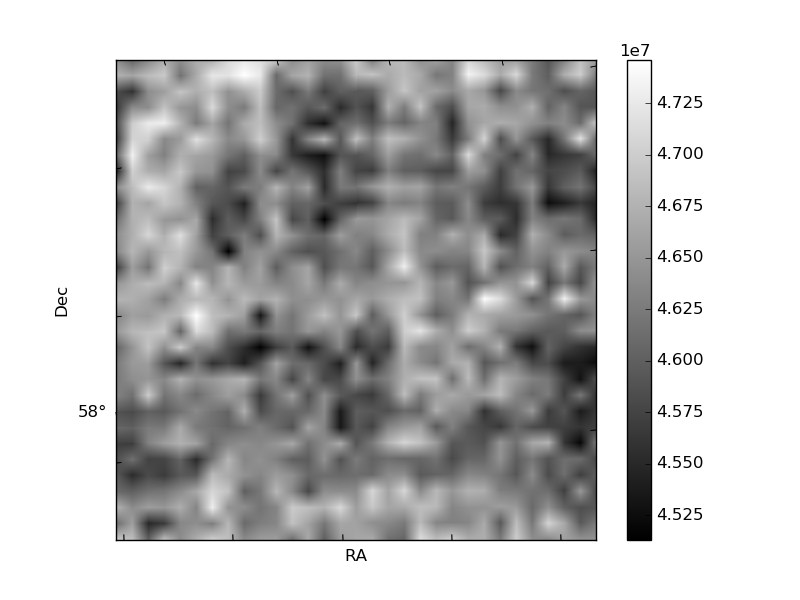
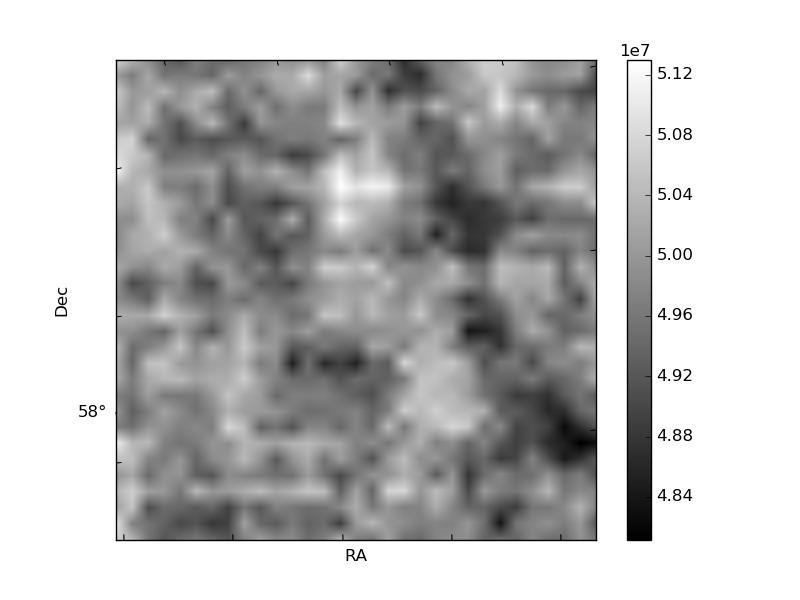
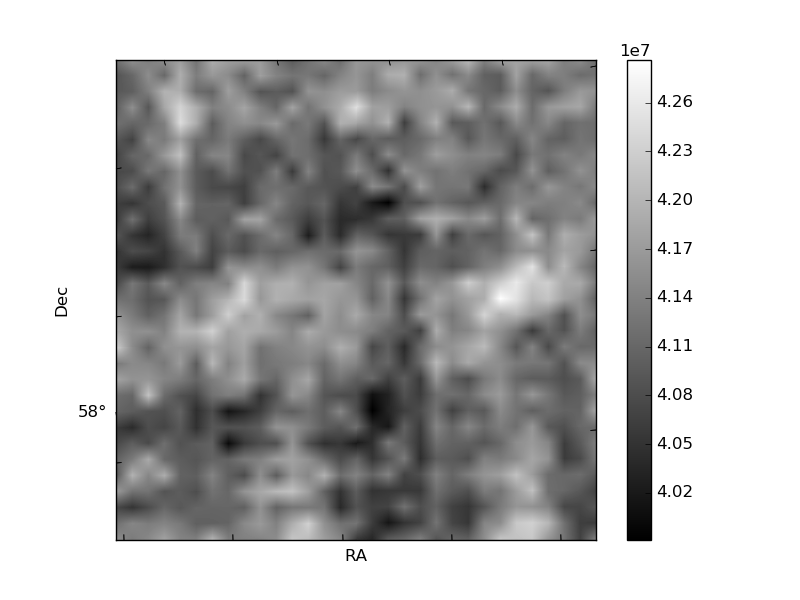
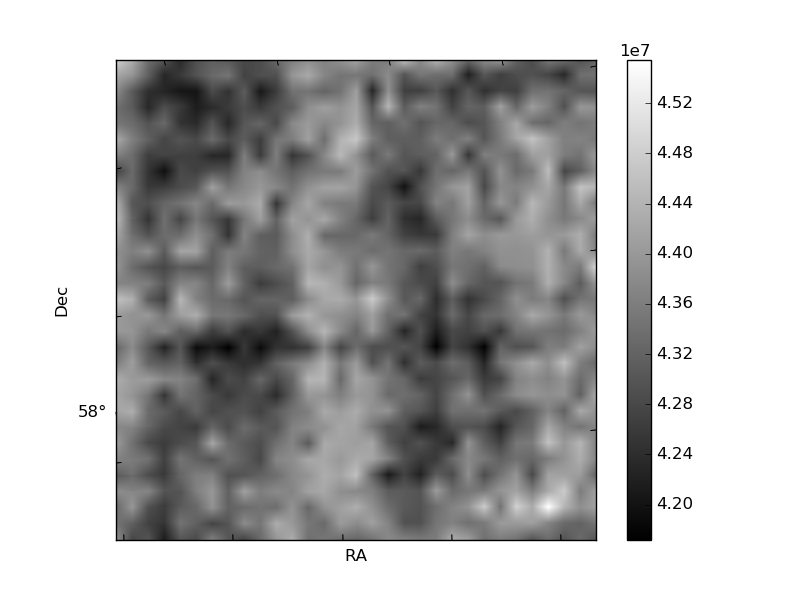
Histogram calculated using DETX and DETY for each event in the final _common_clean file
| Quadrant A | 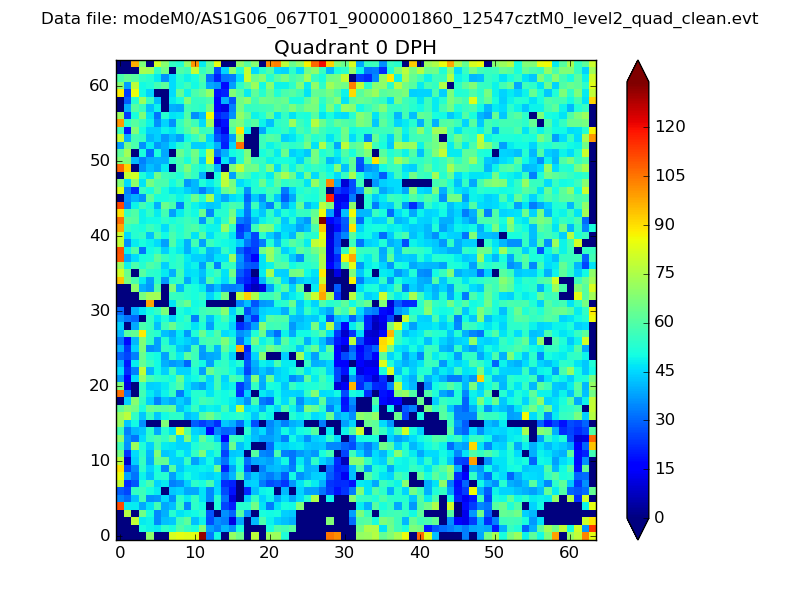 |
 |
Quadrant B |
|---|---|---|---|
| Quadrant D | 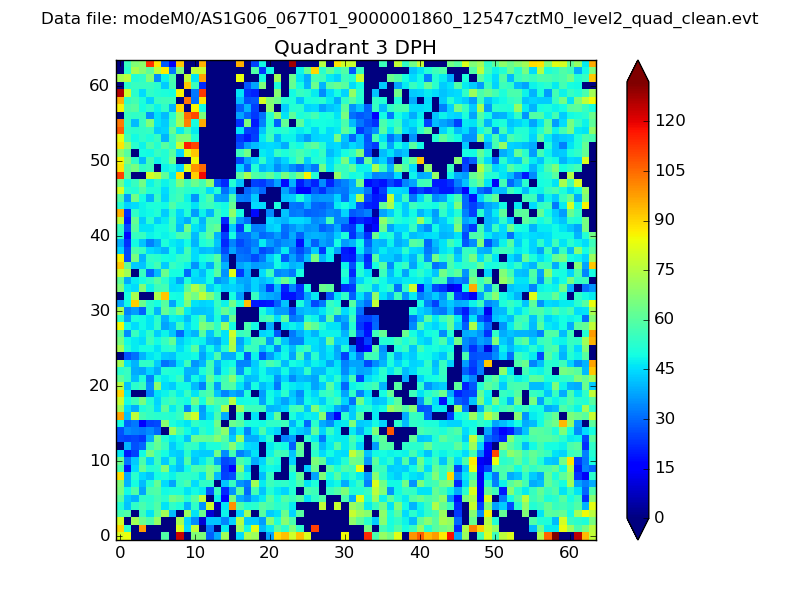 |
 |
Quadrant C |
| Plot type | Count rate plots | Images |
|---|---|---|
| Comparison with Poisson distribution Blue bars denote a histogram of data divided into 1 sec bins. Red curve is a Poisson curve with rate = median count rate of data. |
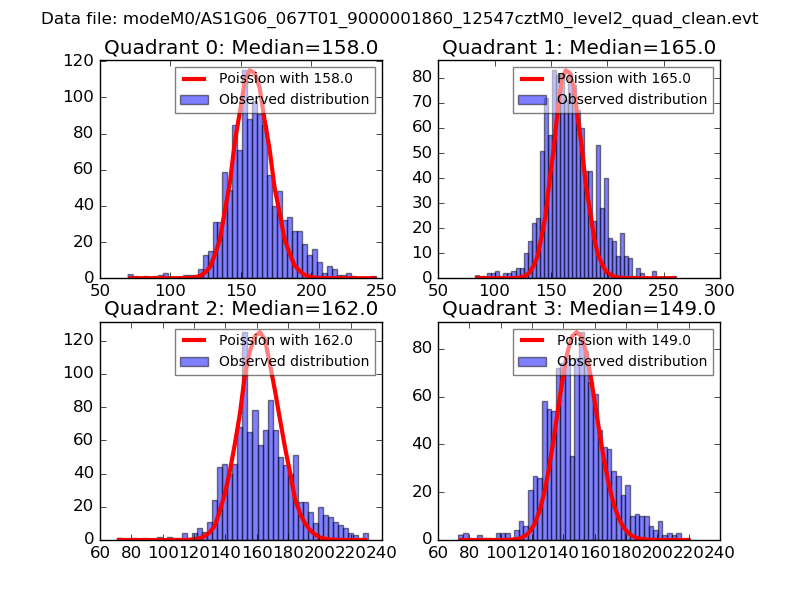 |
 |
| Quadrant-wise count rates Data is divided into 100 sec bins |
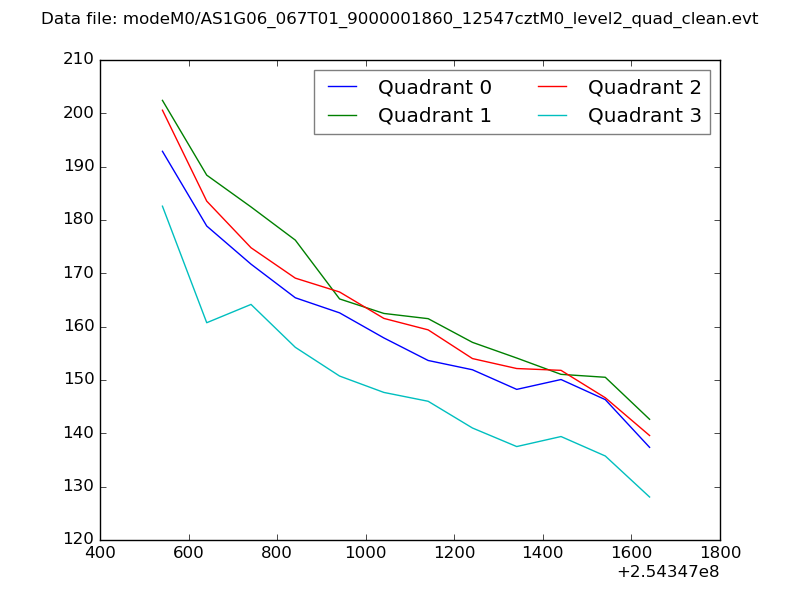 |
|
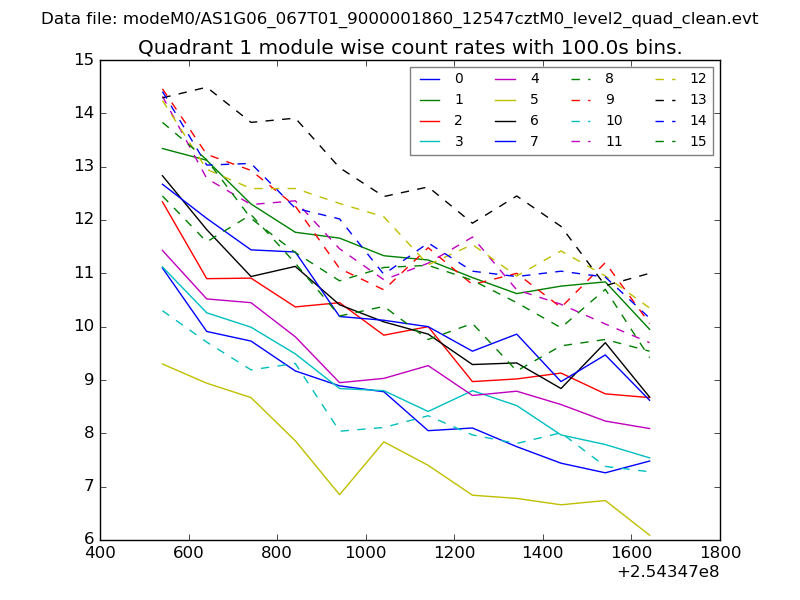
| Module-wise count rates for Quadrant A Data is divided into 100 sec bins |
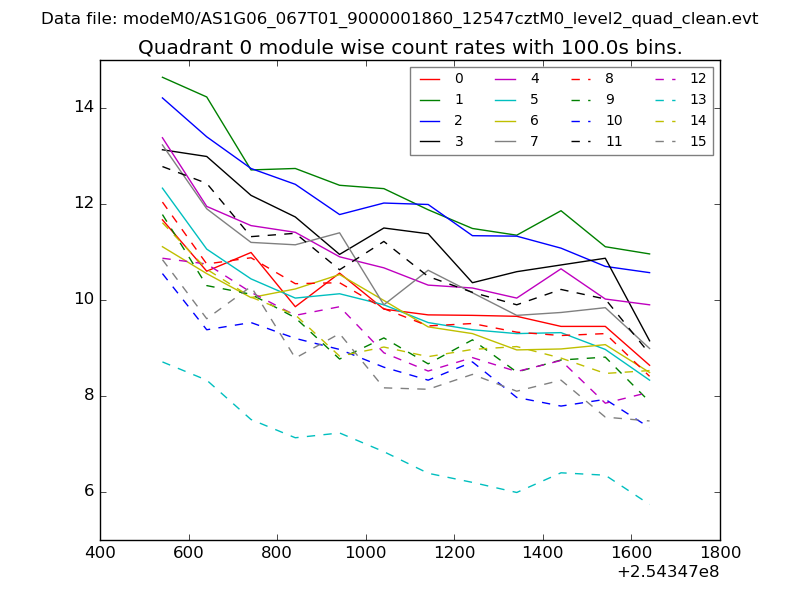 |
 |
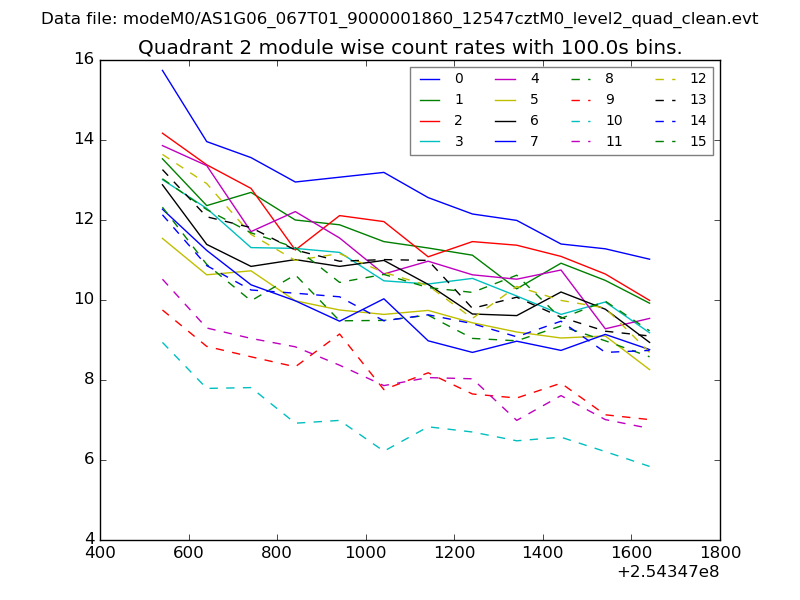
| Module-wise count rates for Quadrant B Data is divided into 100 sec bins |
 |
 |
| Module-wise count rates for Quadrant C Data is divided into 100 sec bins |
 |
 |
| Module-wise count rates for Quadrant D Data is divided into 100 sec bins |
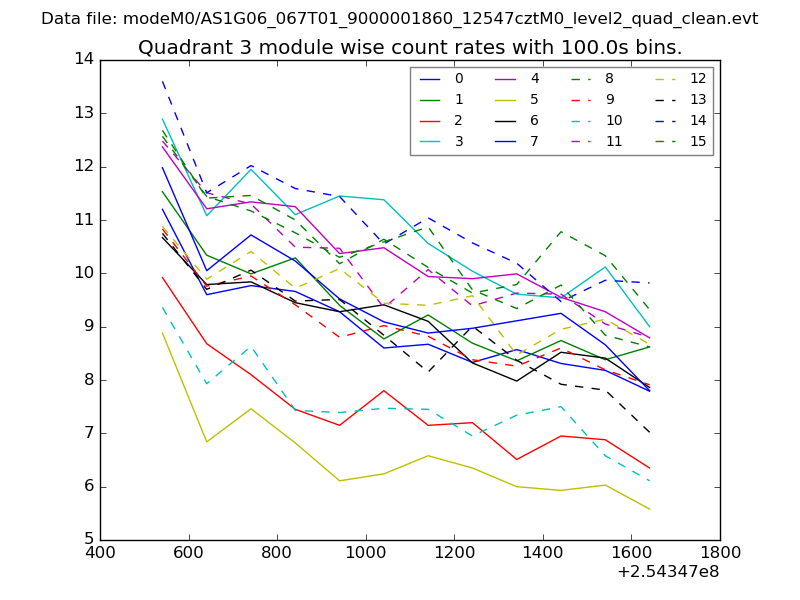 |
 |
| Parameter | Plot |
|---|---|
| CZT HV Monitor | 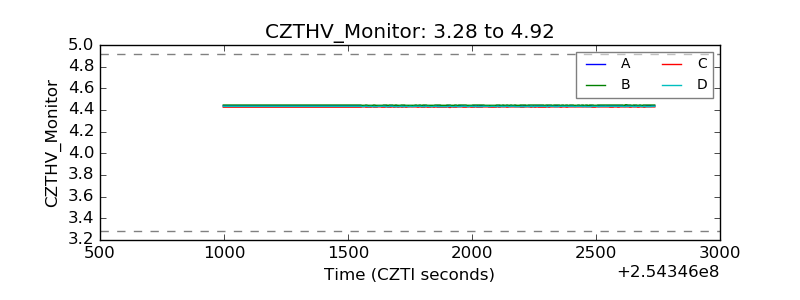 |
| D_VDD | 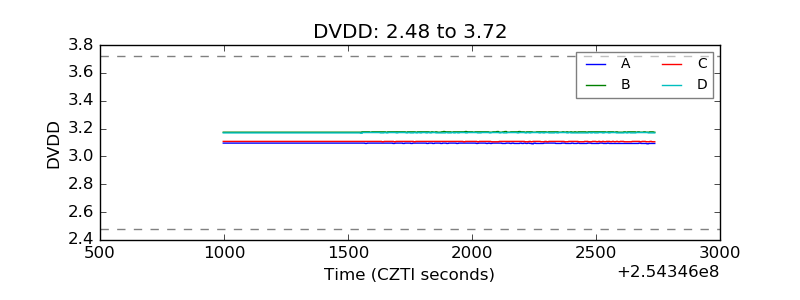 |
| Temperature 1 | 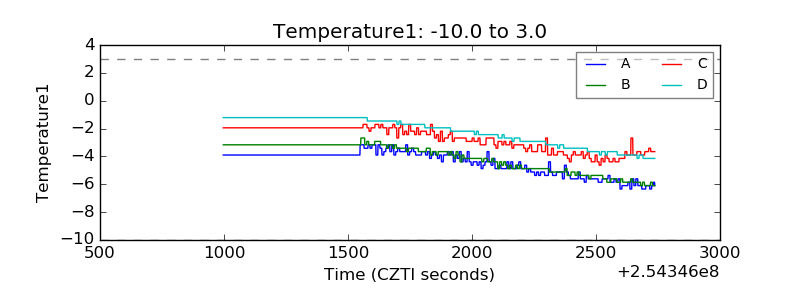 |
| Veto HV Monitor | 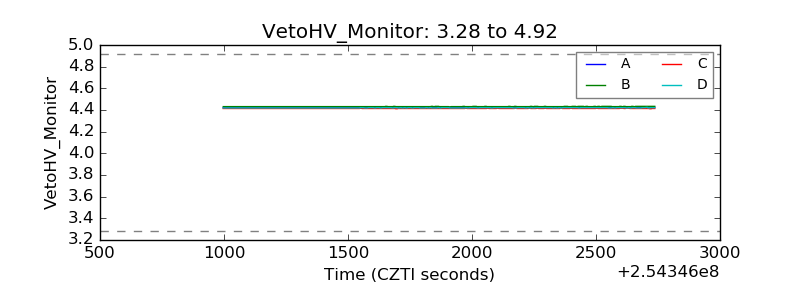 |
| Veto LLD | 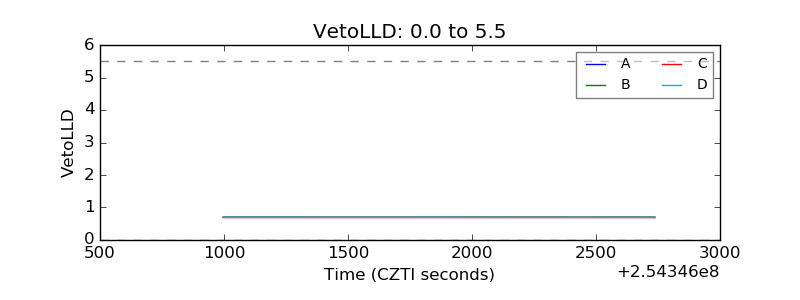 |
| Alpha Counter | 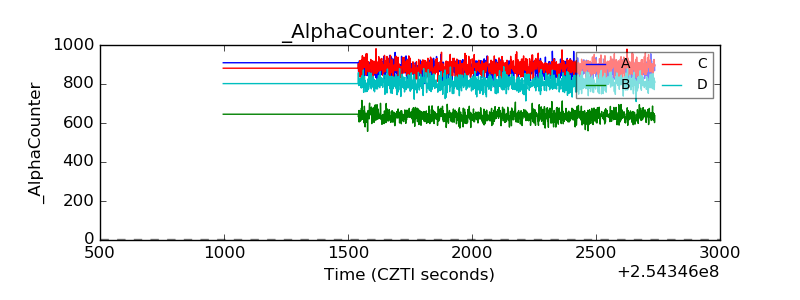 |
| _CPM_Rate | 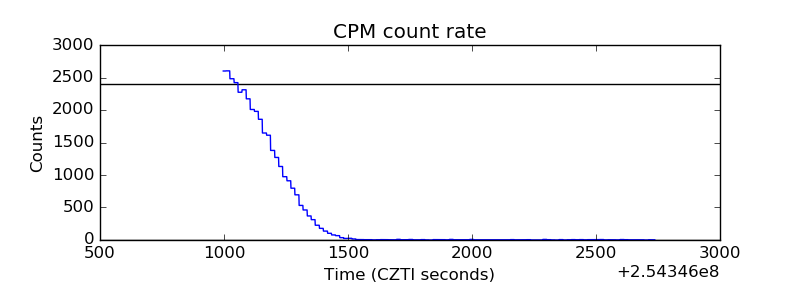 |
| CZT Counter | 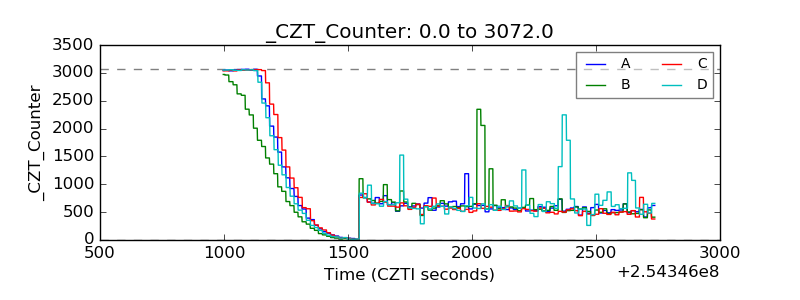 |
| +2.5 Volts monitor |  |
| +5 Volts monitor |  |
| _ROLL_ROT |  |
| _Roll_DEC | 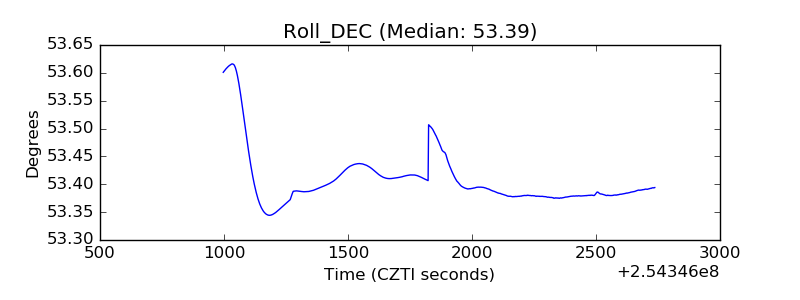 |
| _Roll_RA | 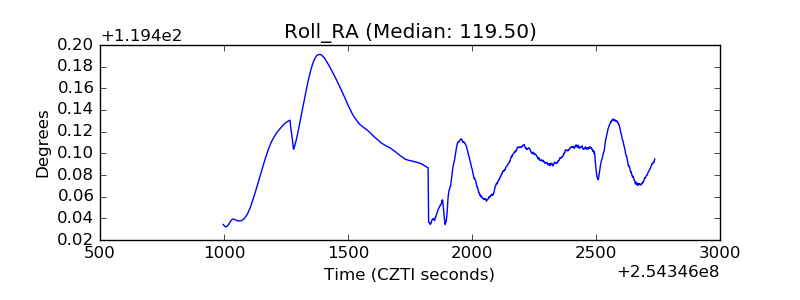 |
| Veto Counter | 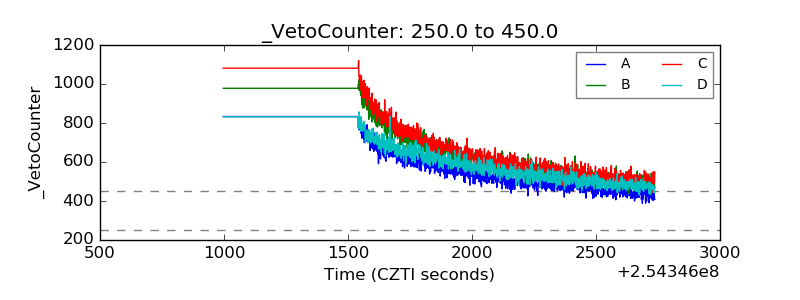 |