| Param | Original file | Final file |
|---|---|---|
| Filename | modeM0/AS1G06_067T01_9000001860_12548cztM0_level2.evt | modeM0/AS1G06_067T01_9000001860_12548cztM0_level2_quad_clean.evt |
| Size (bytes) | 441,610,560 | 98,274,240 |
| Size | 421.2 MB | 93.7 MB |
| Events in quadrant A | 3,358,348 | 636,178 |
| Events in quadrant B | 3,195,110 | 661,035 |
| Events in quadrant C | 2,929,607 | 650,905 |
| Events in quadrant D | 3,478,532 | 603,949 |
| Mode M0 | |||
|---|---|---|---|
| Quadrant | BADHDUFLAG | Total packets | Discarded packets |
| A | 0 | 13730 | 3 |
| B | 0 | 13473 | 2 |
| C | 0 | 12818 | 2 |
| D | 0 | 14553 | 2 |
| Mode SS | |||
|---|---|---|---|
| Quadrant | BADHDUFLAG | Total packets | Discarded packets |
| A | 0 | 124 | 0 |
| B | 0 | 124 | 0 |
| C | 0 | 124 | 0 |
| D | 0 | 124 | 0 |
| Mode M9 | |||
|---|---|---|---|
| Quadrant | BADHDUFLAG | Total packets | Discarded packets |
| A | 0 | 19 | 0 |
| B | 0 | 19 | 0 |
| C | 0 | 19 | 0 |
| D | 0 | 19 | 0 |
| Quadrant | Total seconds | Saturated seconds | Saturation percentage |
|---|---|---|---|
| A | 6072 | 28 | 0.461133% |
| B | 6072 | 55 | 0.905797% |
| C | 6072 | 27 | 0.444664% |
| D | 6072 | 53 | 0.872859% |
Noise dominated data is calculated using 1-second bins in cleaned event files. If a bin has >2000 counts, and if more than 50% of those come from <1% of pixels, then it is considered to be noise-dominated and hence unusable.
| Quadrant | # 1 sec bins | Bins with >0 counts | Bins with >2000 counts | High rate bins dominated by noise | Noise dominated (total time) | Noise dominated (detector-on time) | Marked lightcurve |
|---|---|---|---|---|---|---|---|
| A | 7408 | 6073 | 0 | 0 | 0.00% | 0.00% | 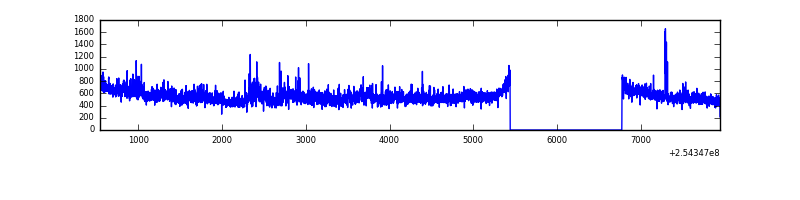 |
| B | 7408 | 6074 | 11 | 11 | 0.15% | 0.18% | 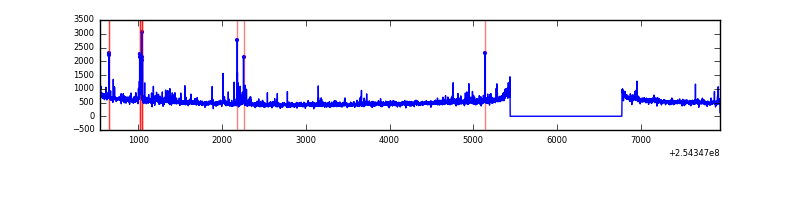 |
| C | 7408 | 6074 | 0 | 0 | 0.00% | 0.00% | 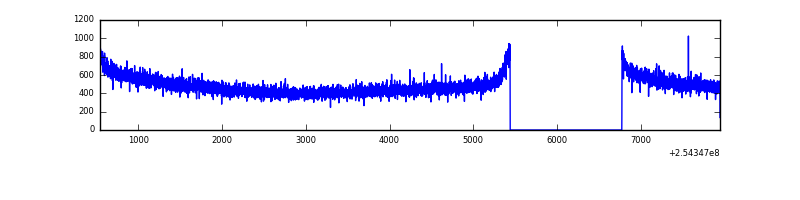 |
| D | 7408 | 6074 | 26 | 26 | 0.35% | 0.43% | 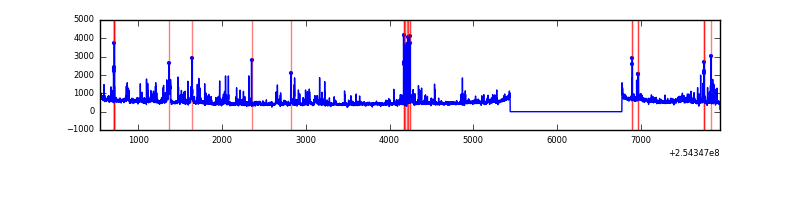 |
Top three noisy pixels from each quadrant. If the there are fewer than three noisy pixels in the level2.evt file, extra rows are filled as -1
| Pixel properties | Quadrant properties | ||||||
|---|---|---|---|---|---|---|---|
| Quadrant | DetID | PixID | Counts | Sigma | Mean | Median | Sigma |
| A | 0 | 23 | 128493 | 843.36 | 751 | 737 | 151.5 |
| A | 1 | 162 | 111213 | 729.29 | 751 | 737 | 151.5 |
| A | 8 | 15 | 68072 | 444.5 | 751 | 737 | 151.5 |
| B | 4 | 239 | 107455 | 759.7 | 765 | 746 | 140.5 |
| B | 11 | 51 | 38941 | 271.92 | 765 | 746 | 140.5 |
| B | 0 | 205 | 21026 | 144.38 | 765 | 746 | 140.5 |
| C | 13 | 61 | 5344 | 26.8 | 749 | 753 | 171.3 |
| C | 9 | 221 | 4886 | 24.13 | 749 | 753 | 171.3 |
| C | 3 | 233 | 3071 | 13.53 | 749 | 753 | 171.3 |
| D | 1 | 52 | 436698 | 2526.34 | 731 | 710 | 172.6 |
| D | 8 | 195 | 126182 | 727.05 | 731 | 710 | 172.6 |
| D | 2 | 14 | 50367 | 287.74 | 731 | 710 | 172.6 |
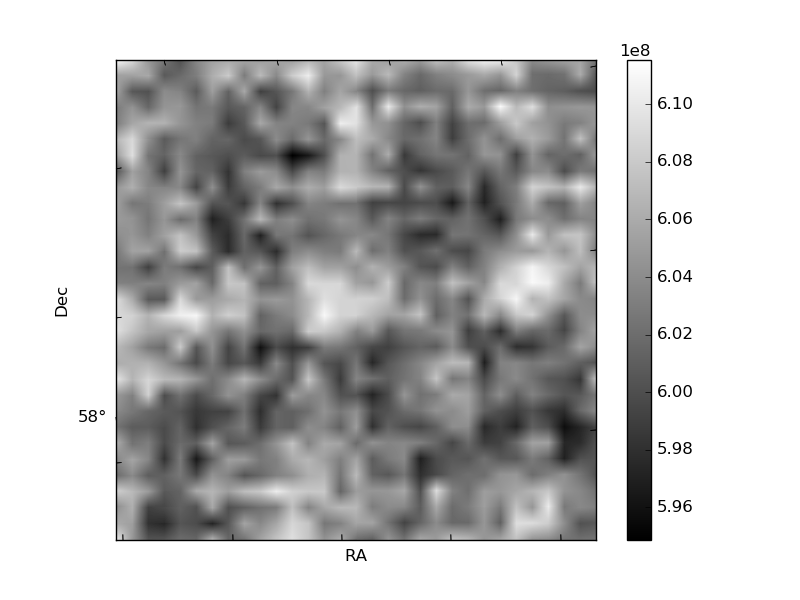
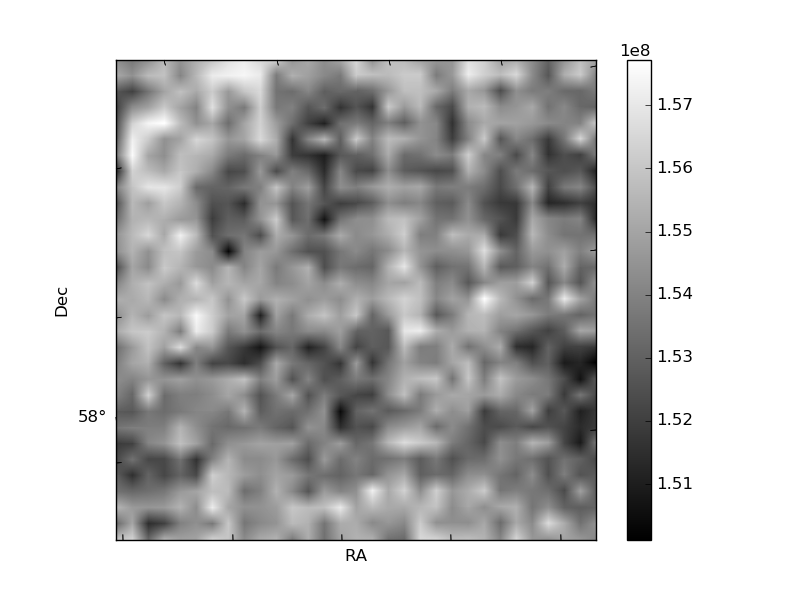
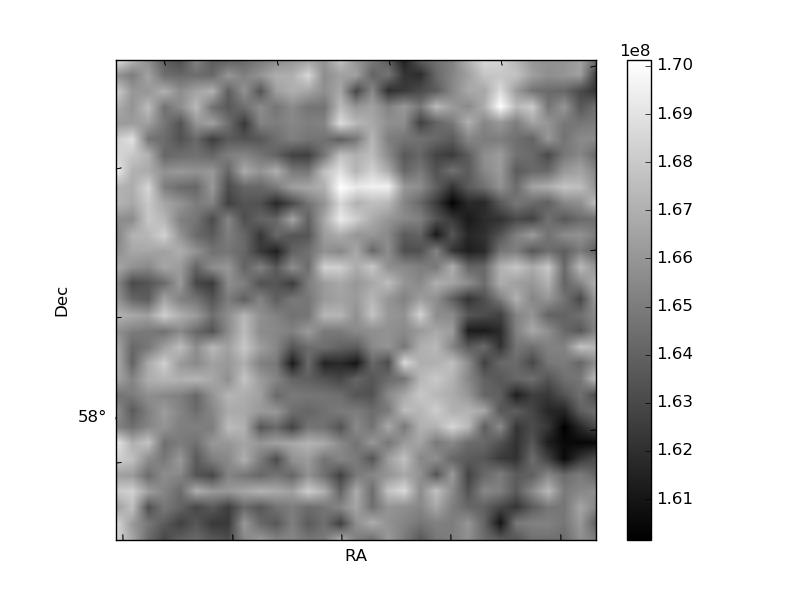
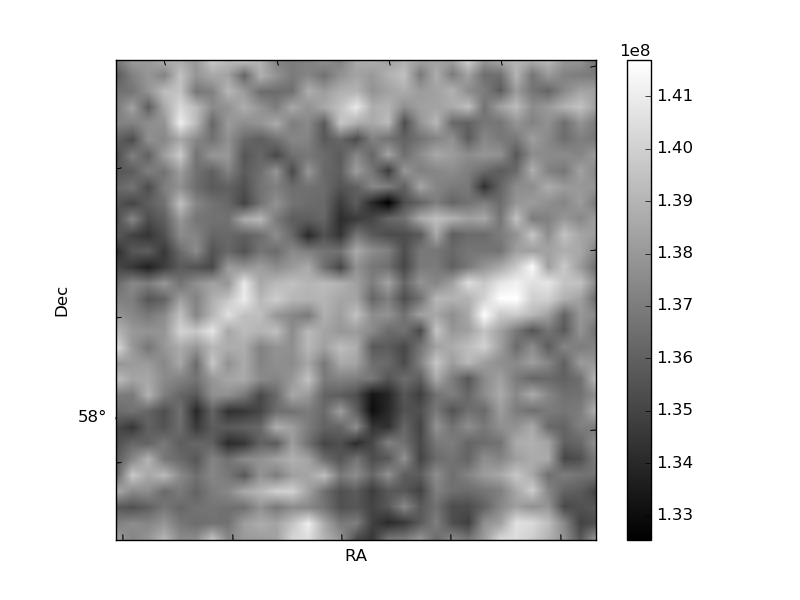
Histogram calculated using DETX and DETY for each event in the final _common_clean file
| Quadrant A | 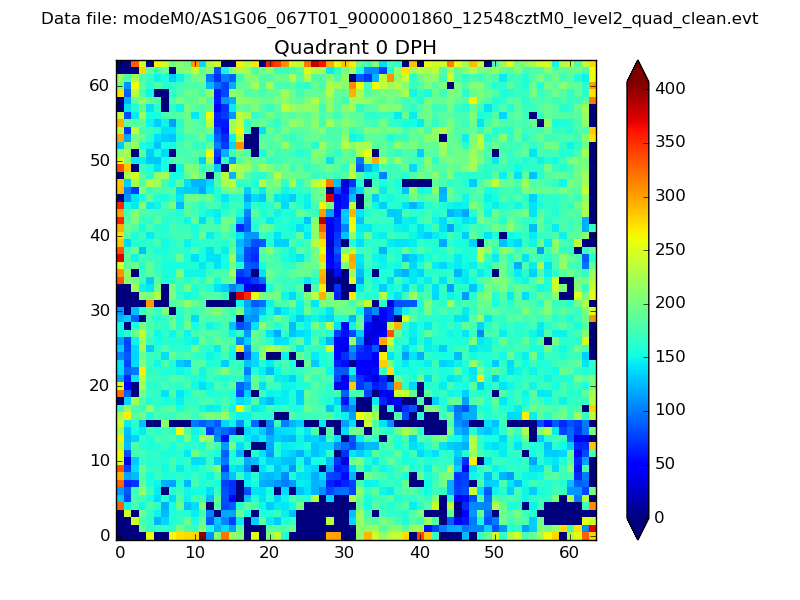 |
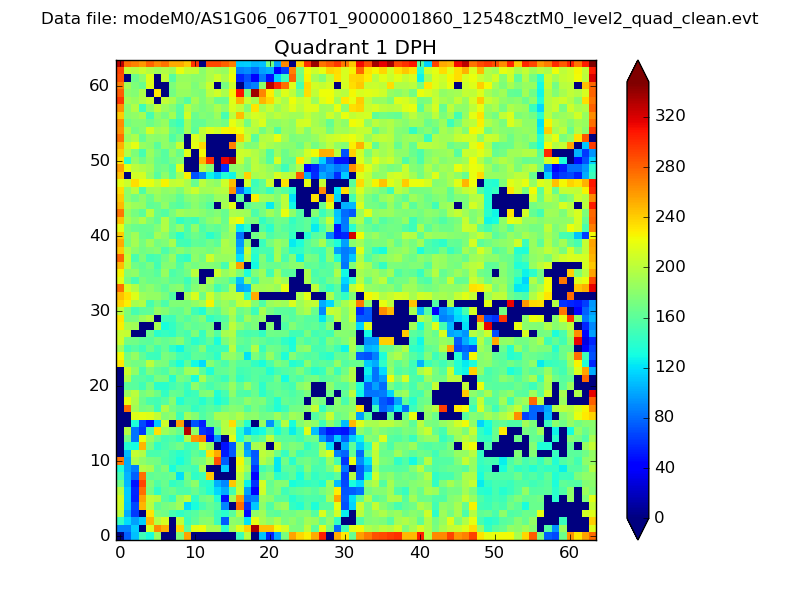 |
Quadrant B |
|---|---|---|---|
| Quadrant D | 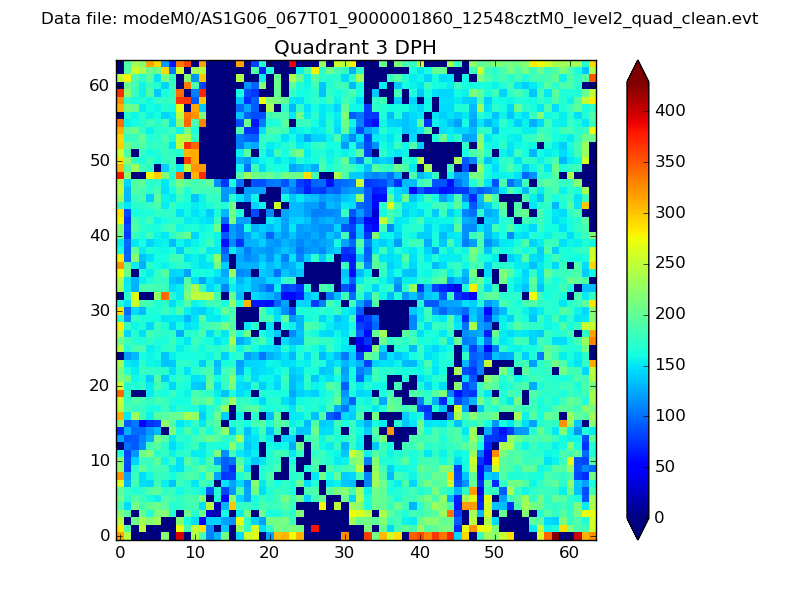 |
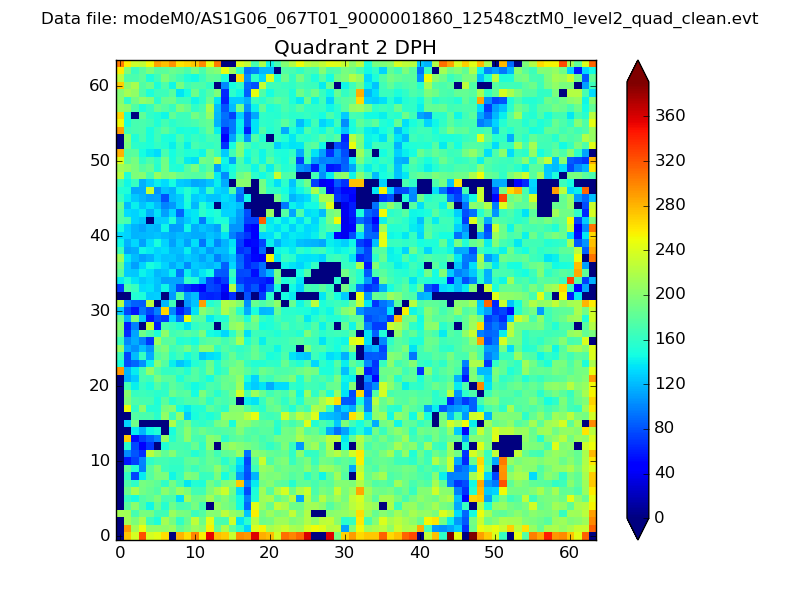 |
Quadrant C |
| Plot type | Count rate plots | Images |
|---|---|---|
| Comparison with Poisson distribution Blue bars denote a histogram of data divided into 1 sec bins. Red curve is a Poisson curve with rate = median count rate of data. |
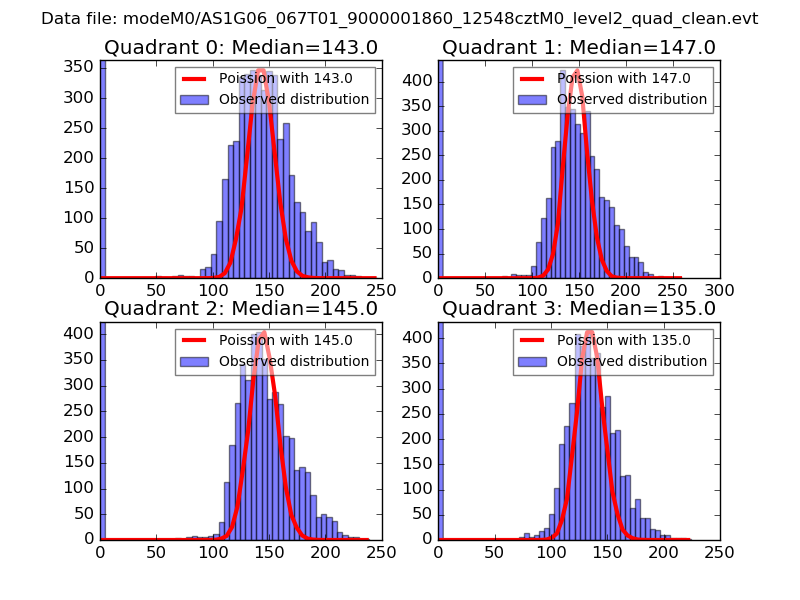 |
 |
| Quadrant-wise count rates Data is divided into 100 sec bins |
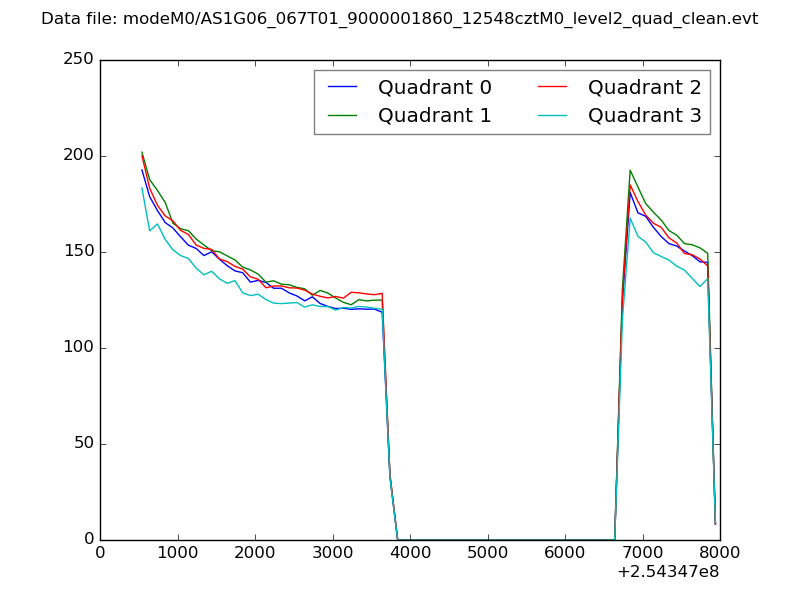 |
|
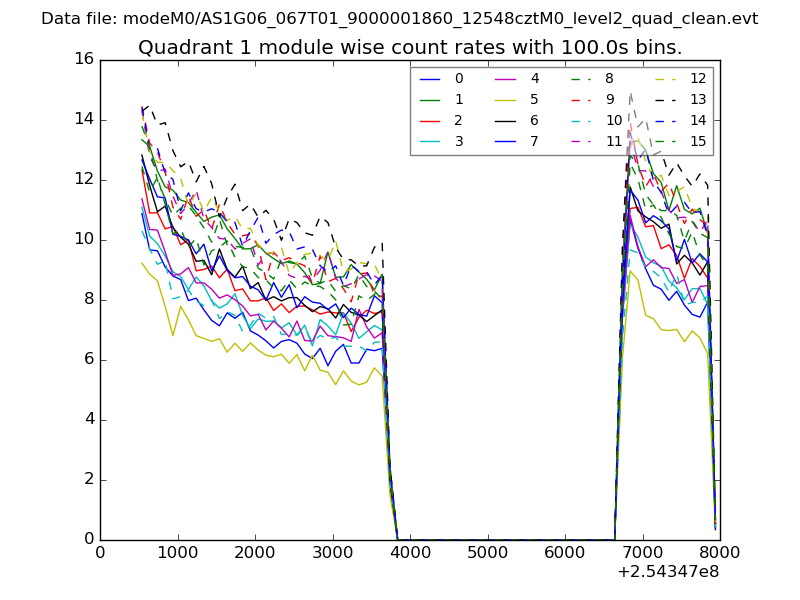
| Module-wise count rates for Quadrant A Data is divided into 100 sec bins |
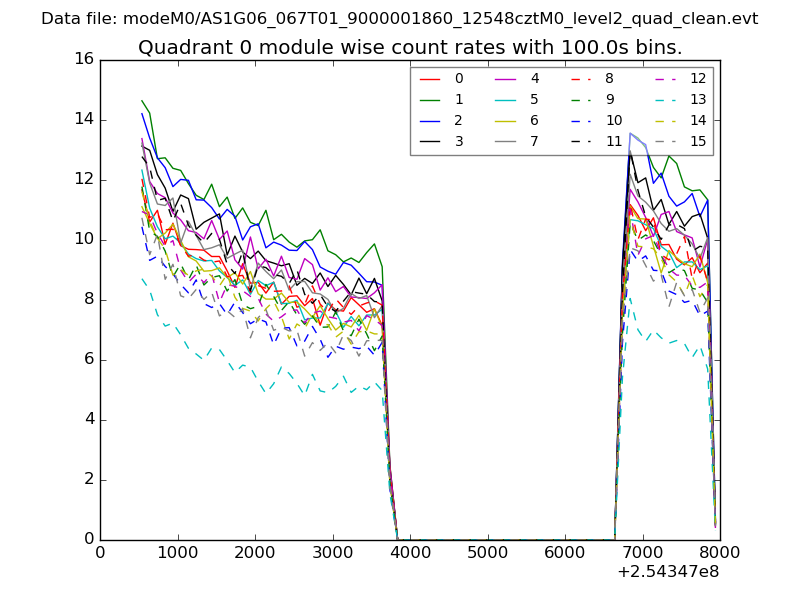 |
 |
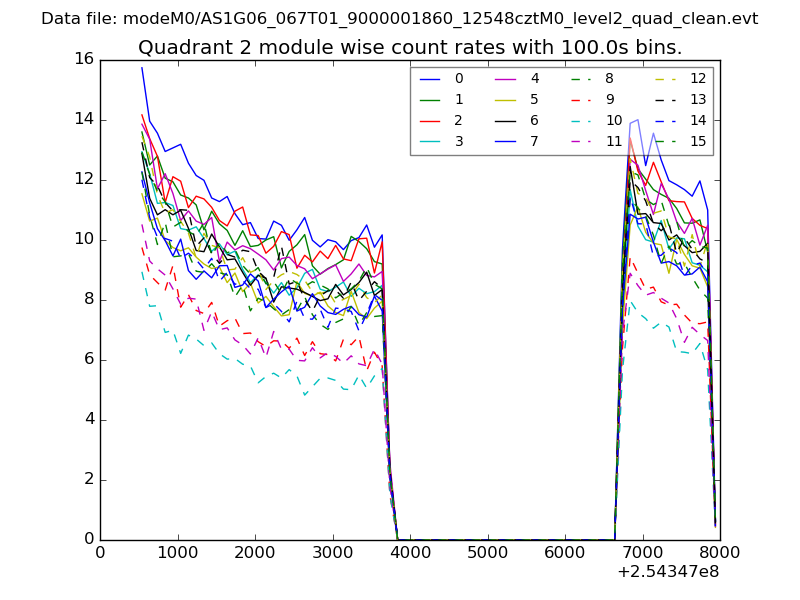
| Module-wise count rates for Quadrant B Data is divided into 100 sec bins |
 |
 |
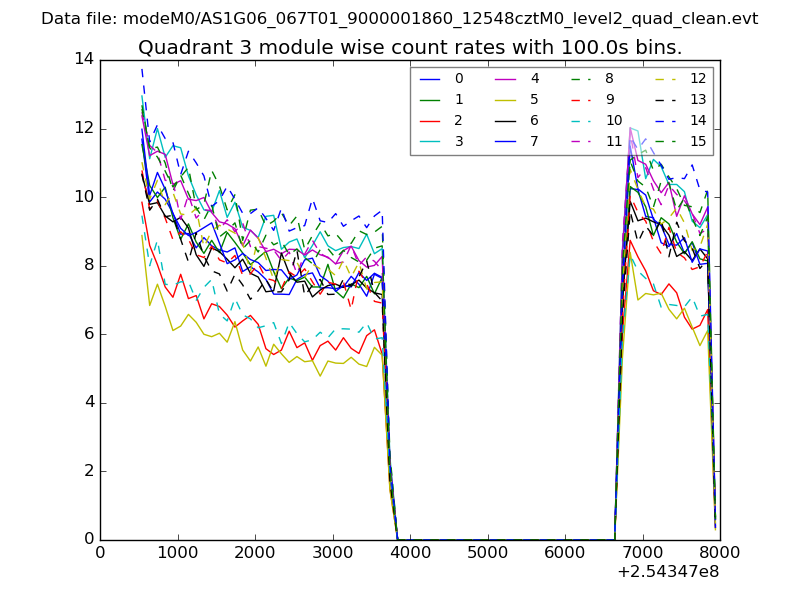
| Module-wise count rates for Quadrant C Data is divided into 100 sec bins |
 |
 |
| Module-wise count rates for Quadrant D Data is divided into 100 sec bins |
 |
 |
| Parameter | Plot |
|---|---|
| CZT HV Monitor | 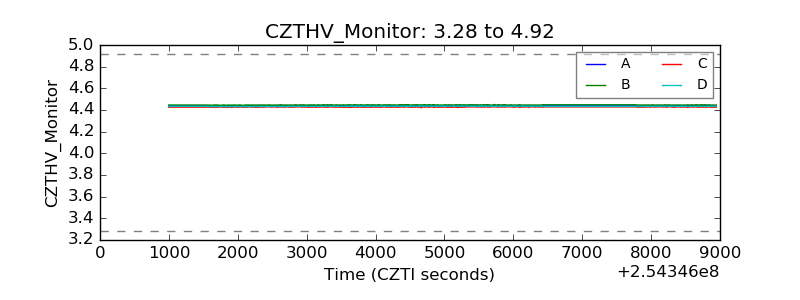 |
| D_VDD | 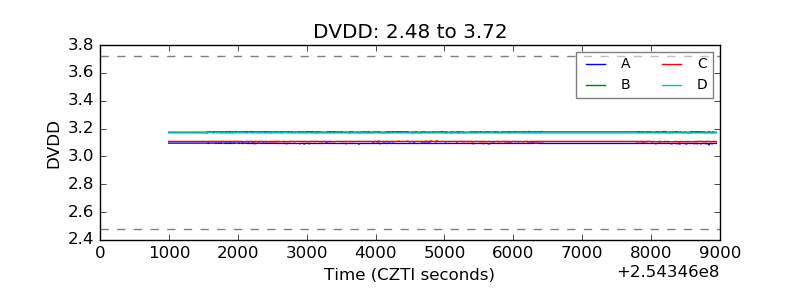 |
| Temperature 1 |  |
| Veto HV Monitor | 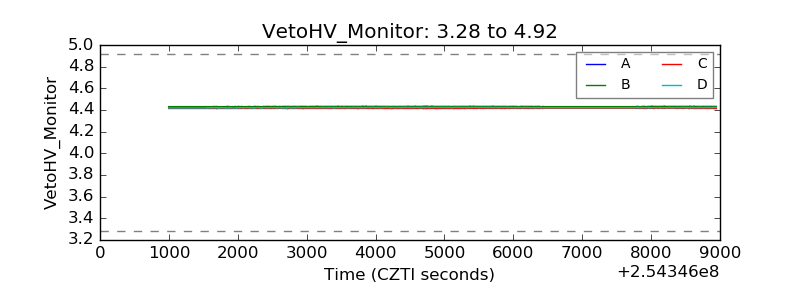 |
| Veto LLD | 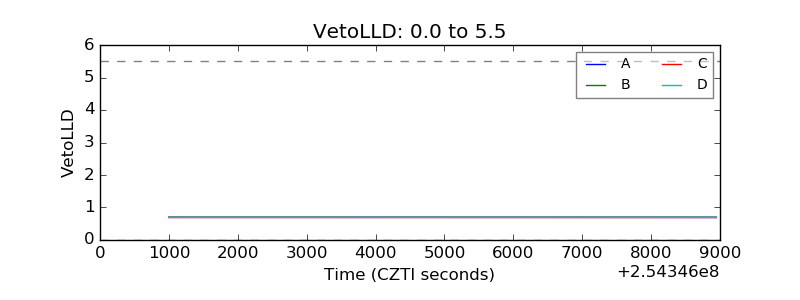 |
| Alpha Counter | 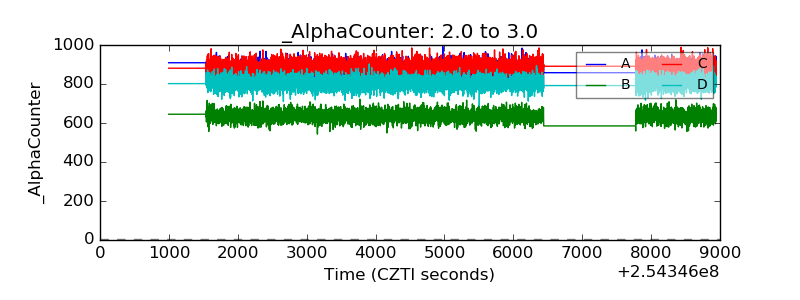 |
| _CPM_Rate | 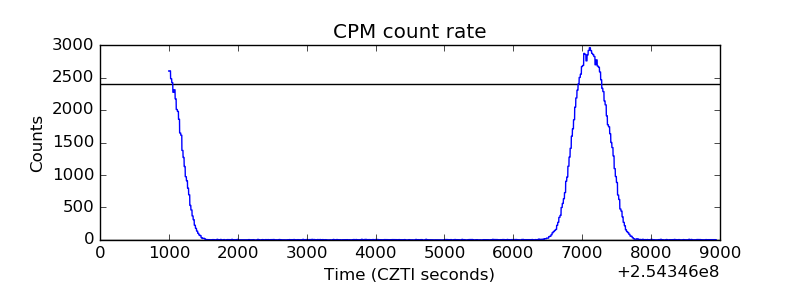 |
| CZT Counter | 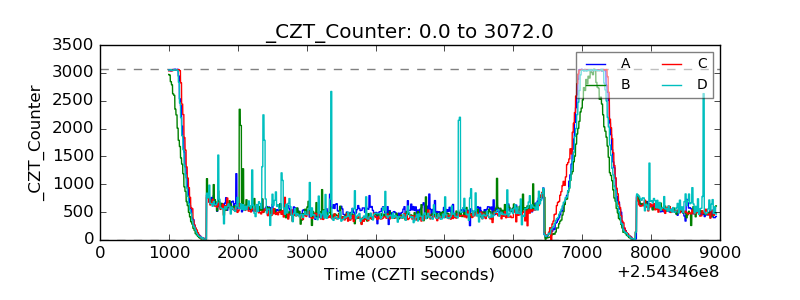 |
| +2.5 Volts monitor |  |
| +5 Volts monitor |  |
| _ROLL_ROT | 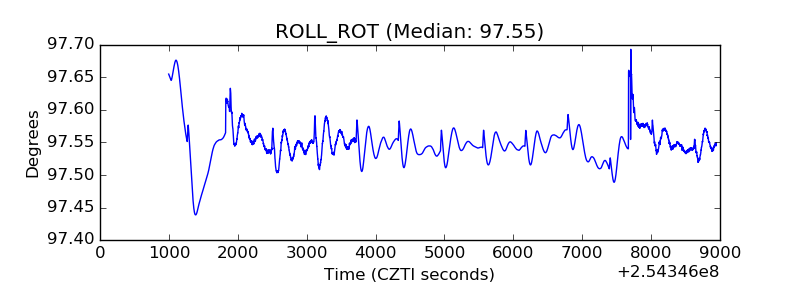 |
| _Roll_DEC | 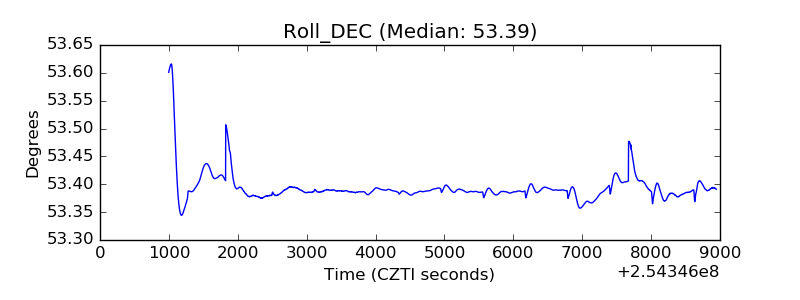 |
| _Roll_RA | 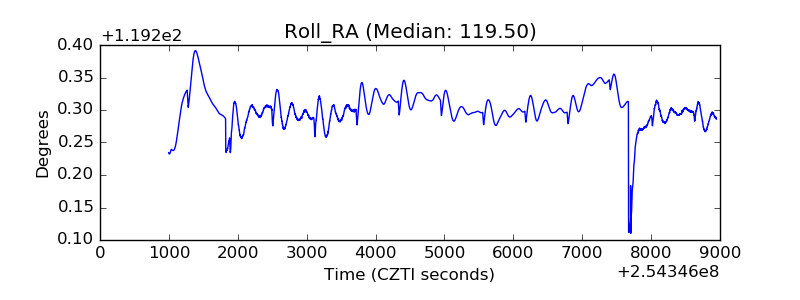 |
| Veto Counter | 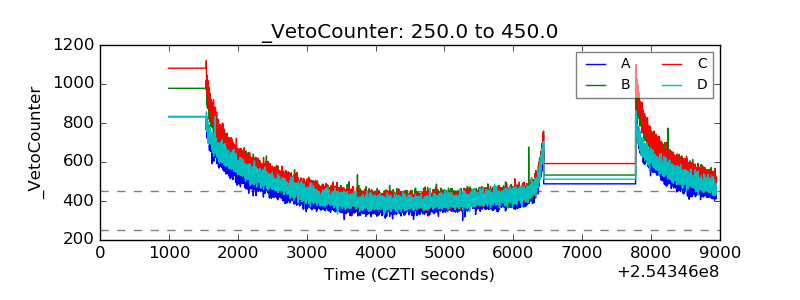 |