| Param | Original file | Final file |
|---|---|---|
| Filename | modeM0/AS1G06_067T01_9000001860_12551cztM0_level2.evt | modeM0/AS1G06_067T01_9000001860_12551cztM0_level2_quad_clean.evt |
| Size (bytes) | 407,280,960 | 90,267,840 |
| Size | 388.4 MB | 86.1 MB |
| Events in quadrant A | 2,995,879 | 584,803 |
| Events in quadrant B | 3,115,704 | 601,442 |
| Events in quadrant C | 2,809,046 | 581,730 |
| Events in quadrant D | 3,002,490 | 543,273 |
| Mode M0 | |||
|---|---|---|---|
| Quadrant | BADHDUFLAG | Total packets | Discarded packets |
| A | 0 | 12805 | 2 |
| B | 0 | 13184 | 2 |
| C | 0 | 12487 | 2 |
| D | 0 | 13176 | 2 |
| Mode SS | |||
|---|---|---|---|
| Quadrant | BADHDUFLAG | Total packets | Discarded packets |
| A | 0 | 122 | 0 |
| B | 0 | 122 | 0 |
| C | 0 | 122 | 0 |
| D | 0 | 122 | 0 |
| Mode M9 | |||
|---|---|---|---|
| Quadrant | BADHDUFLAG | Total packets | Discarded packets |
| A | 0 | 25 | 0 |
| B | 0 | 25 | 0 |
| C | 0 | 25 | 0 |
| D | 0 | 26 | 0 |
| Quadrant | Total seconds | Saturated seconds | Saturation percentage |
|---|---|---|---|
| A | 6052 | 42 | 0.693985% |
| B | 6052 | 71 | 1.173166% |
| C | 6052 | 29 | 0.479180% |
| D | 6052 | 60 | 0.991408% |
Noise dominated data is calculated using 1-second bins in cleaned event files. If a bin has >2000 counts, and if more than 50% of those come from <1% of pixels, then it is considered to be noise-dominated and hence unusable.
| Quadrant | # 1 sec bins | Bins with >0 counts | Bins with >2000 counts | High rate bins dominated by noise | Noise dominated (total time) | Noise dominated (detector-on time) | Marked lightcurve |
|---|---|---|---|---|---|---|---|
| A | 7328 | 6054 | 1 | 1 | 0.01% | 0.02% |  |
| B | 7328 | 6054 | 2 | 2 | 0.03% | 0.03% | 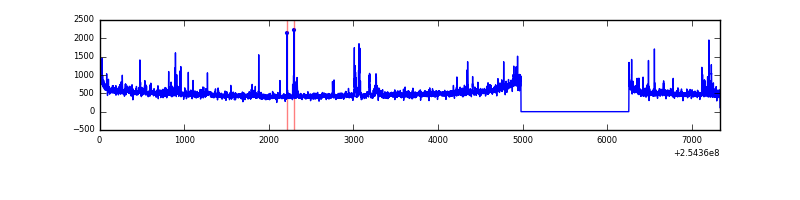 |
| C | 7328 | 6054 | 0 | 0 | 0.00% | 0.00% | 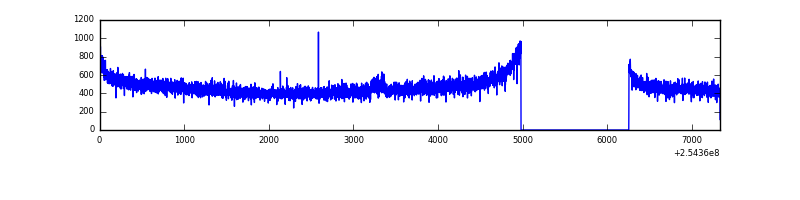 |
| D | 7328 | 6054 | 36 | 36 | 0.49% | 0.59% | 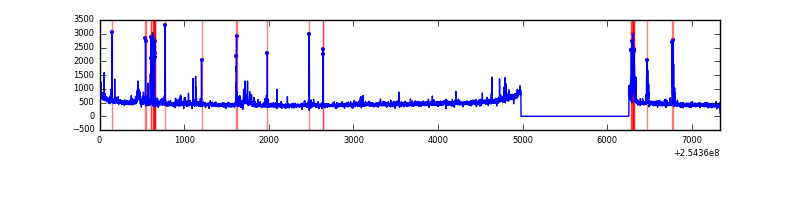 |
Top three noisy pixels from each quadrant. If the there are fewer than three noisy pixels in the level2.evt file, extra rows are filled as -1
| Pixel properties | Quadrant properties | ||||||
|---|---|---|---|---|---|---|---|
| Quadrant | DetID | PixID | Counts | Sigma | Mean | Median | Sigma |
| A | 1 | 162 | 77685 | 524.33 | 731 | 717 | 146.8 |
| A | 1 | 178 | 37462 | 250.32 | 731 | 717 | 146.8 |
| A | 1 | 161 | 32122 | 213.94 | 731 | 717 | 146.8 |
| B | 4 | 239 | 70823 | 509.57 | 740 | 723 | 137.6 |
| B | 0 | 205 | 62482 | 448.94 | 740 | 723 | 137.6 |
| B | 11 | 51 | 46415 | 332.14 | 740 | 723 | 137.6 |
| C | 3 | 233 | 16003 | 93.18 | 716 | 721 | 164.0 |
| C | 13 | 61 | 5232 | 27.5 | 716 | 721 | 164.0 |
| C | 3 | 202 | 1756 | 6.31 | 716 | 721 | 164.0 |
| D | 13 | 104 | 122786 | 738.81 | 699 | 679 | 165.3 |
| D | 8 | 195 | 70014 | 419.51 | 699 | 679 | 165.3 |
| D | 13 | 249 | 69980 | 419.31 | 699 | 679 | 165.3 |
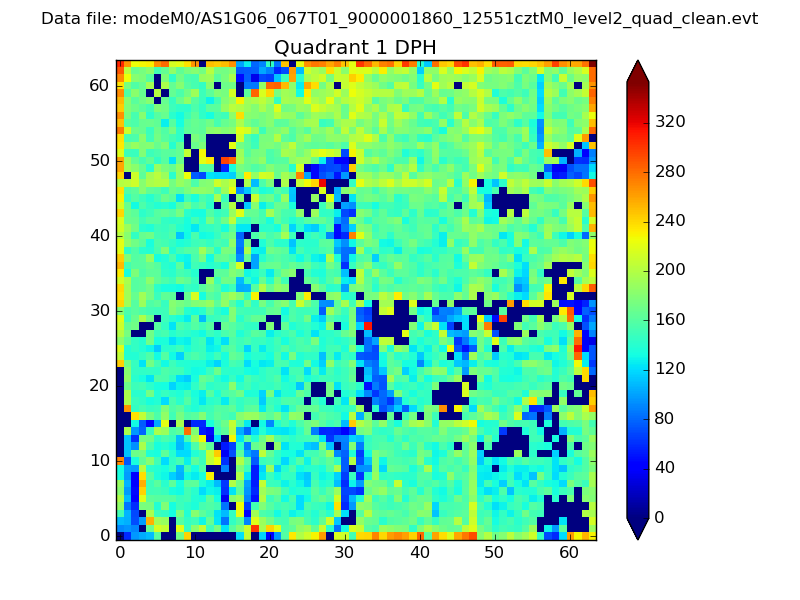
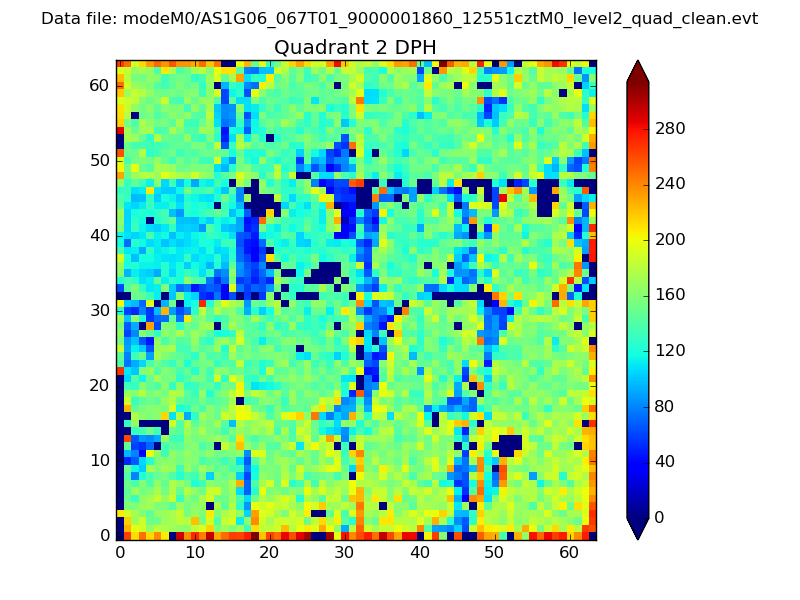
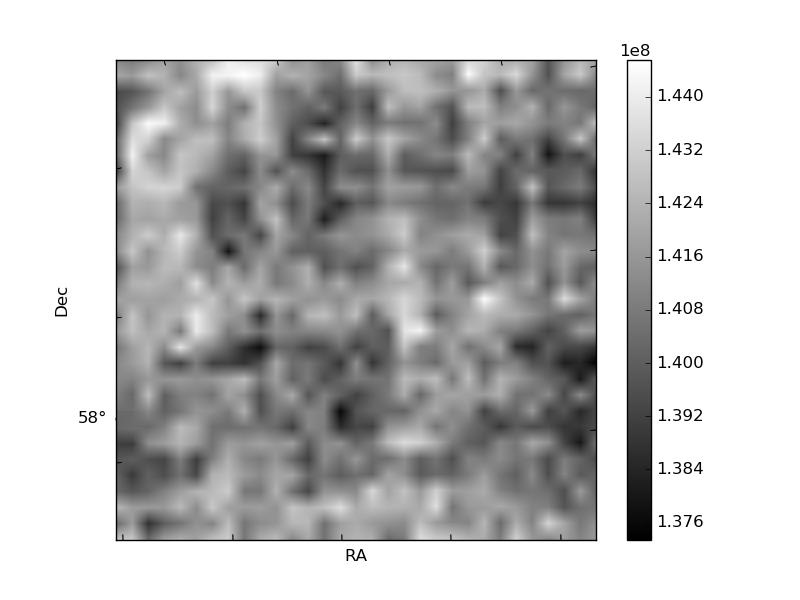
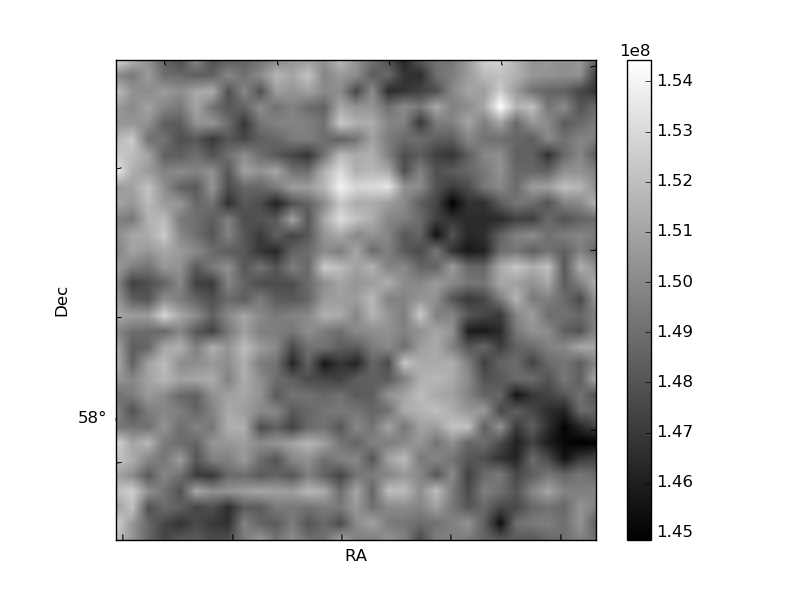
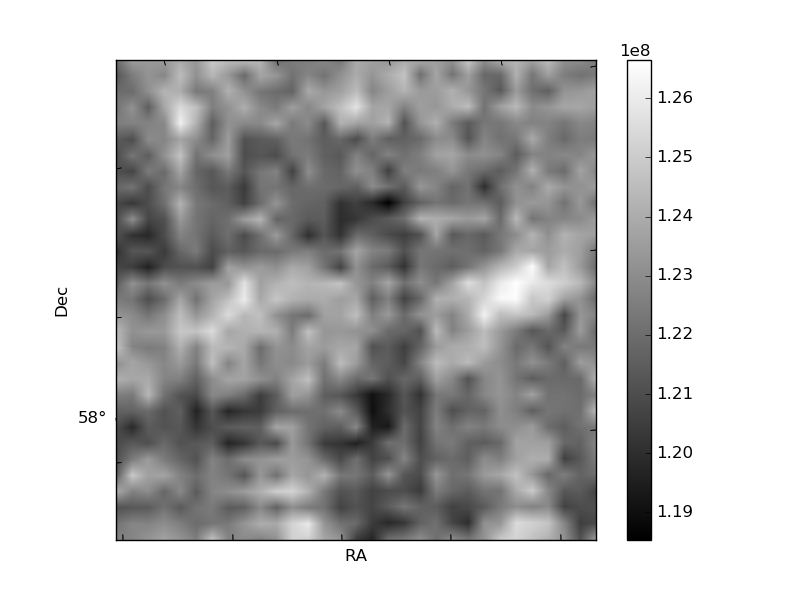
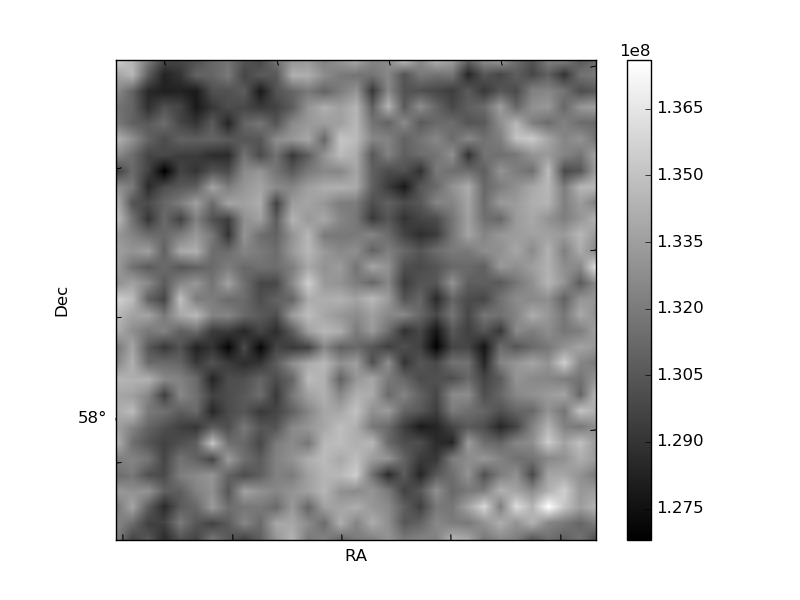
Histogram calculated using DETX and DETY for each event in the final _common_clean file
| Quadrant A | 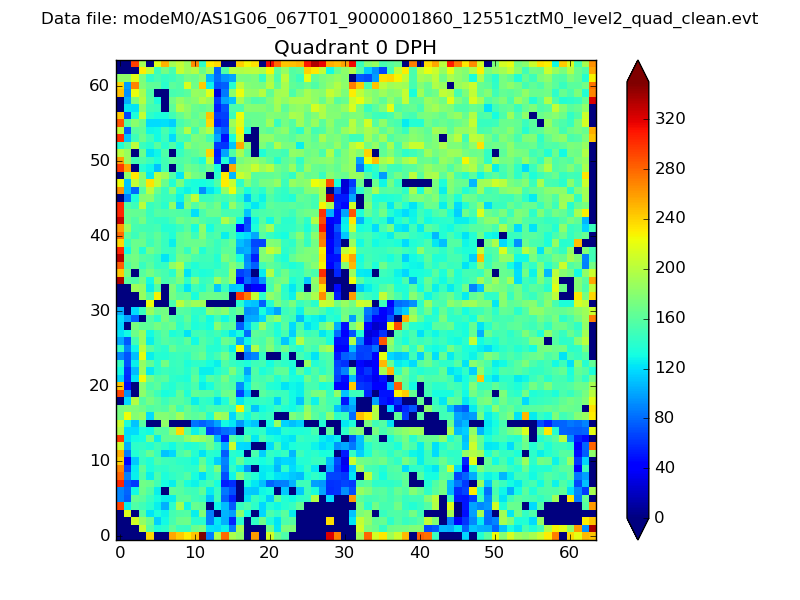 |
 |
Quadrant B |
|---|---|---|---|
| Quadrant D | 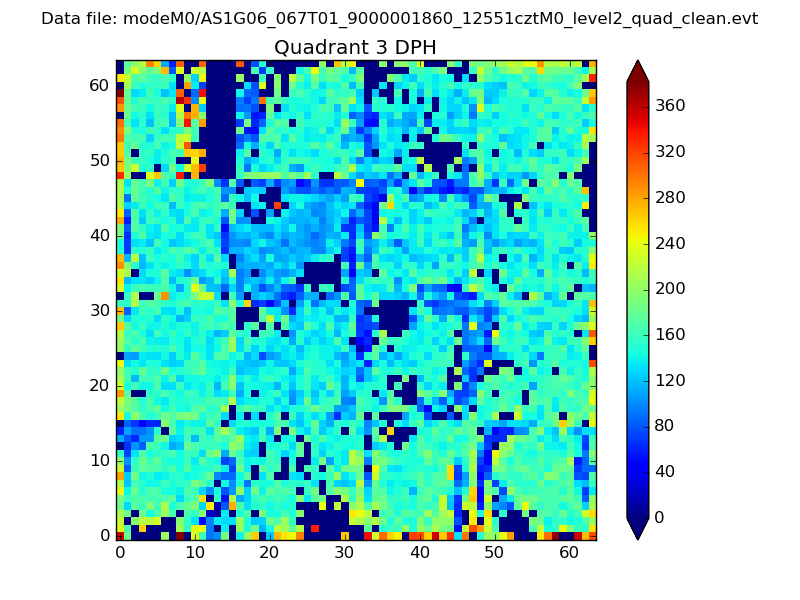 |
 |
Quadrant C |
| Plot type | Count rate plots | Images |
|---|---|---|
| Comparison with Poisson distribution Blue bars denote a histogram of data divided into 1 sec bins. Red curve is a Poisson curve with rate = median count rate of data. |
 |
 |
| Quadrant-wise count rates Data is divided into 100 sec bins |
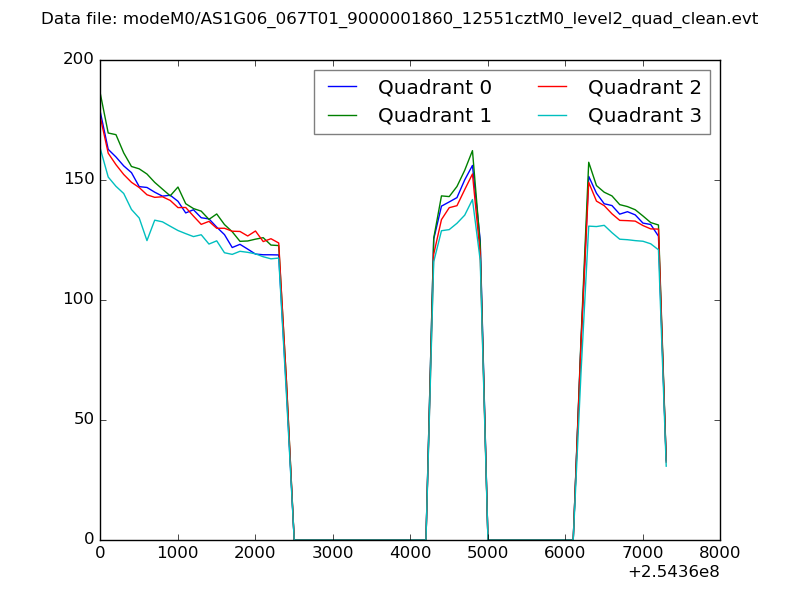 |
|
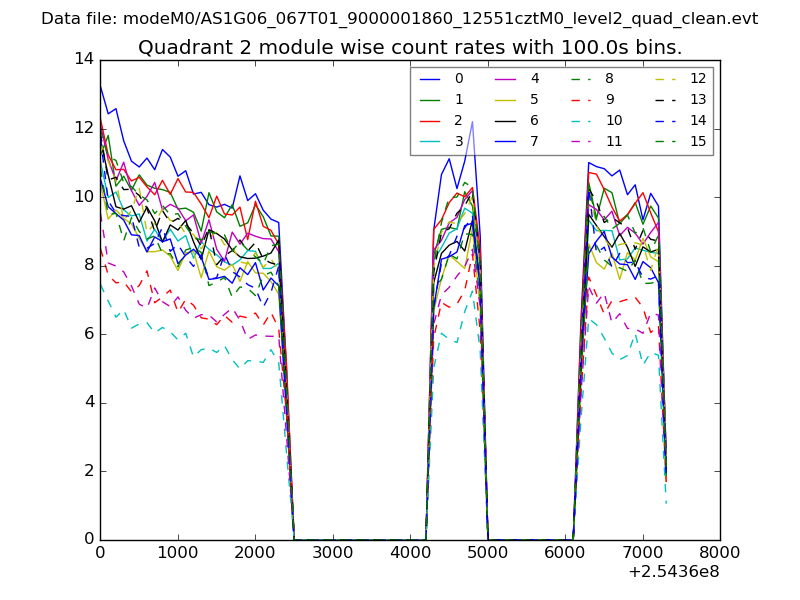
| Module-wise count rates for Quadrant A Data is divided into 100 sec bins |
 |
 |
| Module-wise count rates for Quadrant B Data is divided into 100 sec bins |
 |
 |
| Module-wise count rates for Quadrant C Data is divided into 100 sec bins |
 |
 |
| Module-wise count rates for Quadrant D Data is divided into 100 sec bins |
 |
 |
| Parameter | Plot |
|---|---|
| CZT HV Monitor |  |
| D_VDD | 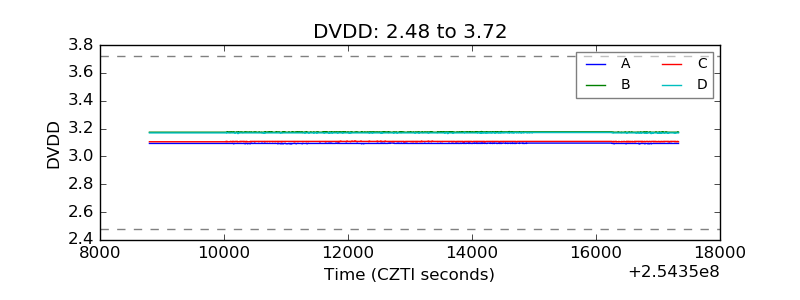 |
| Temperature 1 | 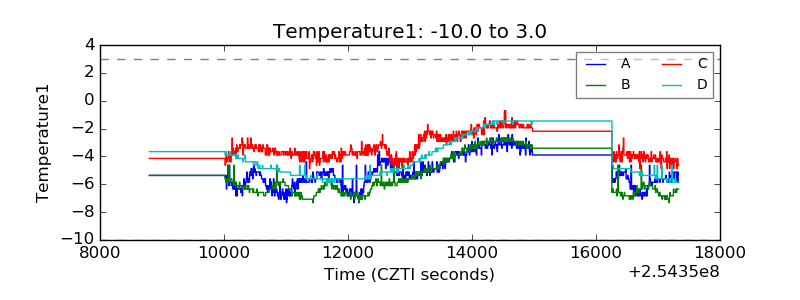 |
| Veto HV Monitor | 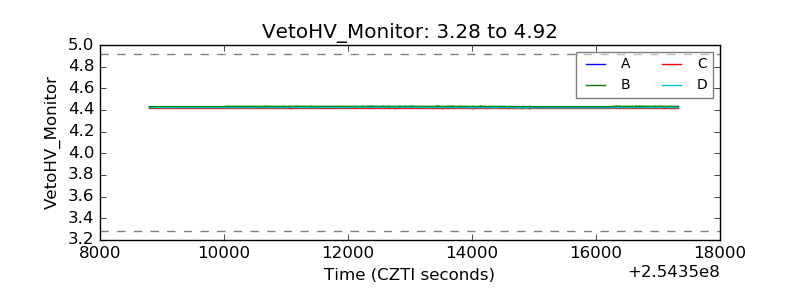 |
| Veto LLD | 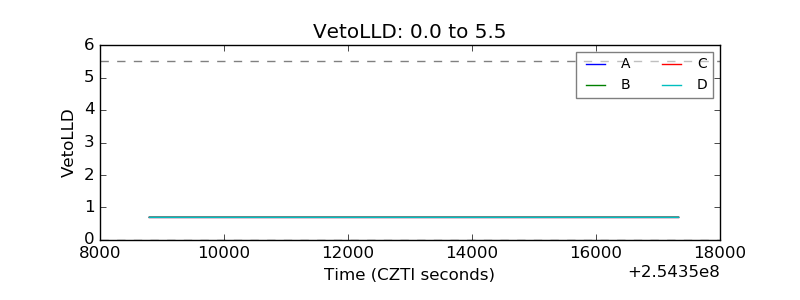 |
| Alpha Counter | 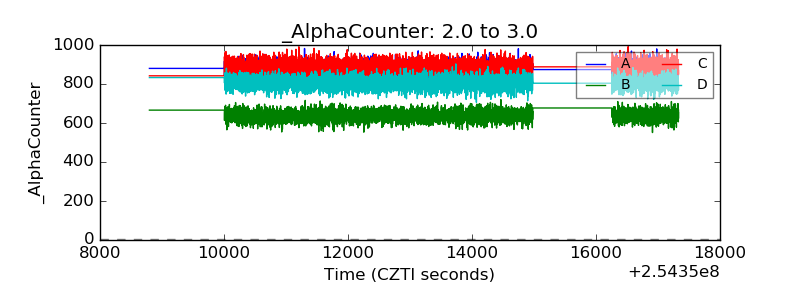 |
| _CPM_Rate | 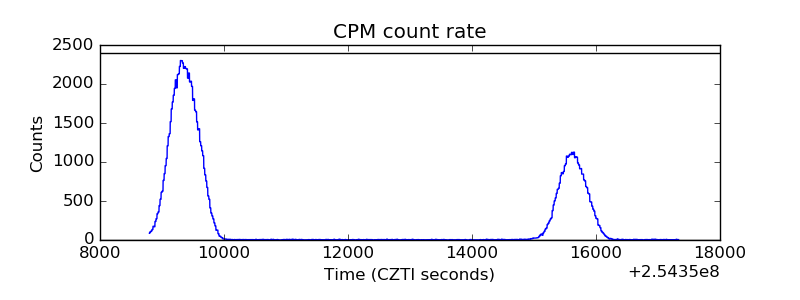 |
| CZT Counter | 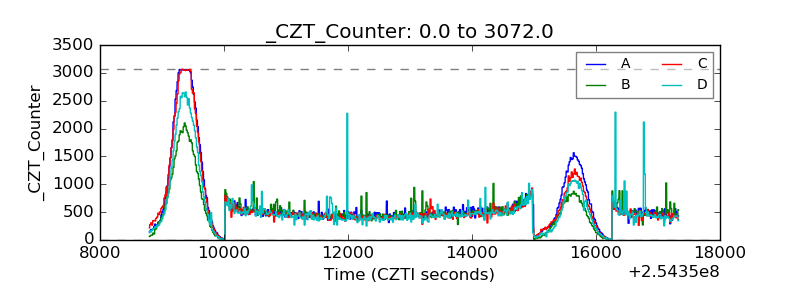 |
| +2.5 Volts monitor | 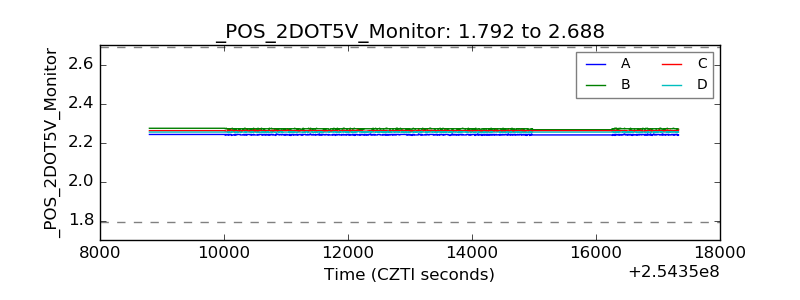 |
| +5 Volts monitor |  |
| _ROLL_ROT | 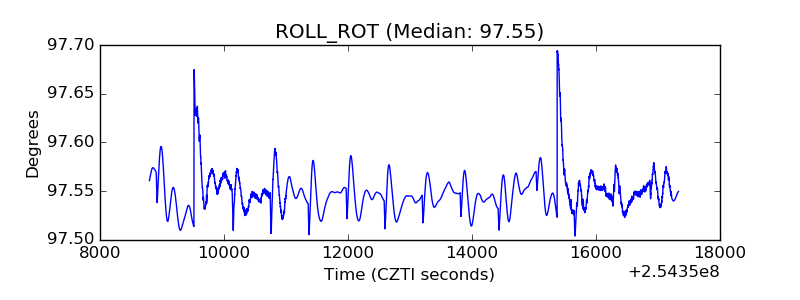 |
| _Roll_DEC | 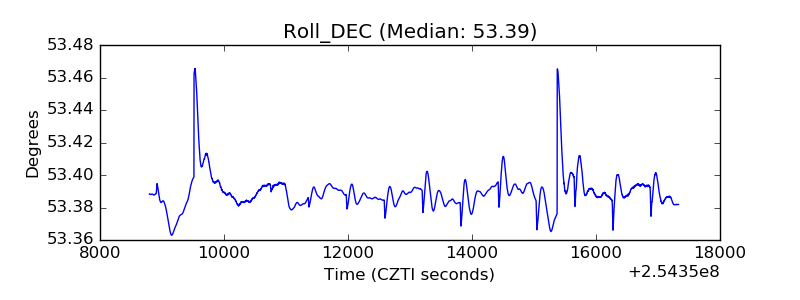 |
| _Roll_RA | 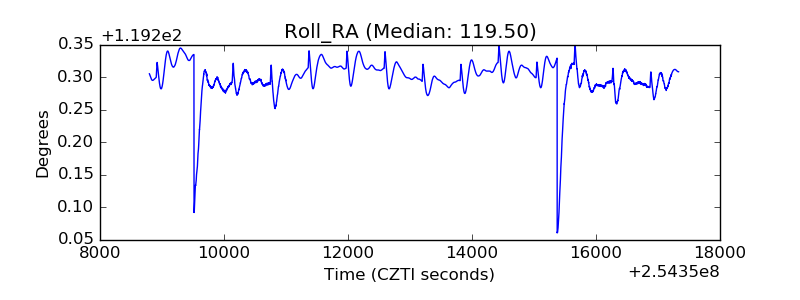 |
| Veto Counter |  |