| Param | Original file | Final file |
|---|---|---|
| Filename | modeM0/AS1A04_201T03_9000001862_12553cztM0_level2.evt | modeM0/AS1A04_201T03_9000001862_12553cztM0_level2_quad_clean.evt |
| Size (bytes) | 560,926,080 | 108,567,360 |
| Size | 534.9 MB | 103.5 MB |
| Events in quadrant A | 3,870,500 | 676,462 |
| Events in quadrant B | 4,214,708 | 698,062 |
| Events in quadrant C | 3,835,037 | 689,972 |
| Events in quadrant D | 4,508,943 | 651,683 |
| Mode SS | |||
|---|---|---|---|
| Quadrant | BADHDUFLAG | Total packets | Discarded packets |
| A | 0 | 168 | 0 |
| B | 0 | 168 | 0 |
| C | 0 | 168 | 0 |
| D | 0 | 168 | 0 |
| Mode M0 | |||
|---|---|---|---|
| Quadrant | BADHDUFLAG | Total packets | Discarded packets |
| A | 0 | 17125 | 2 |
| B | 0 | 17884 | 1 |
| C | 0 | 17115 | 1 |
| D | 0 | 19134 | 1 |
| Mode M9 | |||
|---|---|---|---|
| Quadrant | BADHDUFLAG | Total packets | Discarded packets |
| A | 0 | 5 | 0 |
| B | 0 | 5 | 0 |
| C | 0 | 5 | 0 |
| D | 0 | 5 | 0 |
| Quadrant | Total seconds | Saturated seconds | Saturation percentage |
|---|---|---|---|
| A | 8214 | 334 | 4.066228% |
| B | 8214 | 364 | 4.431458% |
| C | 8214 | 189 | 2.300950% |
| D | 8214 | 362 | 4.407110% |
Noise dominated data is calculated using 1-second bins in cleaned event files. If a bin has >2000 counts, and if more than 50% of those come from <1% of pixels, then it is considered to be noise-dominated and hence unusable.
| Quadrant | # 1 sec bins | Bins with >0 counts | Bins with >2000 counts | High rate bins dominated by noise | Noise dominated (total time) | Noise dominated (detector-on time) | Marked lightcurve |
|---|---|---|---|---|---|---|---|
| A | 8800 | 8216 | 0 | 0 | 0.00% | 0.00% | 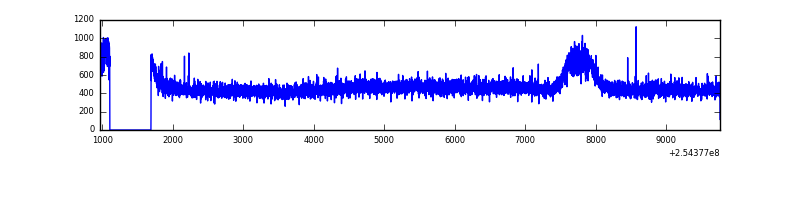 |
| B | 8800 | 8216 | 20 | 20 | 0.23% | 0.24% | 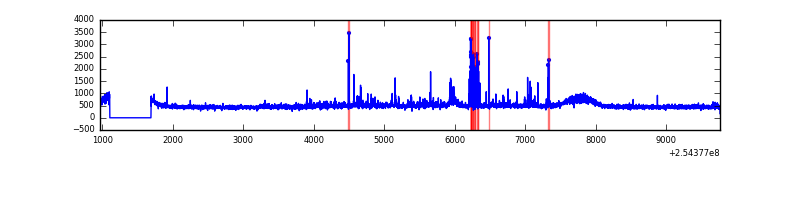 |
| C | 8800 | 8216 | 1 | 1 | 0.01% | 0.01% | 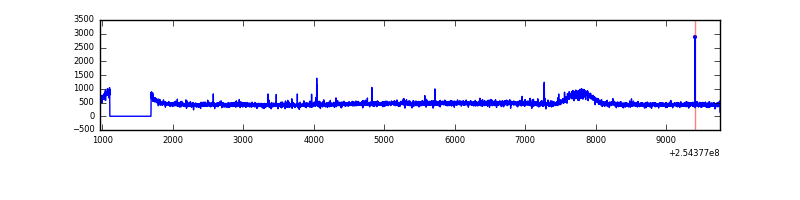 |
| D | 8800 | 8216 | 94 | 94 | 1.07% | 1.14% | 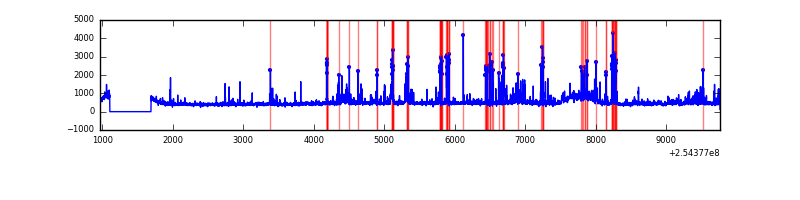 |
Top three noisy pixels from each quadrant. If the there are fewer than three noisy pixels in the level2.evt file, extra rows are filled as -1
| Pixel properties | Quadrant properties | ||||||
|---|---|---|---|---|---|---|---|
| Quadrant | DetID | PixID | Counts | Sigma | Mean | Median | Sigma |
| A | 8 | 15 | 19653 | 91.27 | 993 | 970 | 204.7 |
| A | 1 | 162 | 12027 | 54.02 | 993 | 970 | 204.7 |
| A | 12 | 189 | 9301 | 40.7 | 993 | 970 | 204.7 |
| B | 3 | 64 | 82167 | 423.66 | 992 | 965 | 191.7 |
| B | 0 | 214 | 68476 | 352.23 | 992 | 965 | 191.7 |
| B | 4 | 239 | 66085 | 339.75 | 992 | 965 | 191.7 |
| C | 3 | 233 | 45066 | 196.22 | 967 | 966 | 224.8 |
| C | 15 | 208 | 16174 | 67.67 | 967 | 966 | 224.8 |
| C | 13 | 61 | 7048 | 27.06 | 967 | 966 | 224.8 |
| D | 1 | 52 | 596365 | 2554.0 | 957 | 925 | 233.1 |
| D | 13 | 249 | 108613 | 461.9 | 957 | 925 | 233.1 |
| D | 8 | 195 | 55270 | 233.1 | 957 | 925 | 233.1 |
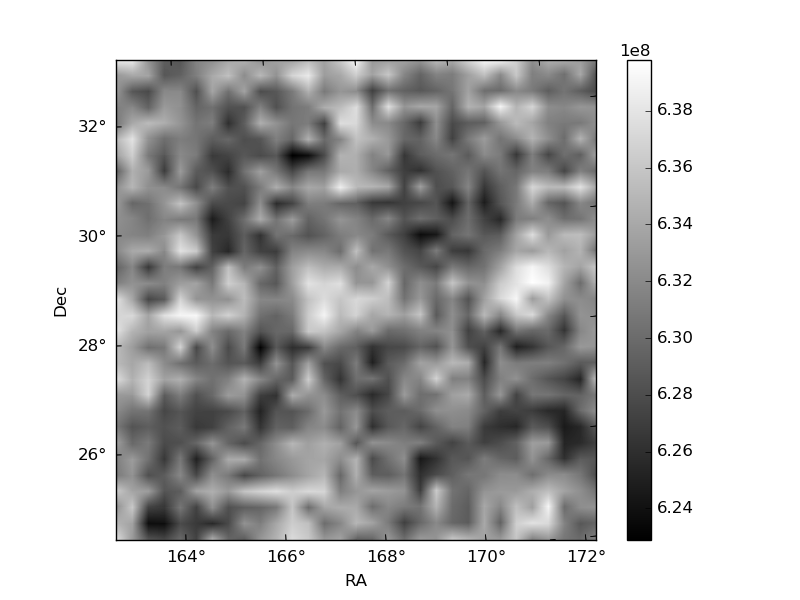
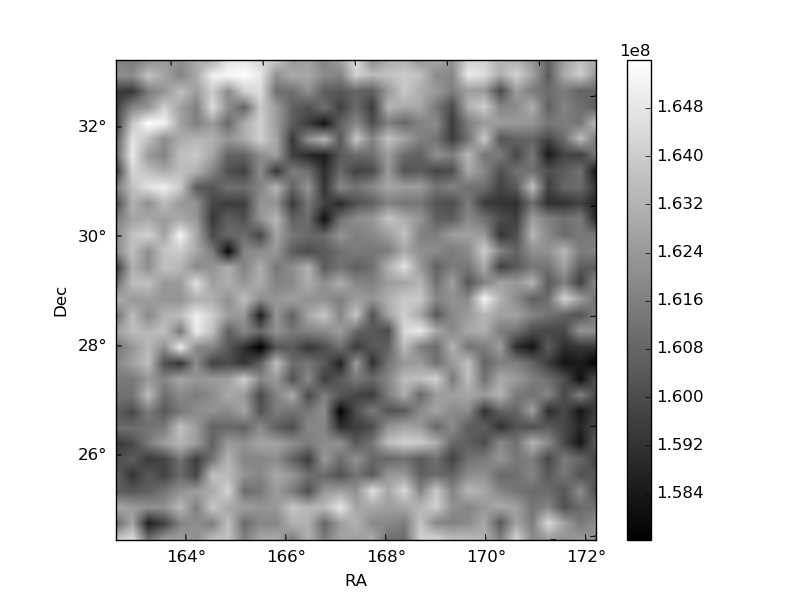
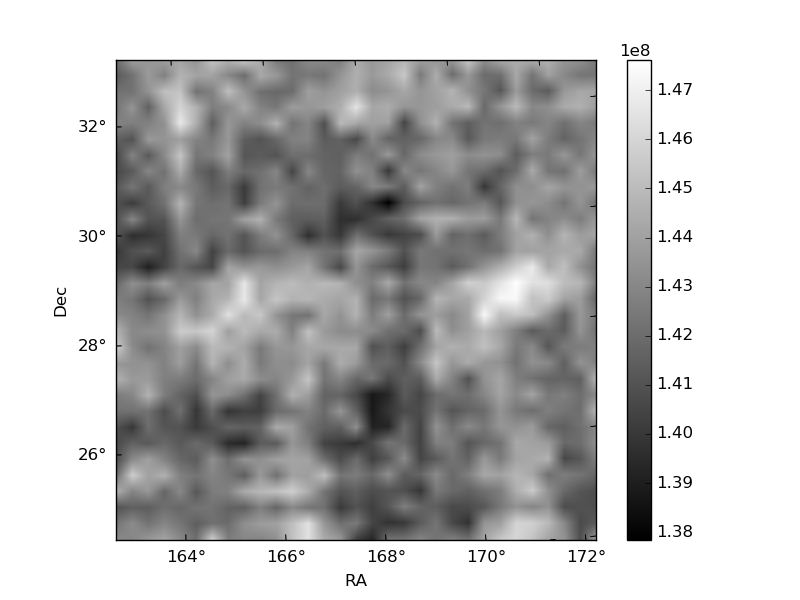
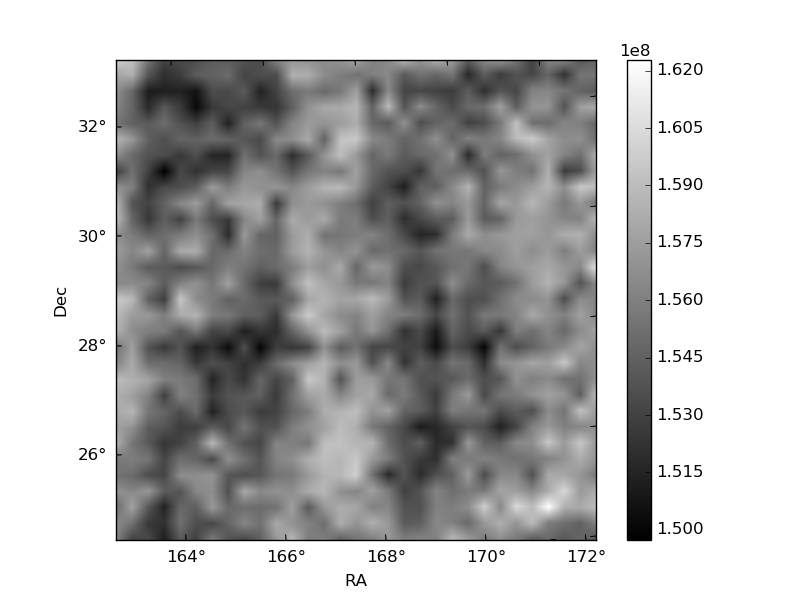
Histogram calculated using DETX and DETY for each event in the final _common_clean file
| Quadrant A | 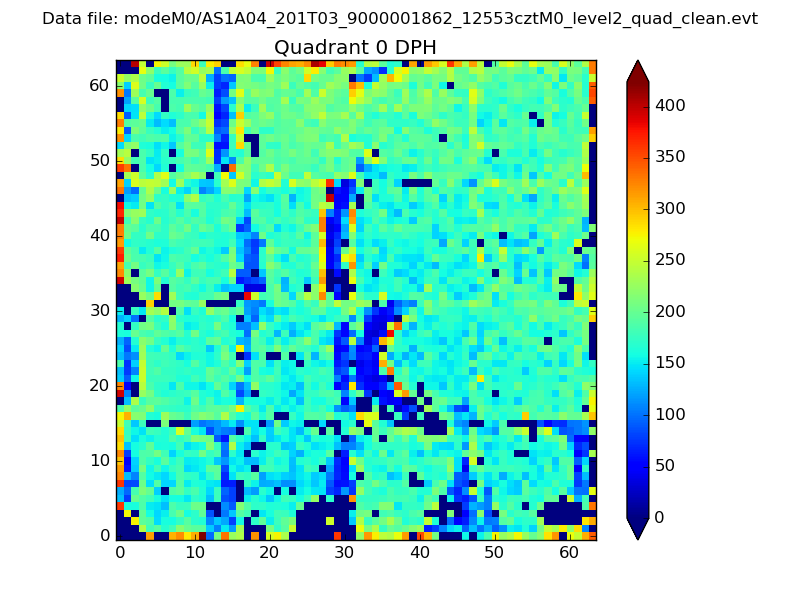 |
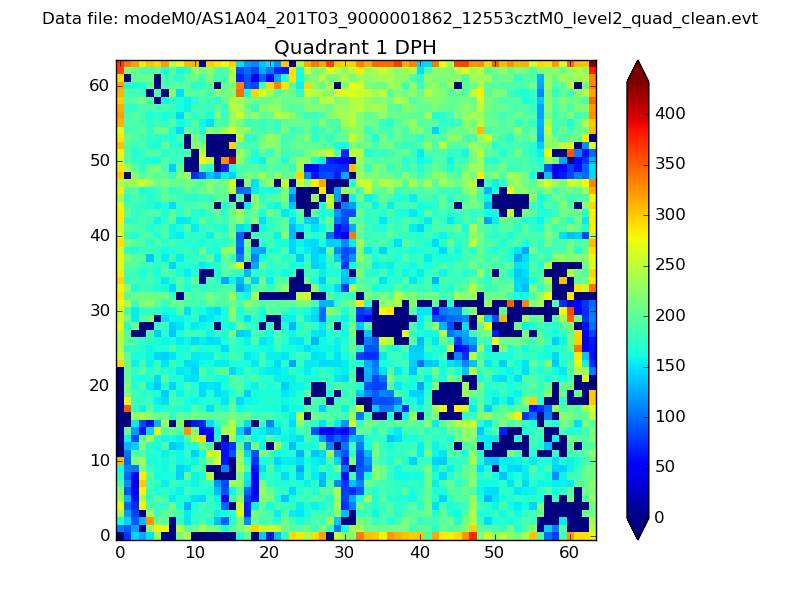 |
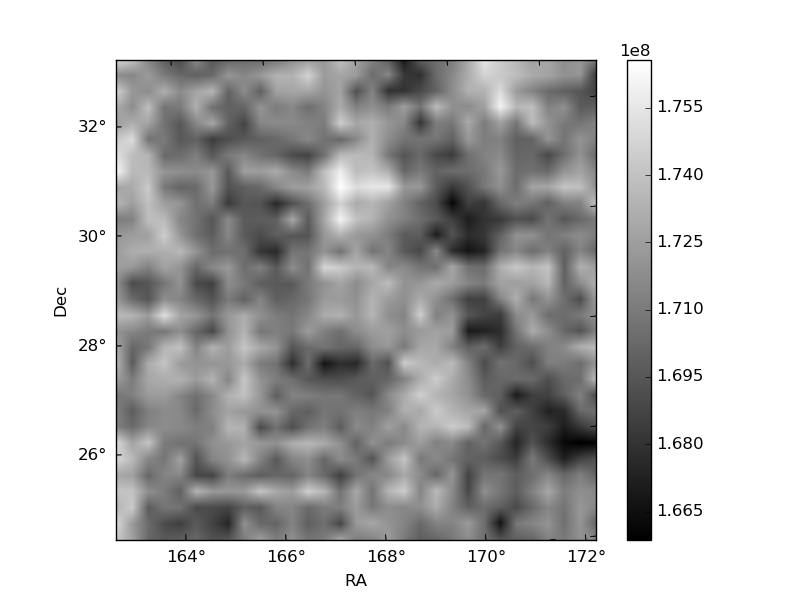
Quadrant B |
|---|---|---|---|
| Quadrant D | 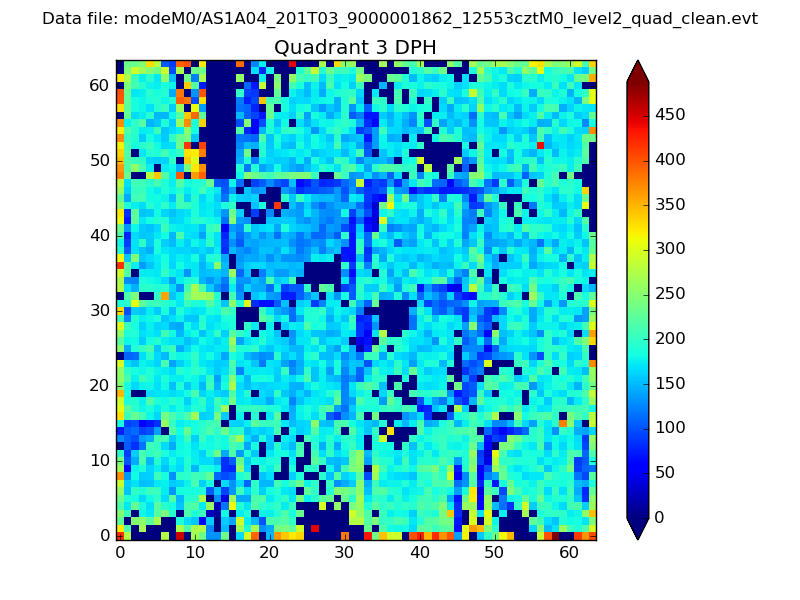 |
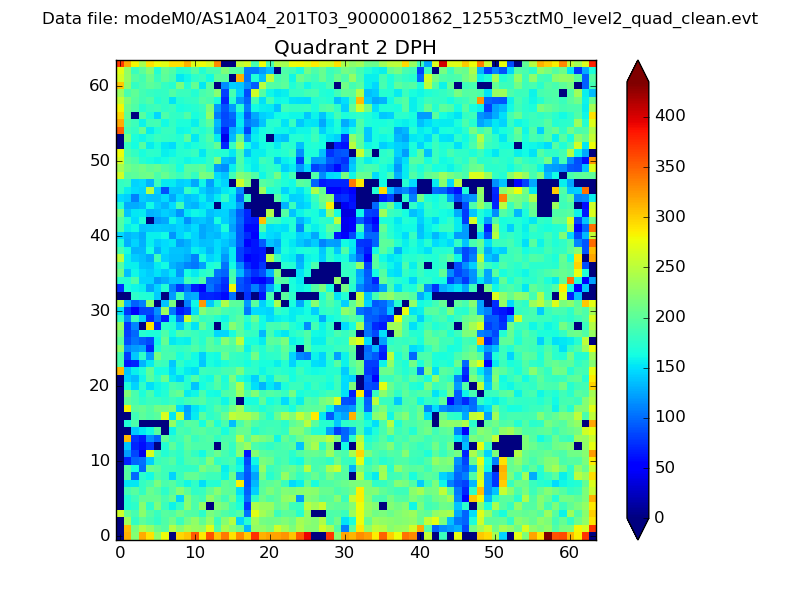 |
Quadrant C |
| Plot type | Count rate plots | Images |
|---|---|---|
| Comparison with Poisson distribution Blue bars denote a histogram of data divided into 1 sec bins. Red curve is a Poisson curve with rate = median count rate of data. |
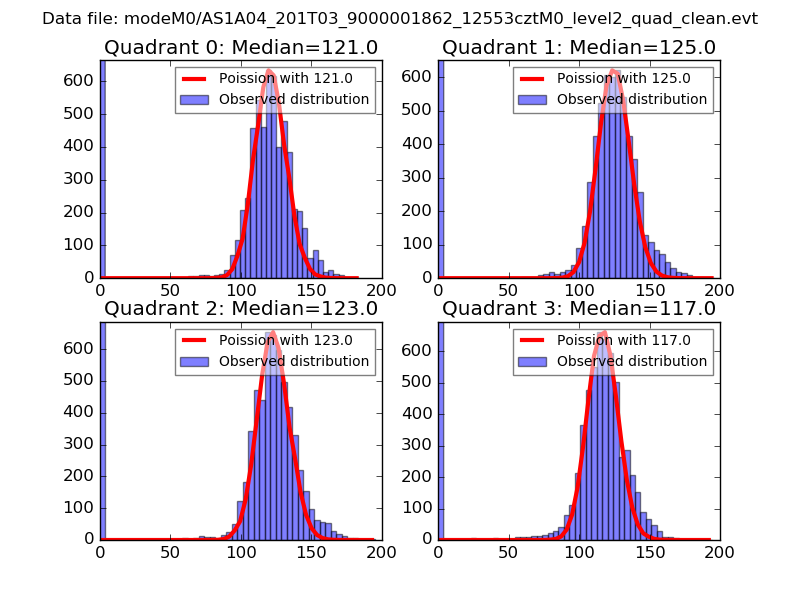 |
 |
| Quadrant-wise count rates Data is divided into 100 sec bins |
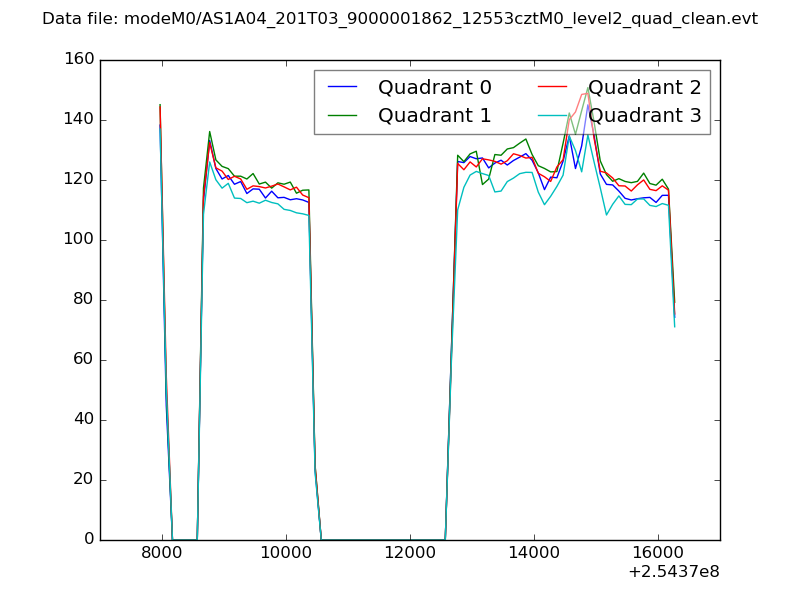 |
|
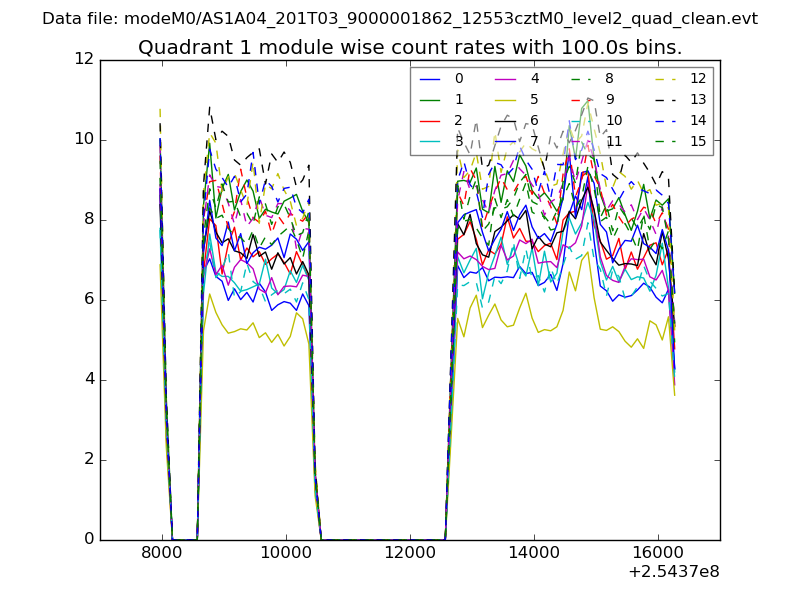
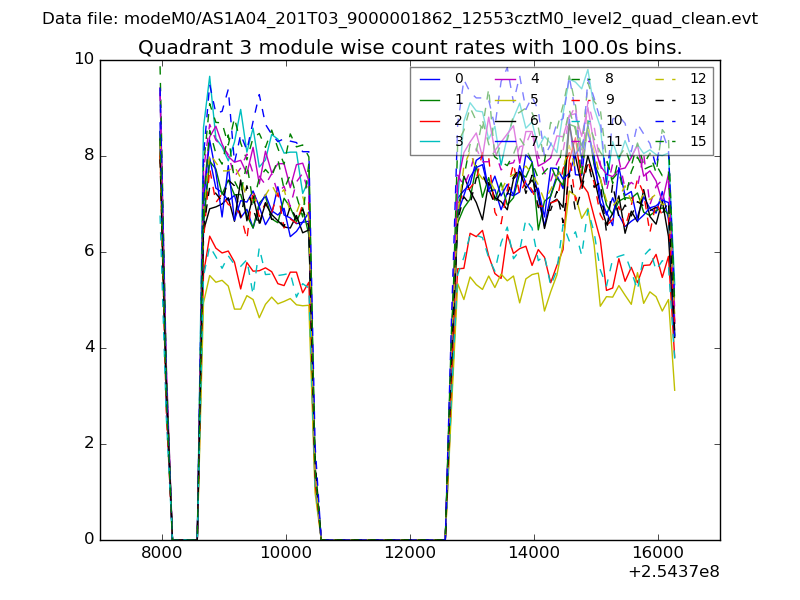
| Module-wise count rates for Quadrant A Data is divided into 100 sec bins |
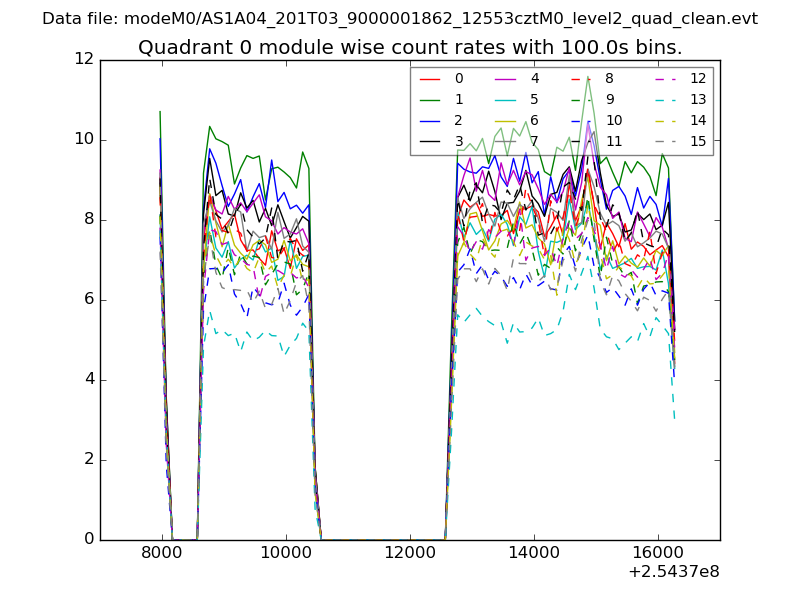 |
 |
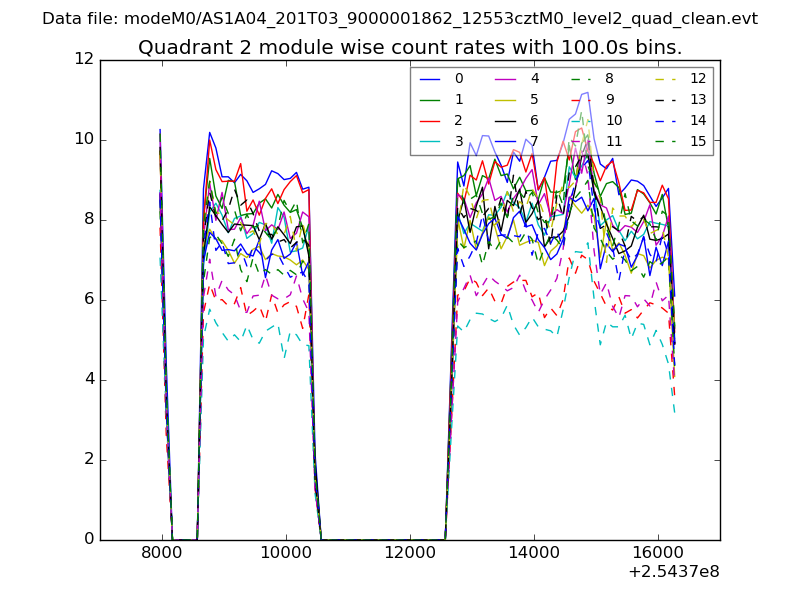
| Module-wise count rates for Quadrant B Data is divided into 100 sec bins |
 |
 |
| Module-wise count rates for Quadrant C Data is divided into 100 sec bins |
 |
 |
| Module-wise count rates for Quadrant D Data is divided into 100 sec bins |
 |
 |
| Parameter | Plot |
|---|---|
| CZT HV Monitor | 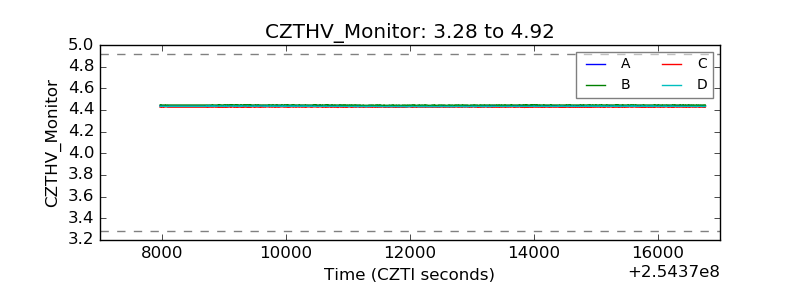 |
| D_VDD | 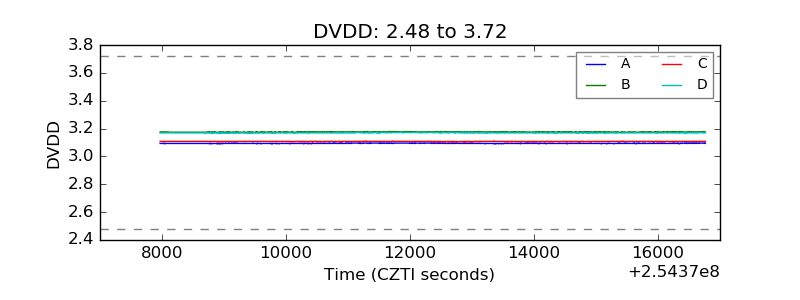 |
| Temperature 1 | 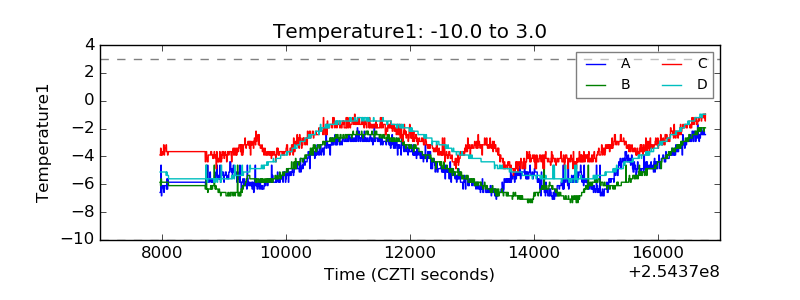 |
| Veto HV Monitor | 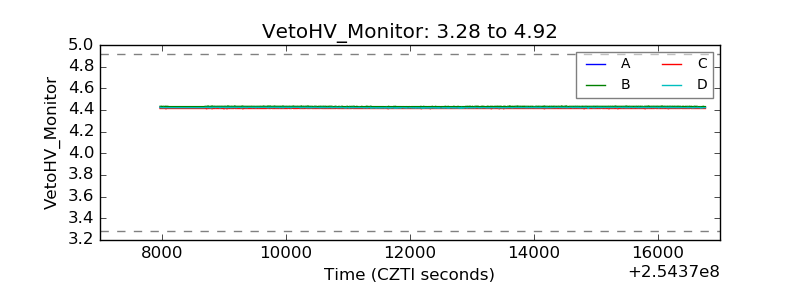 |
| Veto LLD | 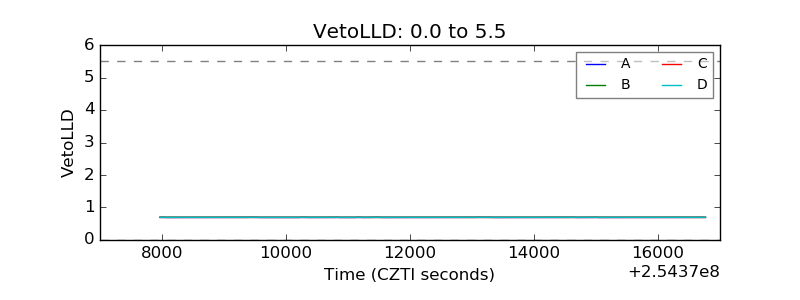 |
| Alpha Counter | 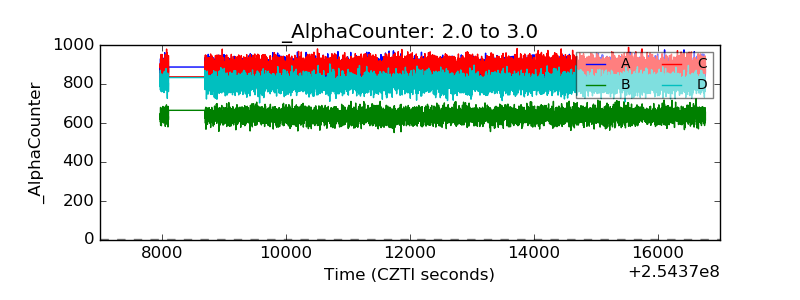 |
| _CPM_Rate | 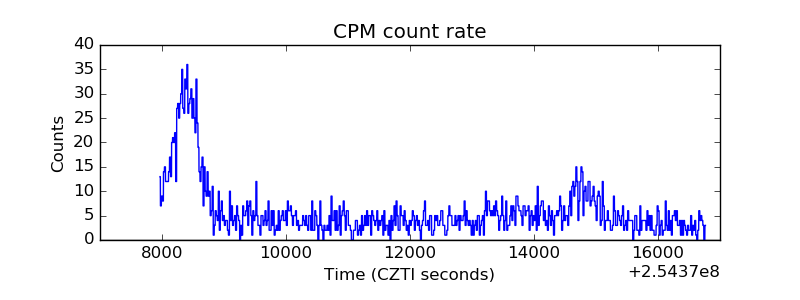 |
| CZT Counter | 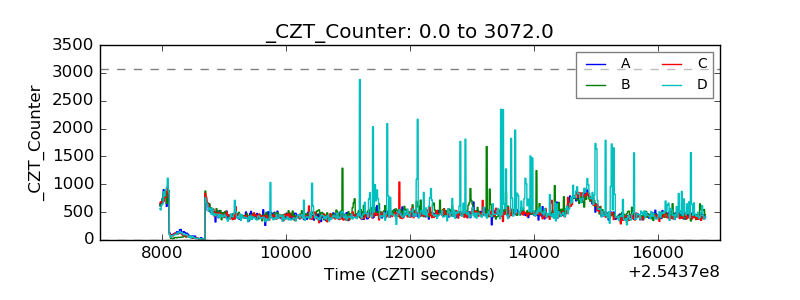 |
| +2.5 Volts monitor |  |
| +5 Volts monitor |  |
| _ROLL_ROT | 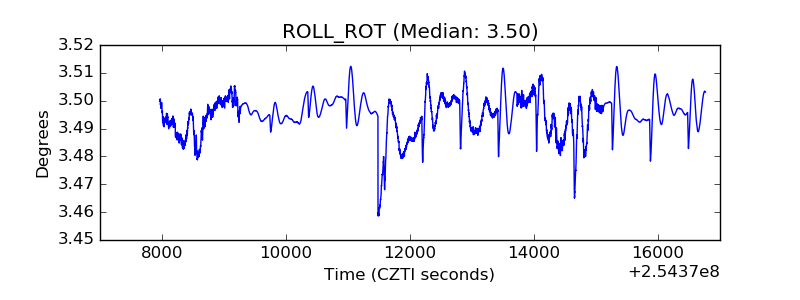 |
| _Roll_DEC | 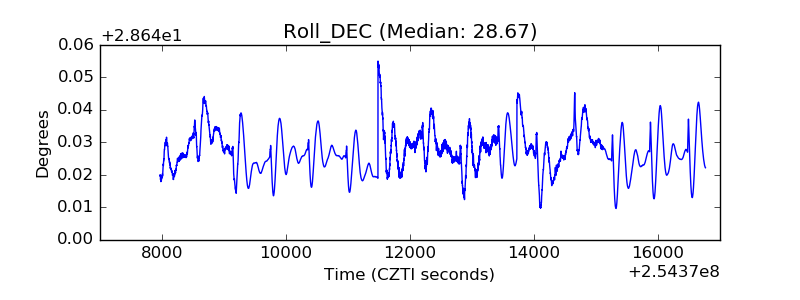 |
| _Roll_RA | 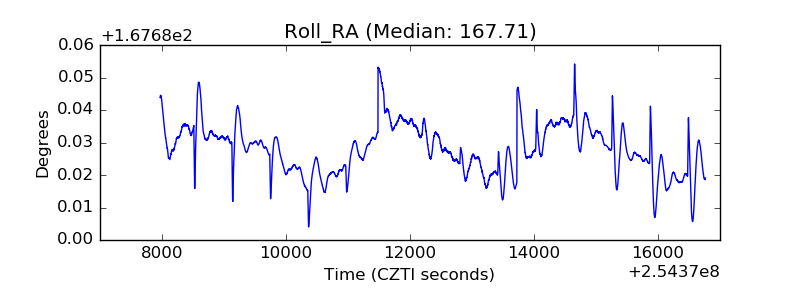 |
| Veto Counter | 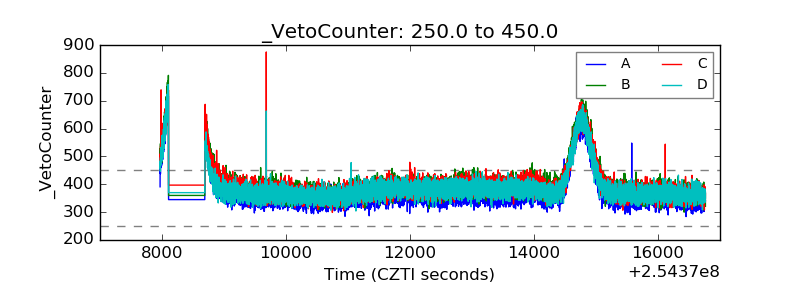 |