| Param | Original file | Final file |
|---|---|---|
| Filename | modeM0/AS1A04_201T03_9000001862_12554cztM0_level2.evt | modeM0/AS1A04_201T03_9000001862_12554cztM0_level2_quad_clean.evt |
| Size (bytes) | 501,681,600 | 89,271,360 |
| Size | 478.4 MB | 85.1 MB |
| Events in quadrant A | 3,433,034 | 546,826 |
| Events in quadrant B | 4,149,323 | 562,799 |
| Events in quadrant C | 3,308,014 | 555,749 |
| Events in quadrant D | 3,811,051 | 533,687 |
| Mode SS | |||
|---|---|---|---|
| Quadrant | BADHDUFLAG | Total packets | Discarded packets |
| A | 0 | 146 | 0 |
| B | 0 | 146 | 0 |
| C | 0 | 146 | 0 |
| D | 0 | 146 | 0 |
| Mode M0 | |||
|---|---|---|---|
| Quadrant | BADHDUFLAG | Total packets | Discarded packets |
| A | 0 | 14954 | 2 |
| B | 0 | 16973 | 1 |
| C | 0 | 14919 | 1 |
| D | 0 | 16196 | 1 |
| Mode M9 | |||
|---|---|---|---|
| Quadrant | BADHDUFLAG | Total packets | Discarded packets |
| A | 0 | 1 | 0 |
| B | 0 | 1 | 0 |
| C | 0 | 1 | 0 |
| D | 0 | 1 | 0 |
| Quadrant | Total seconds | Saturated seconds | Saturation percentage |
|---|---|---|---|
| A | 7242 | 203 | 2.803093% |
| B | 7242 | 318 | 4.391052% |
| C | 7242 | 153 | 2.112676% |
| D | 7242 | 177 | 2.444076% |
Noise dominated data is calculated using 1-second bins in cleaned event files. If a bin has >2000 counts, and if more than 50% of those come from <1% of pixels, then it is considered to be noise-dominated and hence unusable.
| Quadrant | # 1 sec bins | Bins with >0 counts | Bins with >2000 counts | High rate bins dominated by noise | Noise dominated (total time) | Noise dominated (detector-on time) | Marked lightcurve |
|---|---|---|---|---|---|---|---|
| A | 7308 | 7244 | 0 | 0 | 0.00% | 0.00% | 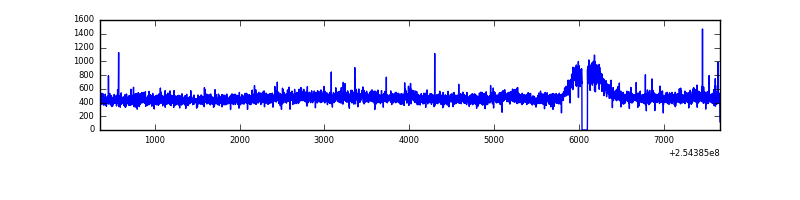 |
| B | 7308 | 7244 | 69 | 69 | 0.94% | 0.95% | 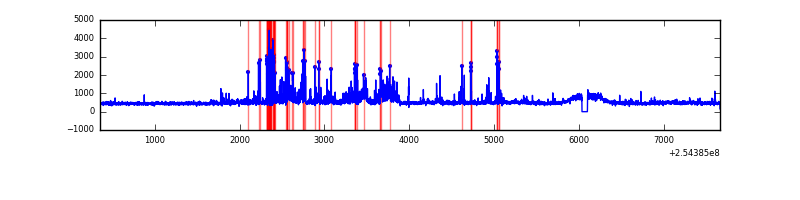 |
| C | 7308 | 7244 | 1 | 1 | 0.01% | 0.01% | 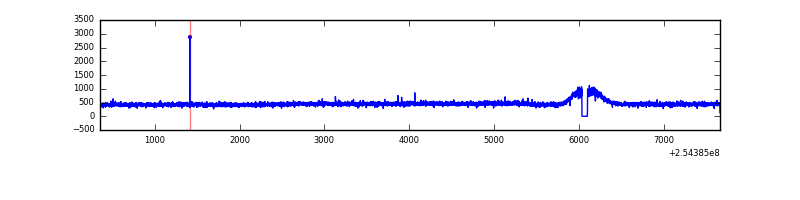 |
| D | 7308 | 7244 | 21 | 21 | 0.29% | 0.29% | 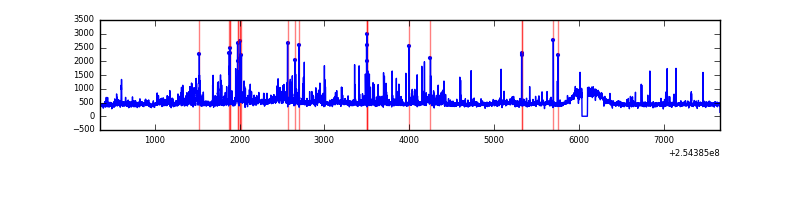 |
Top three noisy pixels from each quadrant. If the there are fewer than three noisy pixels in the level2.evt file, extra rows are filled as -1
| Pixel properties | Quadrant properties | ||||||
|---|---|---|---|---|---|---|---|
| Quadrant | DetID | PixID | Counts | Sigma | Mean | Median | Sigma |
| A | 8 | 15 | 67223 | 369.09 | 866 | 844 | 179.8 |
| A | 1 | 162 | 11844 | 61.16 | 866 | 844 | 179.8 |
| A | 12 | 189 | 7896 | 39.21 | 866 | 844 | 179.8 |
| B | 4 | 239 | 549168 | 3281.25 | 864 | 839 | 167.1 |
| B | 0 | 230 | 49217 | 289.5 | 864 | 839 | 167.1 |
| B | 0 | 214 | 44766 | 262.86 | 864 | 839 | 167.1 |
| C | 3 | 233 | 6752 | 29.95 | 844 | 845 | 197.2 |
| C | 13 | 61 | 6189 | 27.1 | 844 | 845 | 197.2 |
| C | 8 | 128 | 4459 | 18.33 | 844 | 845 | 197.2 |
| D | 1 | 52 | 416719 | 2040.94 | 842 | 817 | 203.8 |
| D | 13 | 249 | 53754 | 259.78 | 842 | 817 | 203.8 |
| D | 8 | 195 | 50679 | 244.69 | 842 | 817 | 203.8 |
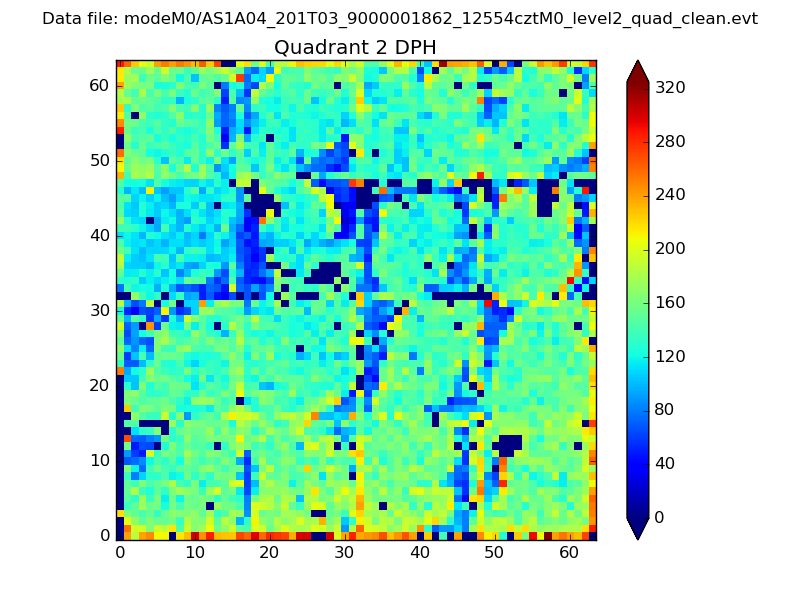
Histogram calculated using DETX and DETY for each event in the final _common_clean file
| Quadrant A | 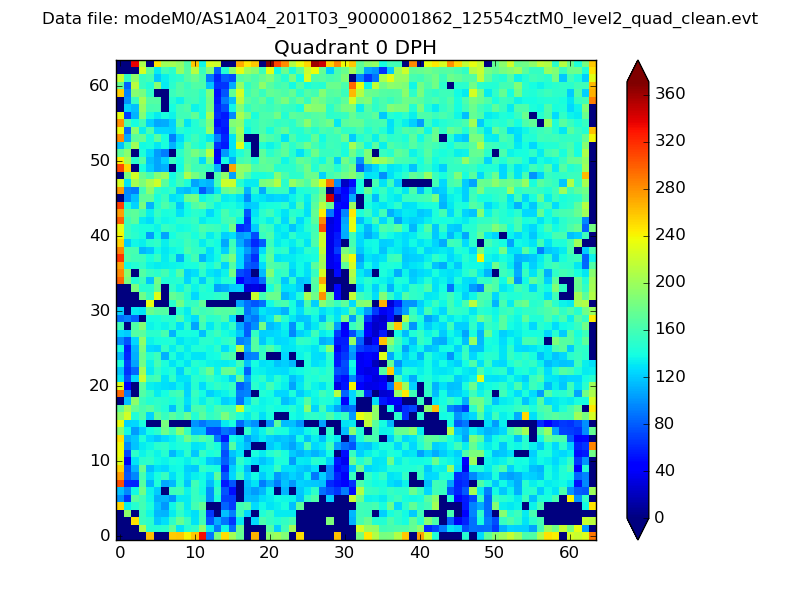 |
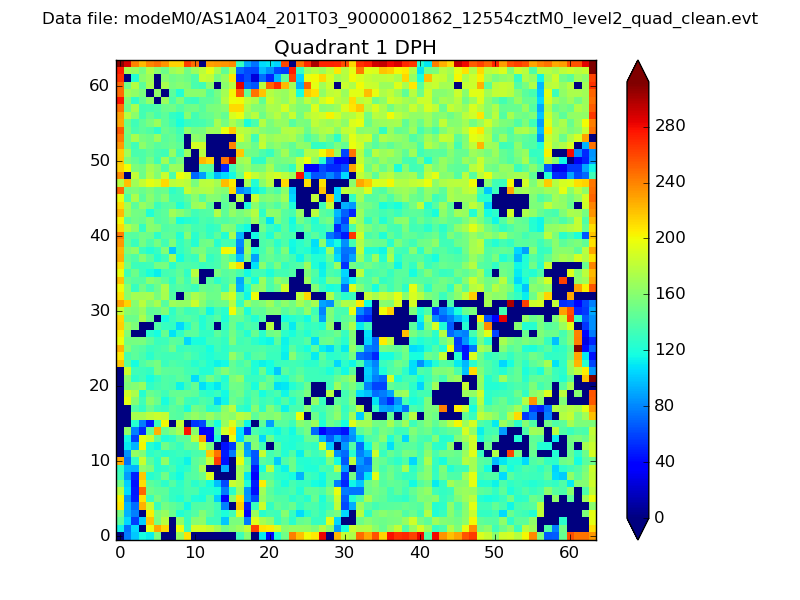 |
Quadrant B |
|---|---|---|---|
| Quadrant D | 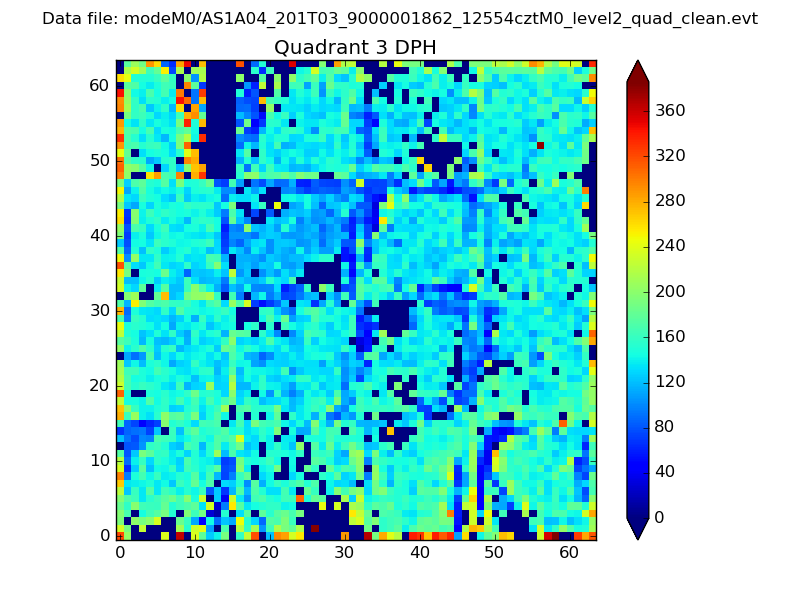 |
 |
Quadrant C |
| Plot type | Count rate plots | Images |
|---|---|---|
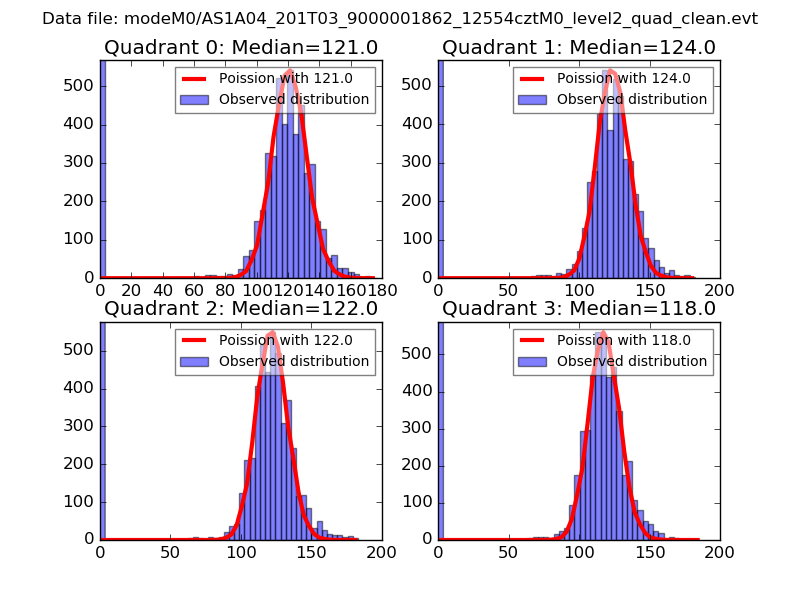
| Comparison with Poisson distribution Blue bars denote a histogram of data divided into 1 sec bins. Red curve is a Poisson curve with rate = median count rate of data. |
 |
 |
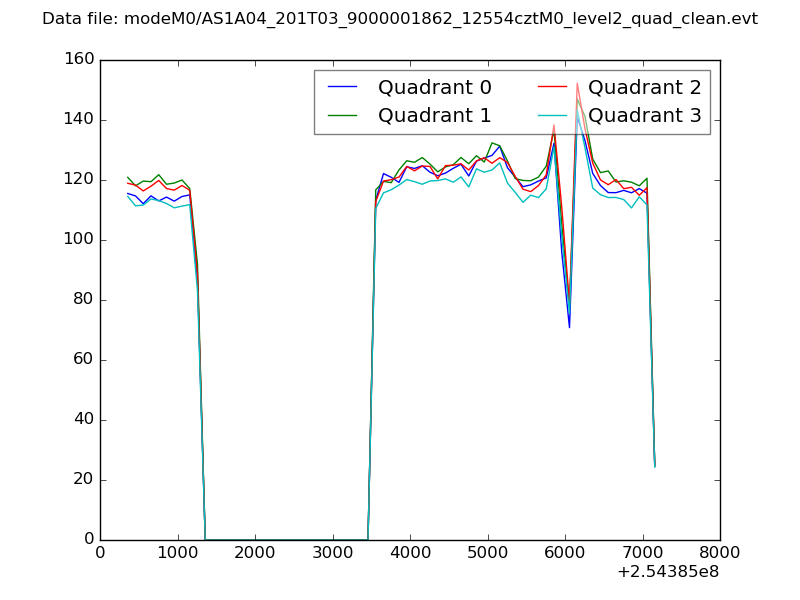
| Quadrant-wise count rates Data is divided into 100 sec bins |
 |
|
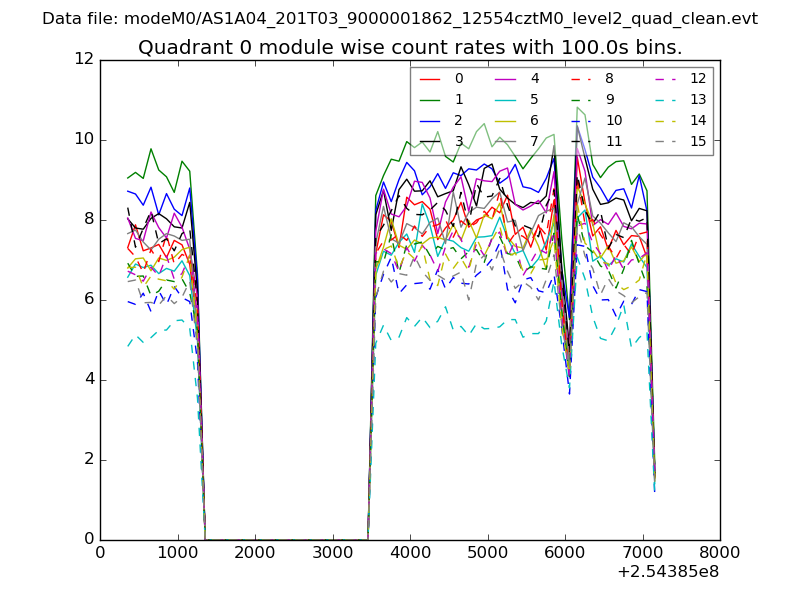
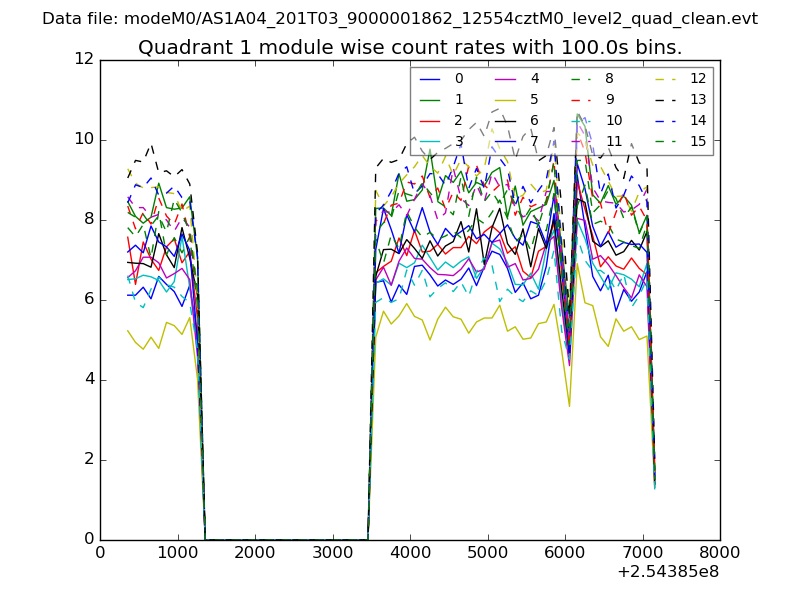
| Module-wise count rates for Quadrant A Data is divided into 100 sec bins |
 |
 |
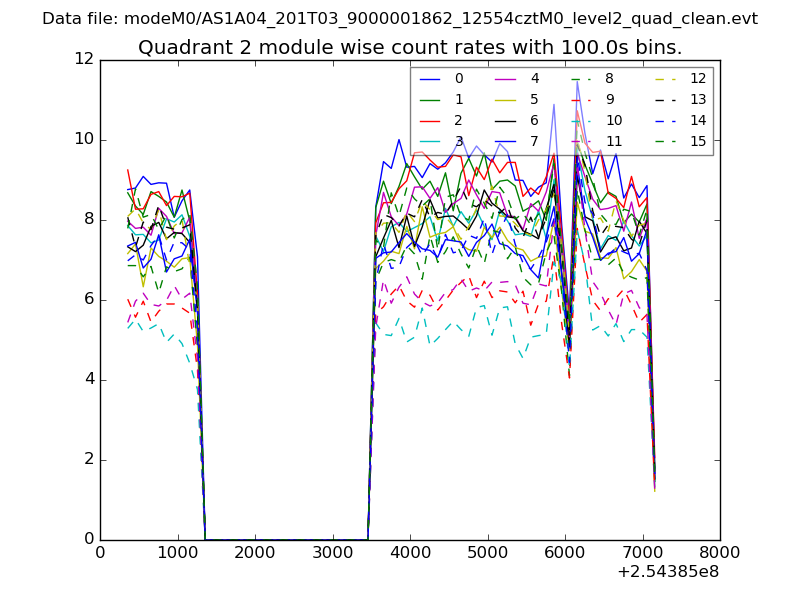
| Module-wise count rates for Quadrant B Data is divided into 100 sec bins |
 |
 |
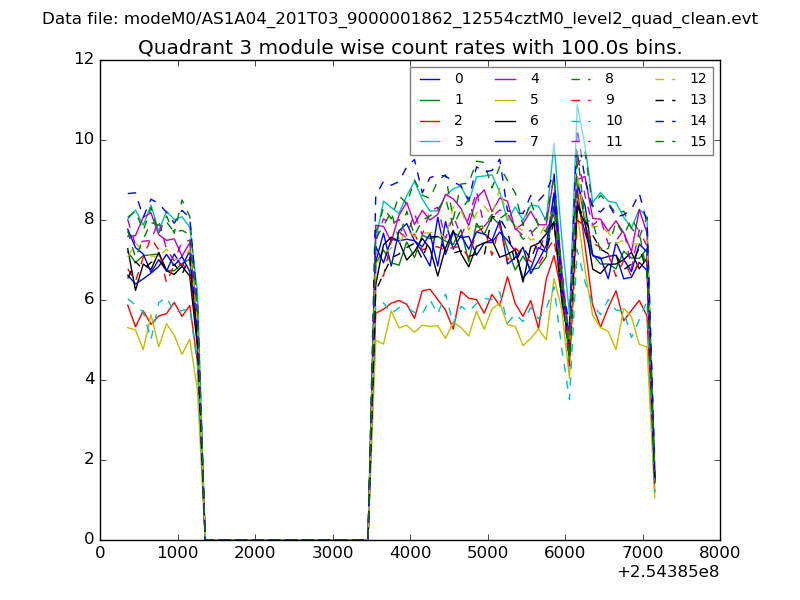
| Module-wise count rates for Quadrant C Data is divided into 100 sec bins |
 |
 |
| Module-wise count rates for Quadrant D Data is divided into 100 sec bins |
 |
 |
| Parameter | Plot |
|---|---|
| CZT HV Monitor | 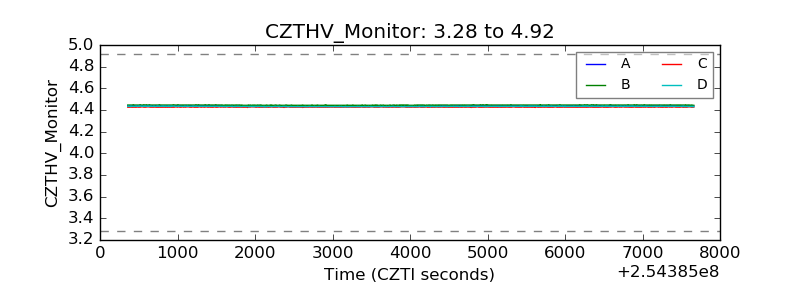 |
| D_VDD | 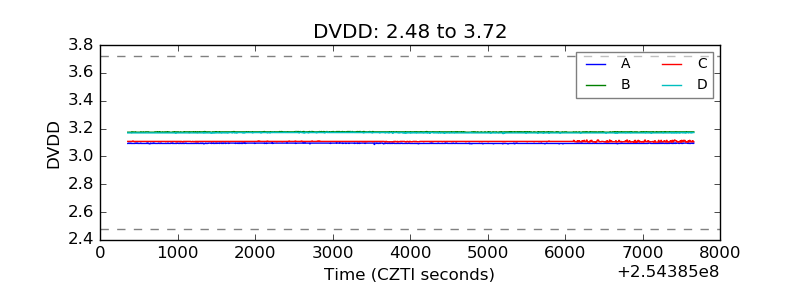 |
| Temperature 1 | 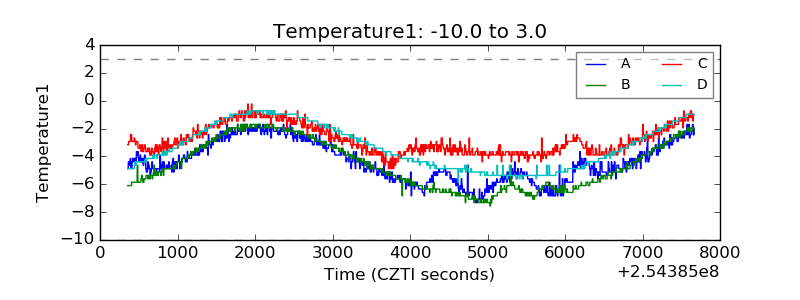 |
| Veto HV Monitor | 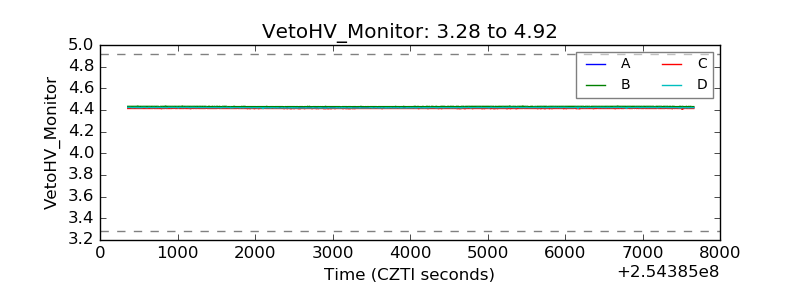 |
| Veto LLD | 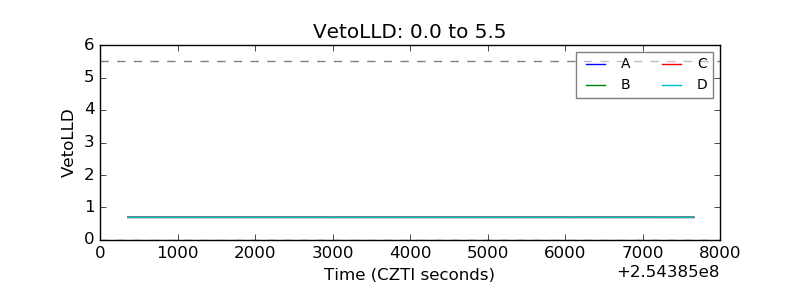 |
| Alpha Counter | 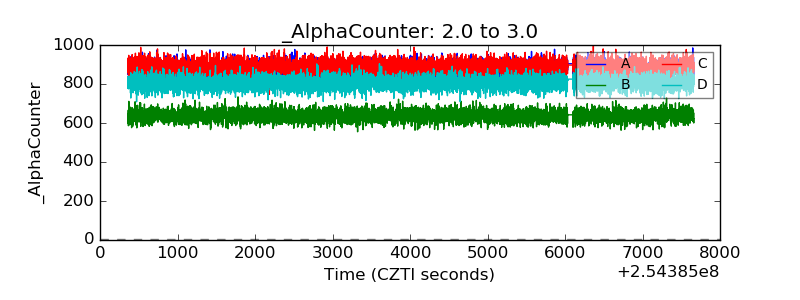 |
| _CPM_Rate | 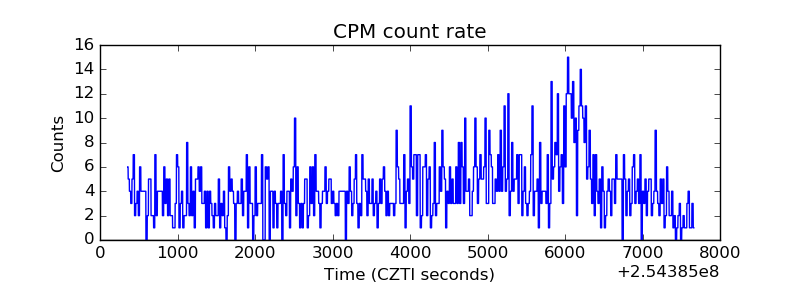 |
| CZT Counter | 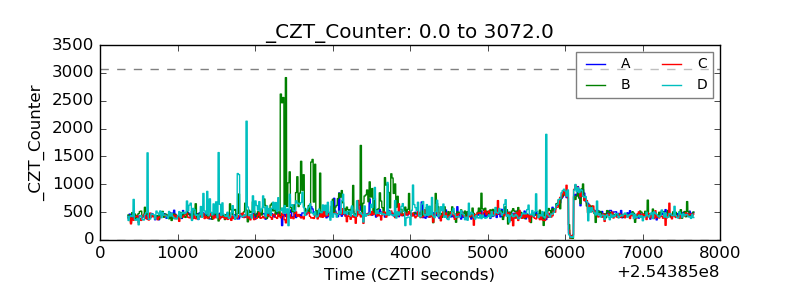 |
| +2.5 Volts monitor | 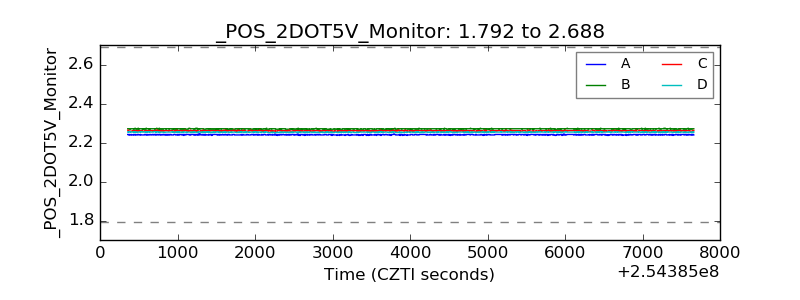 |
| +5 Volts monitor | 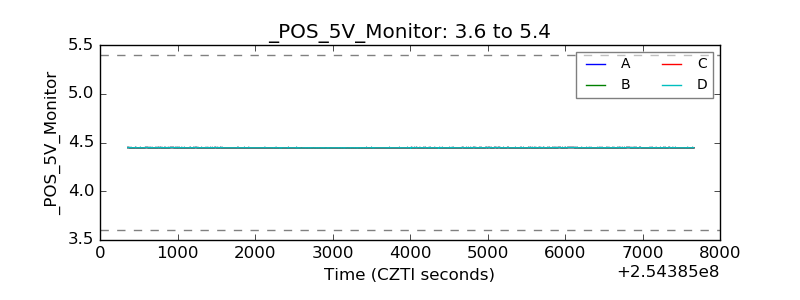 |
| _ROLL_ROT | 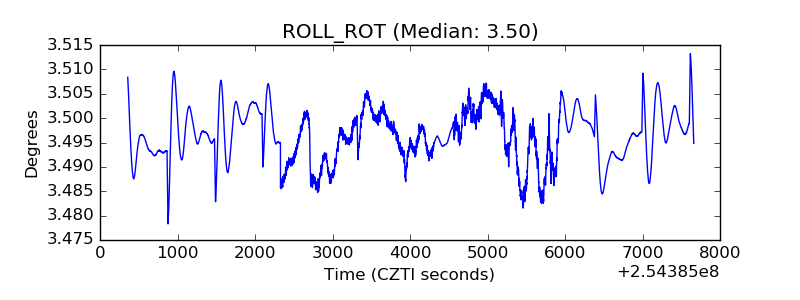 |
| _Roll_DEC | 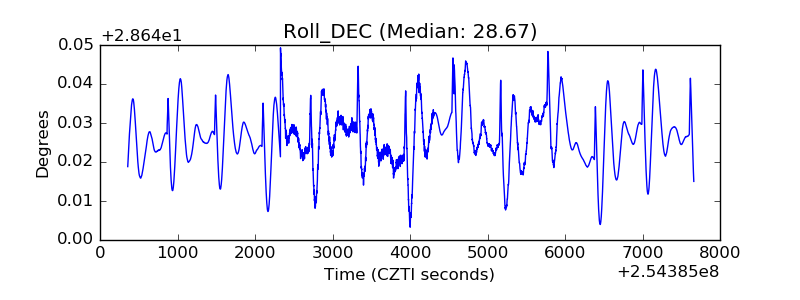 |
| _Roll_RA | 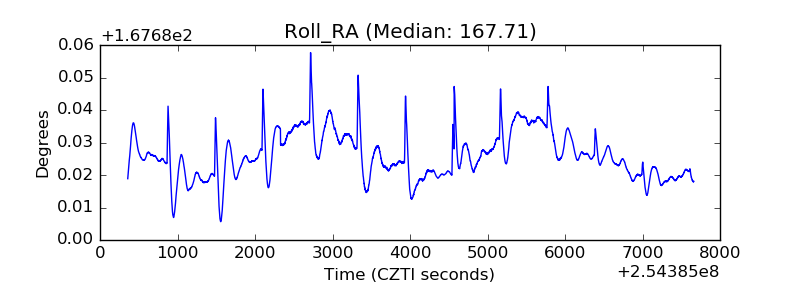 |
| Veto Counter | 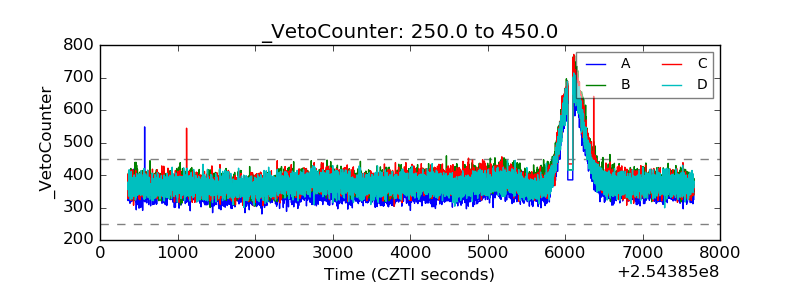 |