| Param | Original file | Final file |
|---|---|---|
| Filename | modeM0/AS1A04_201T03_9000001862_12557cztM0_level2.evt | modeM0/AS1A04_201T03_9000001862_12557cztM0_level2_quad_clean.evt |
| Size (bytes) | 61,352,640 | 15,117,120 |
| Size | 58.5 MB | 14.4 MB |
| Events in quadrant A | 452,068 | 97,400 |
| Events in quadrant B | 466,780 | 102,726 |
| Events in quadrant C | 437,790 | 98,714 |
| Events in quadrant D | 444,087 | 95,324 |
| Mode SS | |||
|---|---|---|---|
| Quadrant | BADHDUFLAG | Total packets | Discarded packets |
| A | 0 | 57 | 39 |
| B | 0 | 54 | 34 |
| C | 0 | 58 | 38 |
| D | 0 | 57 | 39 |
| Mode M0 | |||
|---|---|---|---|
| Quadrant | BADHDUFLAG | Total packets | Discarded packets |
| A | 0 | 5915 | 4058 |
| B | 0 | 6557 | 4659 |
| C | 0 | 5905 | 4077 |
| D | 0 | 6201 | 4360 |
| Mode M9 | |||
|---|---|---|---|
| Quadrant | BADHDUFLAG | Total packets | Discarded packets |
| A | 0 | 1 | 0 |
| B | 0 | 1 | 0 |
| C | 0 | 2 | 1 |
| D | 0 | 1 | 1 |
| Quadrant | Total seconds | Saturated seconds | Saturation percentage |
|---|---|---|---|
| A | 791 | 158 | 19.974716% |
| B | 799 | 163 | 20.400501% |
| C | 771 | 117 | 15.175097% |
| D | 781 | 124 | 15.877081% |
Noise dominated data is calculated using 1-second bins in cleaned event files. If a bin has >2000 counts, and if more than 50% of those come from <1% of pixels, then it is considered to be noise-dominated and hence unusable.
| Quadrant | # 1 sec bins | Bins with >0 counts | Bins with >2000 counts | High rate bins dominated by noise | Noise dominated (total time) | Noise dominated (detector-on time) | Marked lightcurve |
|---|---|---|---|---|---|---|---|
| A | 1174 | 943 | 0 | 0 | 0.00% | 0.00% | 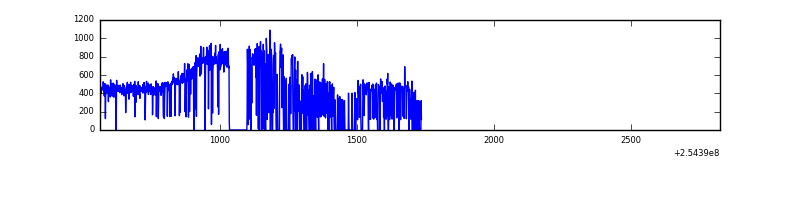 |
| B | 2263 | 958 | 0 | 0 | 0.00% | 0.00% | 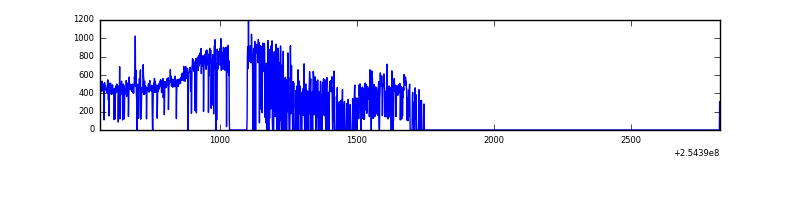 |
| C | 2242 | 932 | 0 | 0 | 0.00% | 0.00% | 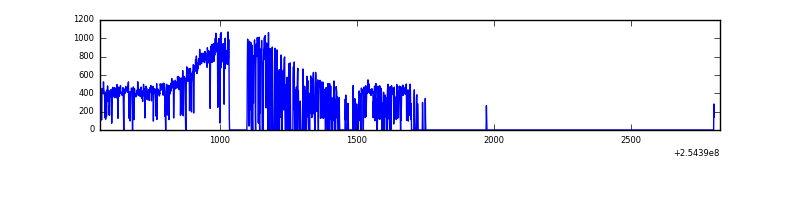 |
| D | 1192 | 938 | 0 | 0 | 0.00% | 0.00% | 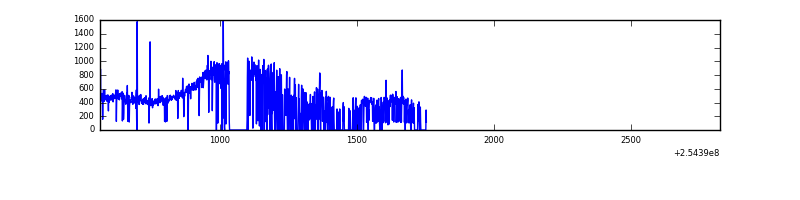 |
Top three noisy pixels from each quadrant. If the there are fewer than three noisy pixels in the level2.evt file, extra rows are filled as -1
| Pixel properties | Quadrant properties | ||||||
|---|---|---|---|---|---|---|---|
| Quadrant | DetID | PixID | Counts | Sigma | Mean | Median | Sigma |
| A | 8 | 15 | 4755 | 171.54 | 114 | 111 | 27.1 |
| A | 1 | 162 | 1712 | 59.14 | 114 | 111 | 27.1 |
| A | 12 | 189 | 1101 | 36.57 | 114 | 111 | 27.1 |
| B | 0 | 205 | 5062 | 190.67 | 116 | 111 | 26.0 |
| B | 11 | 51 | 4627 | 173.92 | 116 | 111 | 26.0 |
| B | 0 | 214 | 4556 | 171.18 | 116 | 111 | 26.0 |
| C | 8 | 128 | 969 | 30.51 | 111 | 111 | 28.1 |
| C | 13 | 61 | 842 | 25.99 | 111 | 111 | 28.1 |
| C | 8 | 112 | 445 | 11.88 | 111 | 111 | 28.1 |
| D | 4 | 228 | 8677 | 285.32 | 113 | 108 | 30.0 |
| D | 8 | 195 | 5094 | 166.02 | 113 | 108 | 30.0 |
| D | 1 | 52 | 4703 | 153.0 | 113 | 108 | 30.0 |
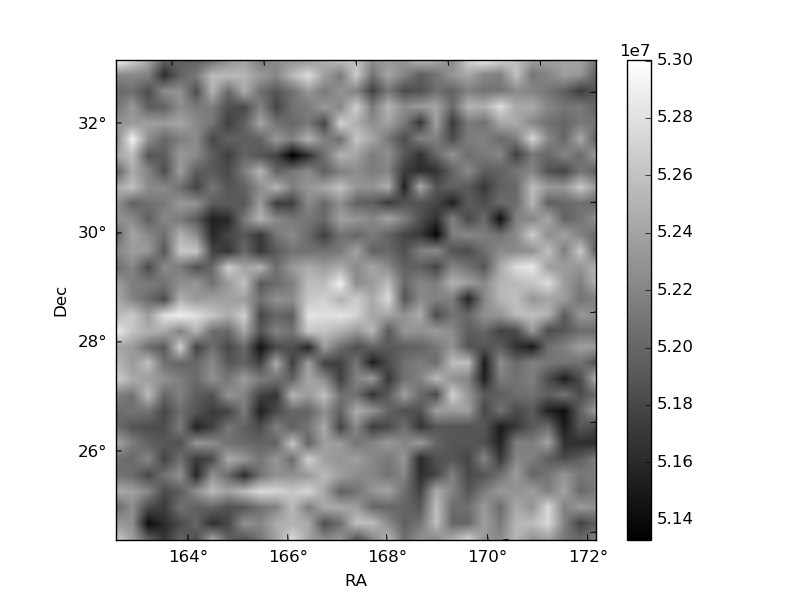
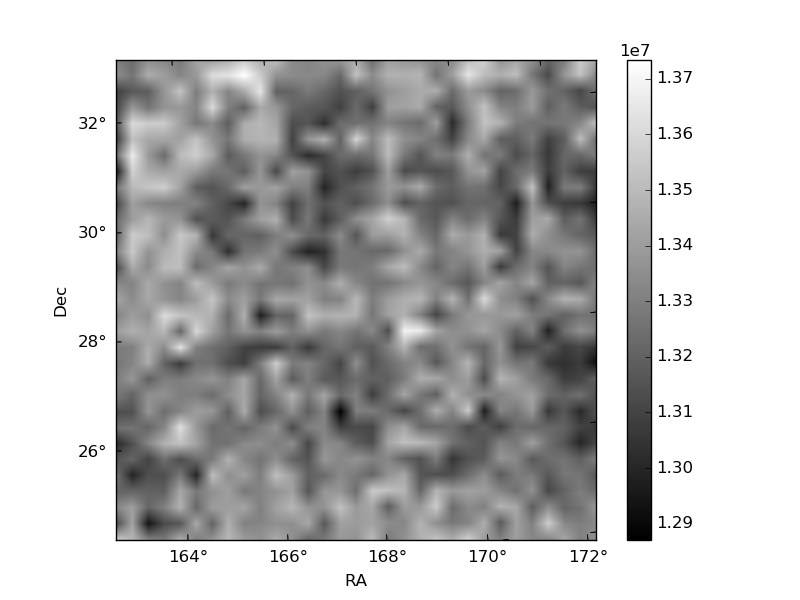
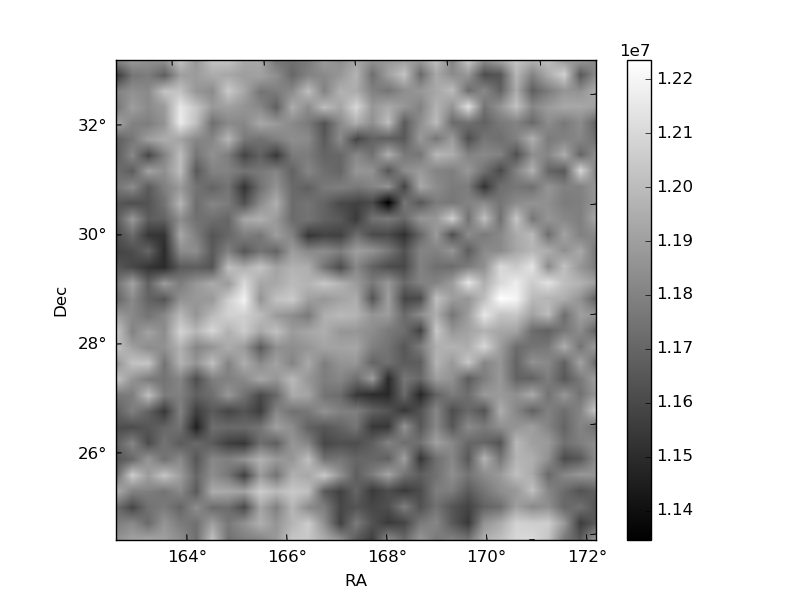
Histogram calculated using DETX and DETY for each event in the final _common_clean file
| Quadrant A | 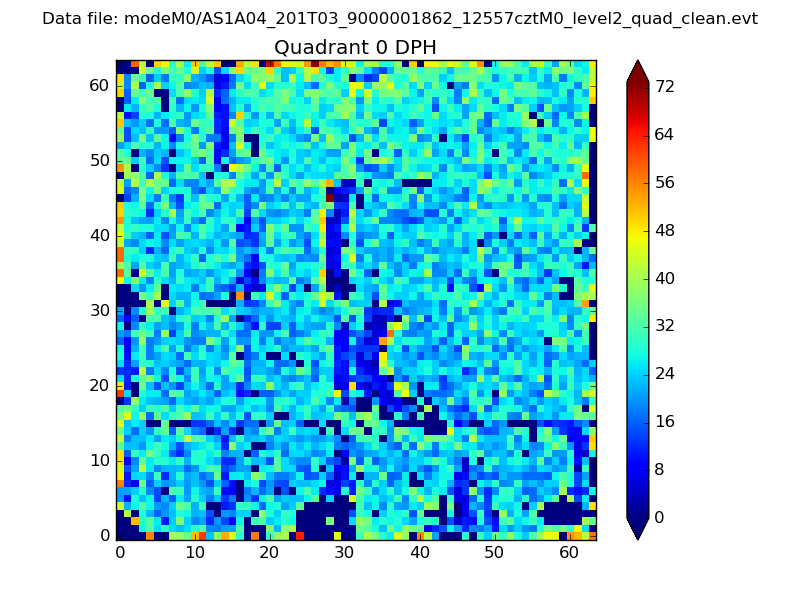 |
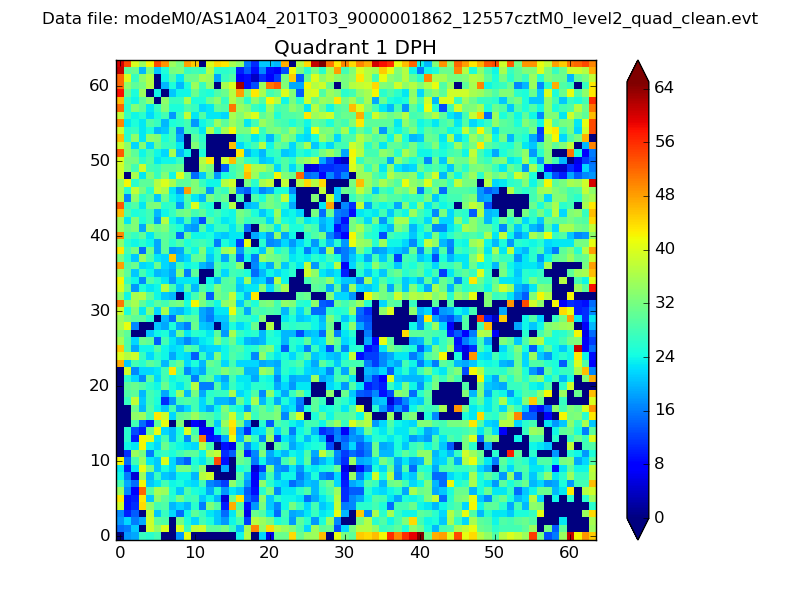 |
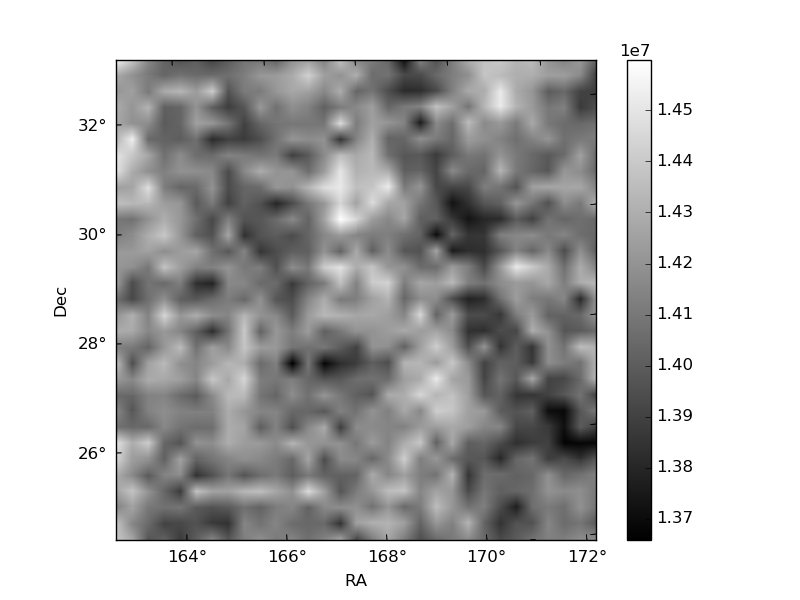
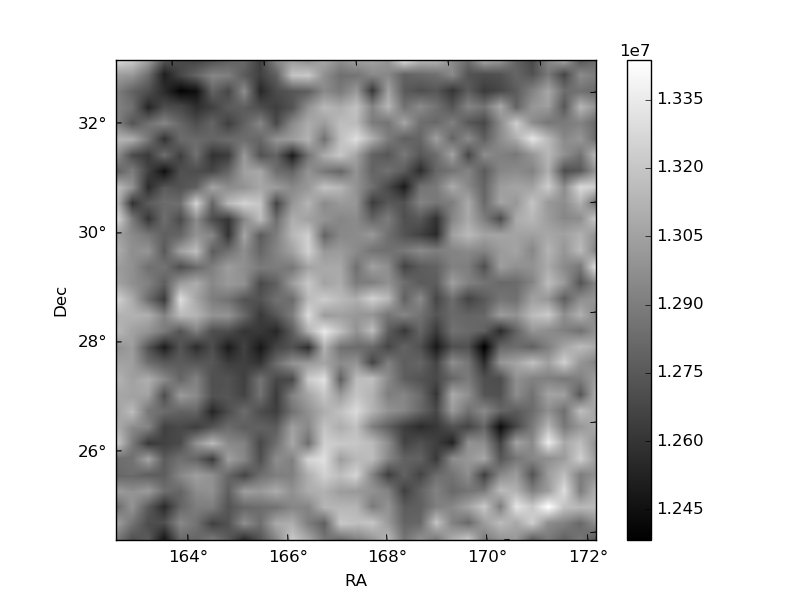
Quadrant B |
|---|---|---|---|
| Quadrant D | 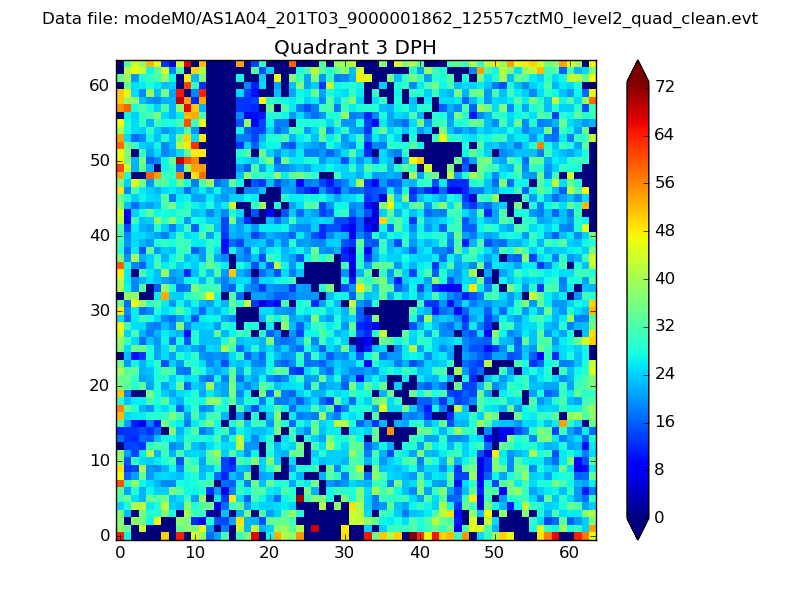 |
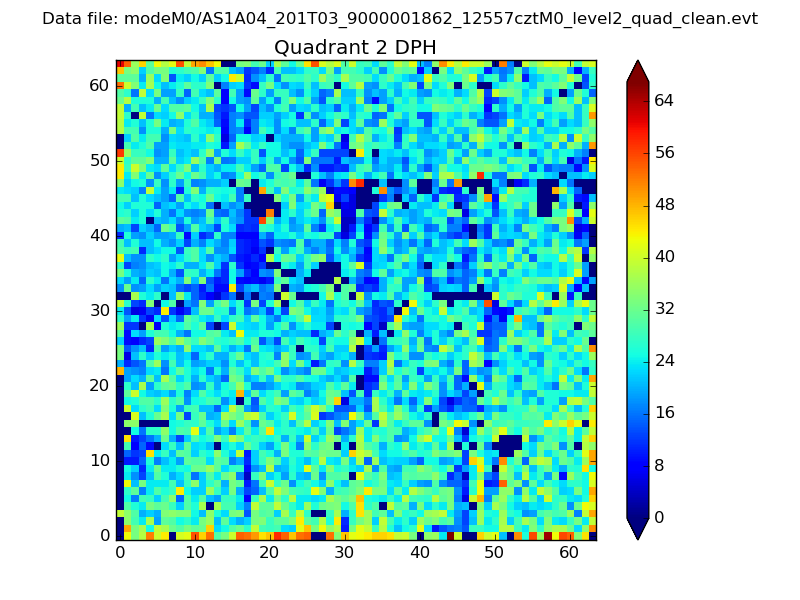 |
Quadrant C |
| Plot type | Count rate plots | Images |
|---|---|---|
| Comparison with Poisson distribution Blue bars denote a histogram of data divided into 1 sec bins. Red curve is a Poisson curve with rate = median count rate of data. |
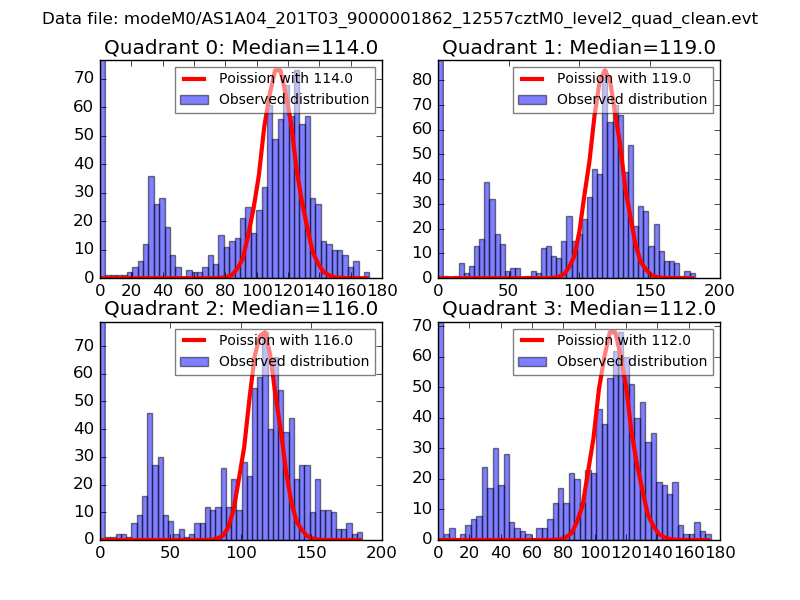 |
 |
| Quadrant-wise count rates Data is divided into 100 sec bins |
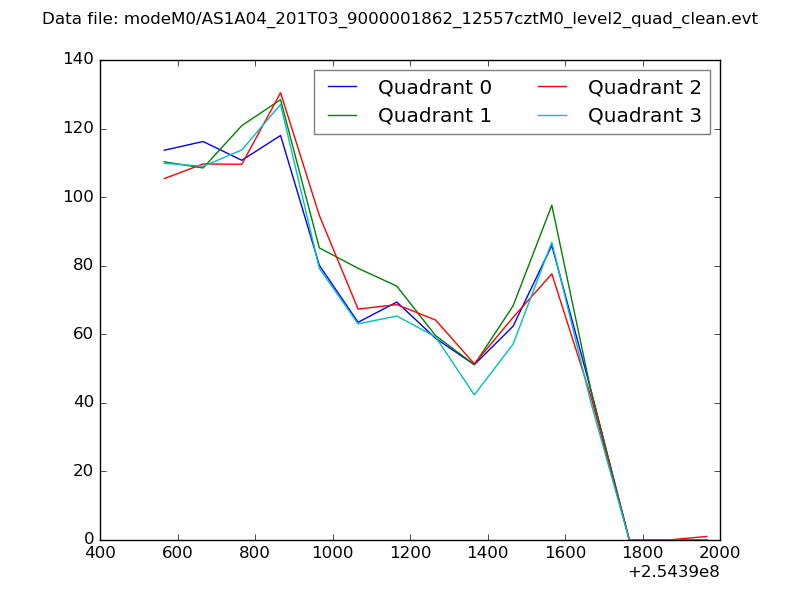 |
|
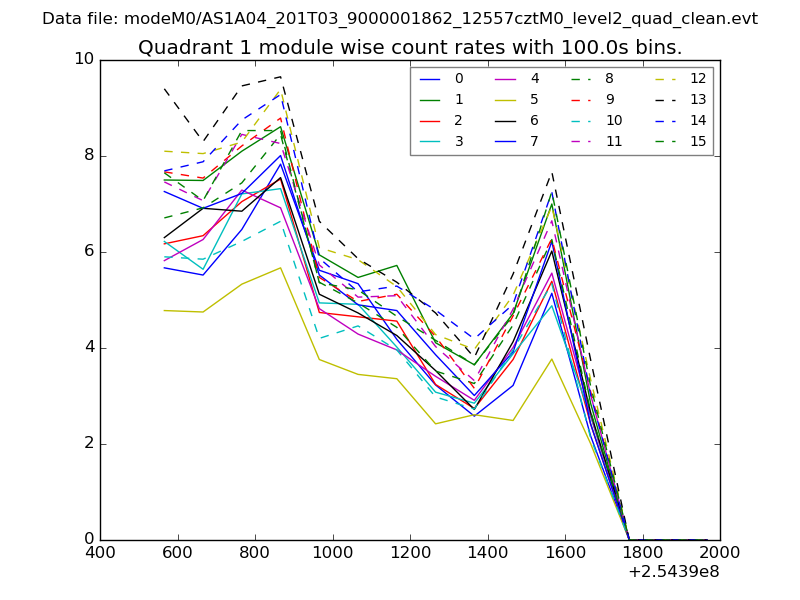
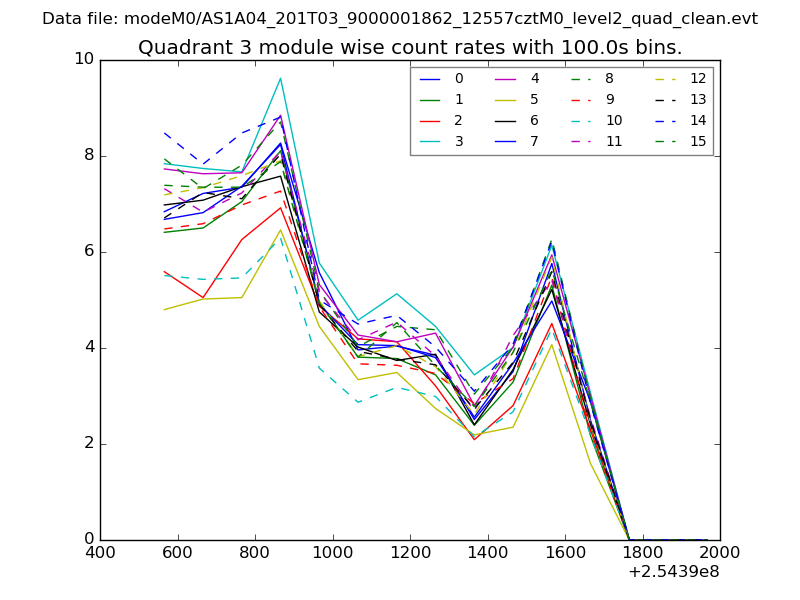
| Module-wise count rates for Quadrant A Data is divided into 100 sec bins |
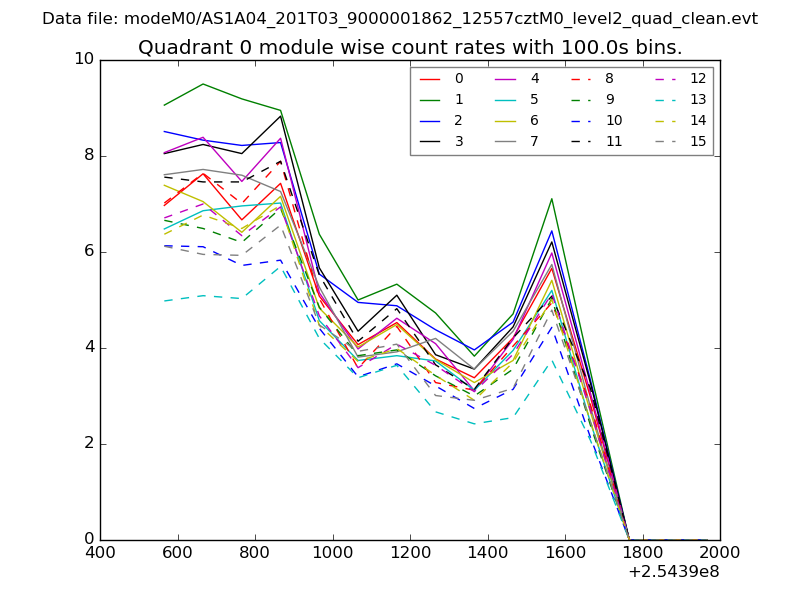 |
 |
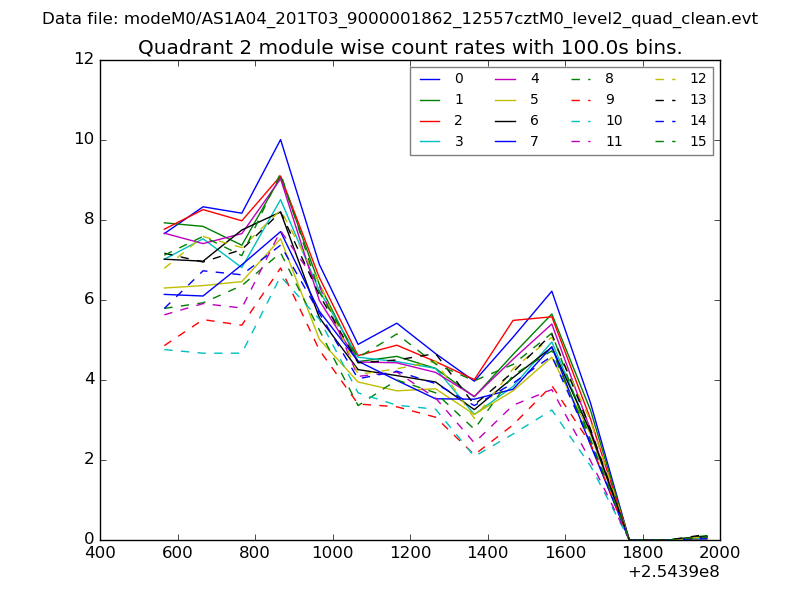
| Module-wise count rates for Quadrant B Data is divided into 100 sec bins |
 |
 |
| Module-wise count rates for Quadrant C Data is divided into 100 sec bins |
 |
 |
| Module-wise count rates for Quadrant D Data is divided into 100 sec bins |
 |
 |
| Parameter | Plot |
|---|---|
| CZT HV Monitor | 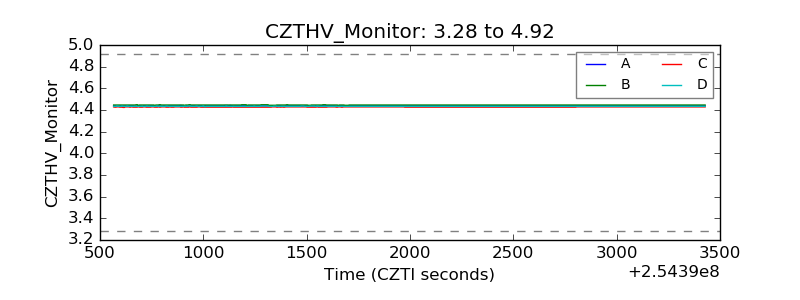 |
| D_VDD | 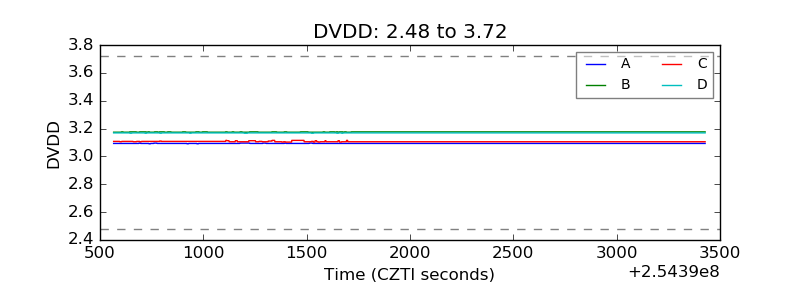 |
| Temperature 1 | 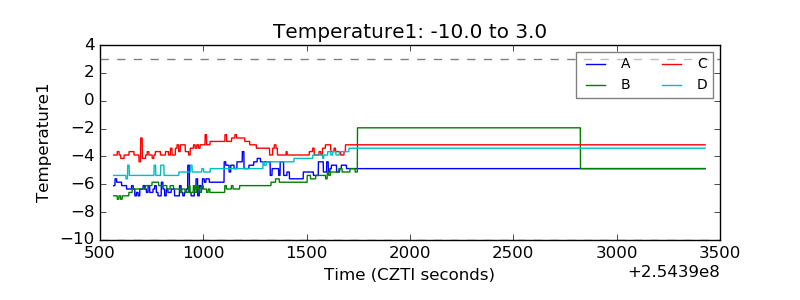 |
| Veto HV Monitor |  |
| Veto LLD | 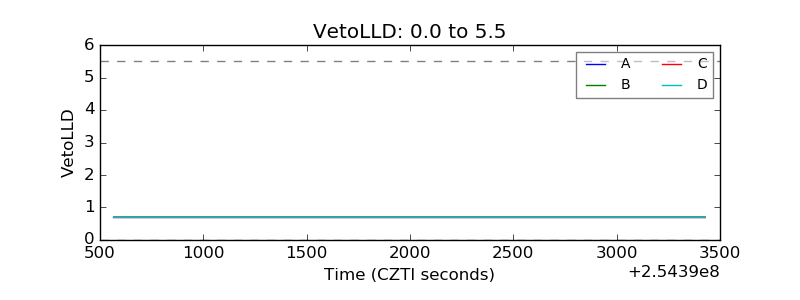 |
| Alpha Counter | 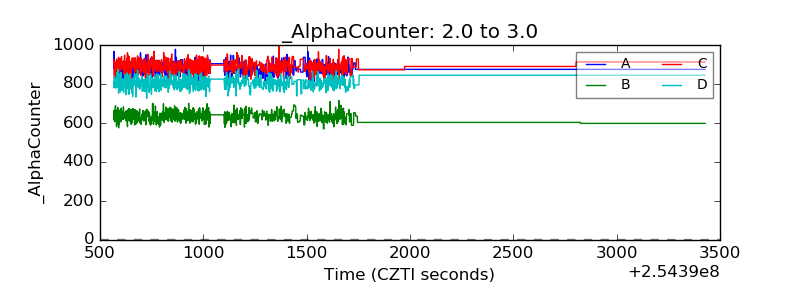 |
| _CPM_Rate | 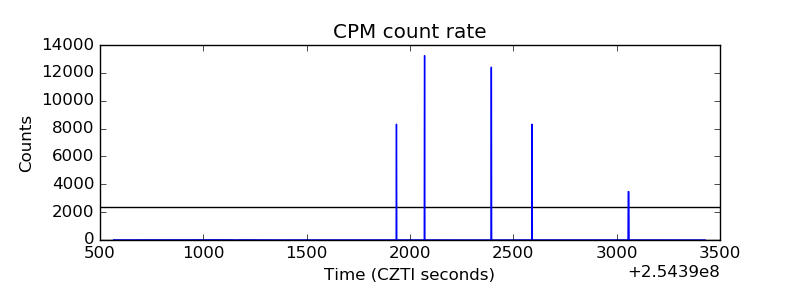 |
| CZT Counter | 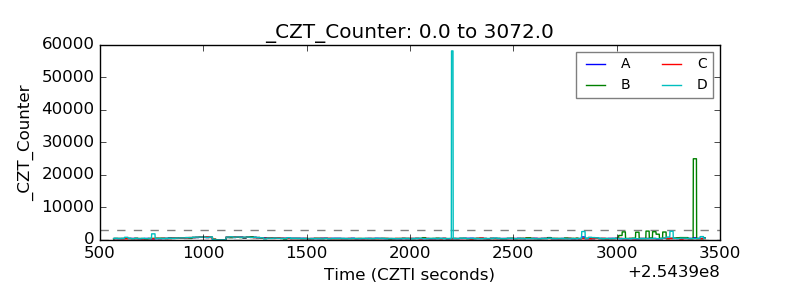 |
| +2.5 Volts monitor |  |
| +5 Volts monitor |  |
| _ROLL_ROT | 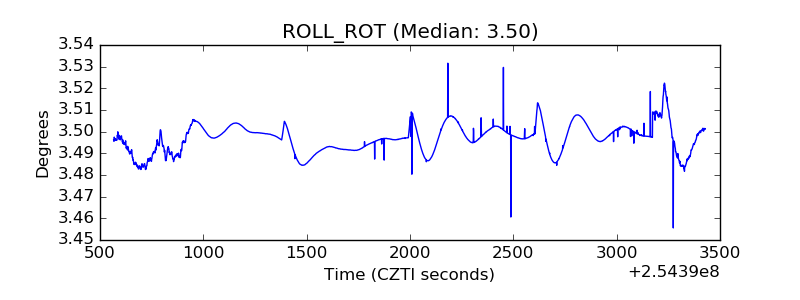 |
| _Roll_DEC | 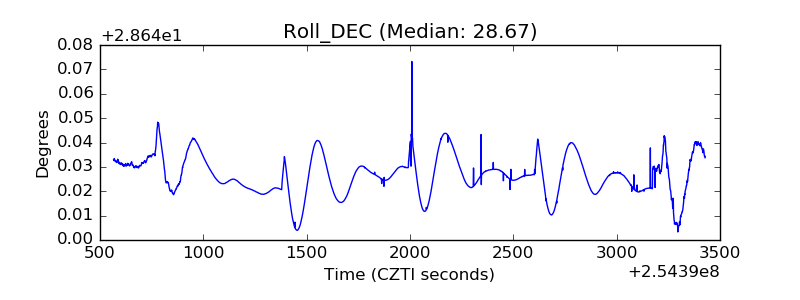 |
| _Roll_RA | 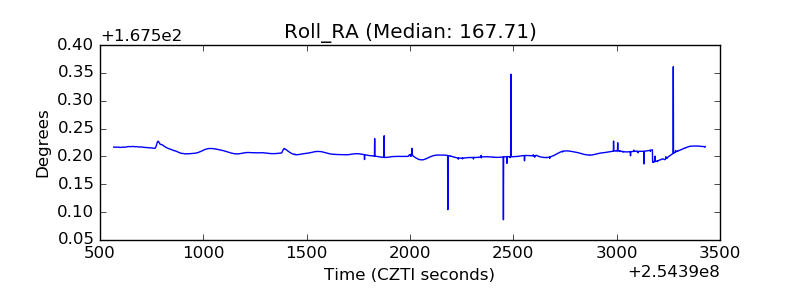 |
| Veto Counter | 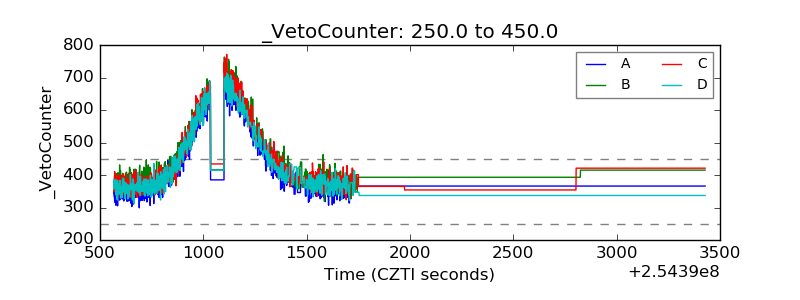 |