| Param | Original file | Final file |
|---|---|---|
| Filename | modeM0/AS1A04_201T03_9000001862_12558cztM0_level2.evt | modeM0/AS1A04_201T03_9000001862_12558cztM0_level2_quad_clean.evt |
| Size (bytes) | 626,636,160 | 95,725,440 |
| Size | 597.6 MB | 91.3 MB |
| Events in quadrant A | 4,069,531 | 578,701 |
| Events in quadrant B | 5,051,816 | 587,394 |
| Events in quadrant C | 3,857,073 | 583,255 |
| Events in quadrant D | 5,418,746 | 554,663 |
| Mode SS | |||
|---|---|---|---|
| Quadrant | BADHDUFLAG | Total packets | Discarded packets |
| A | 0 | 174 | 0 |
| B | 0 | 174 | 0 |
| C | 0 | 174 | 0 |
| D | 0 | 174 | 0 |
| Mode M0 | |||
|---|---|---|---|
| Quadrant | BADHDUFLAG | Total packets | Discarded packets |
| A | 0 | 17750 | 1 |
| B | 0 | 20562 | 1 |
| C | 0 | 17460 | 1 |
| D | 0 | 21690 | 1 |
| Mode M9 | |||
|---|---|---|---|
| Quadrant | BADHDUFLAG | Total packets | Discarded packets |
| A | 0 | 3 | 0 |
| B | 0 | 3 | 0 |
| C | 0 | 3 | 0 |
| D | 0 | 3 | 0 |
| Quadrant | Total seconds | Saturated seconds | Saturation percentage |
|---|---|---|---|
| A | 8559 | 142 | 1.659072% |
| B | 8559 | 393 | 4.591658% |
| C | 8559 | 111 | 1.296880% |
| D | 8559 | 267 | 3.119523% |
Noise dominated data is calculated using 1-second bins in cleaned event files. If a bin has >2000 counts, and if more than 50% of those come from <1% of pixels, then it is considered to be noise-dominated and hence unusable.
| Quadrant | # 1 sec bins | Bins with >0 counts | Bins with >2000 counts | High rate bins dominated by noise | Noise dominated (total time) | Noise dominated (detector-on time) | Marked lightcurve |
|---|---|---|---|---|---|---|---|
| A | 8880 | 8560 | 10 | 10 | 0.11% | 0.12% | 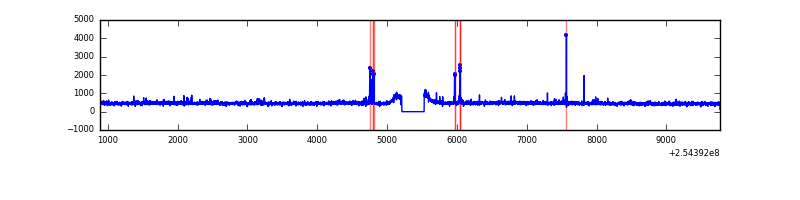 |
| B | 8880 | 8560 | 230 | 230 | 2.59% | 2.69% | 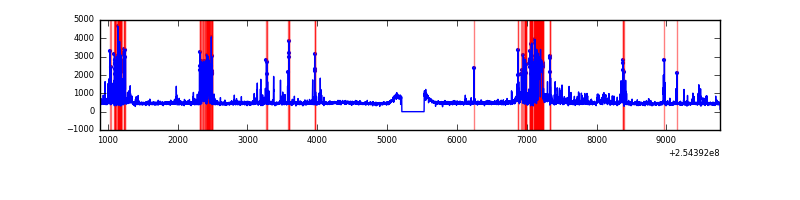 |
| C | 8880 | 8560 | 1 | 1 | 0.01% | 0.01% | 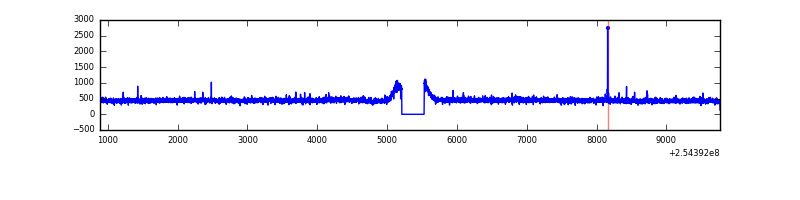 |
| D | 8880 | 8560 | 154 | 154 | 1.73% | 1.80% | 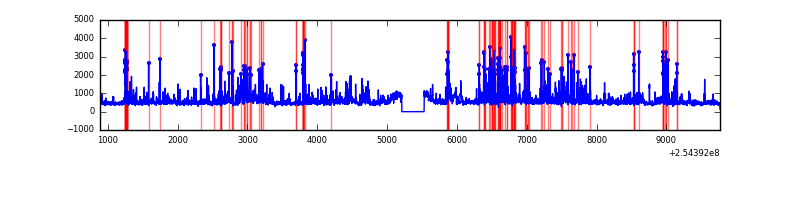 |
Top three noisy pixels from each quadrant. If the there are fewer than three noisy pixels in the level2.evt file, extra rows are filled as -1
| Pixel properties | Quadrant properties | ||||||
|---|---|---|---|---|---|---|---|
| Quadrant | DetID | PixID | Counts | Sigma | Mean | Median | Sigma |
| A | 13 | 248 | 93822 | 449.12 | 1004 | 980 | 206.7 |
| A | 1 | 162 | 39156 | 184.68 | 1004 | 980 | 206.7 |
| A | 1 | 178 | 22327 | 103.27 | 1004 | 980 | 206.7 |
| B | 4 | 239 | 976997 | 5082.91 | 991 | 967 | 192.0 |
| B | 0 | 230 | 95896 | 494.37 | 991 | 967 | 192.0 |
| B | 0 | 85 | 22568 | 112.49 | 991 | 967 | 192.0 |
| C | 14 | 234 | 12406 | 49.4 | 985 | 987 | 231.2 |
| C | 13 | 61 | 7209 | 26.92 | 985 | 987 | 231.2 |
| C | 9 | 221 | 4191 | 13.86 | 985 | 987 | 231.2 |
| D | 1 | 52 | 1084034 | 4602.98 | 968 | 937 | 235.3 |
| D | 11 | 176 | 426452 | 1808.37 | 968 | 937 | 235.3 |
| D | 13 | 249 | 51076 | 213.08 | 968 | 937 | 235.3 |
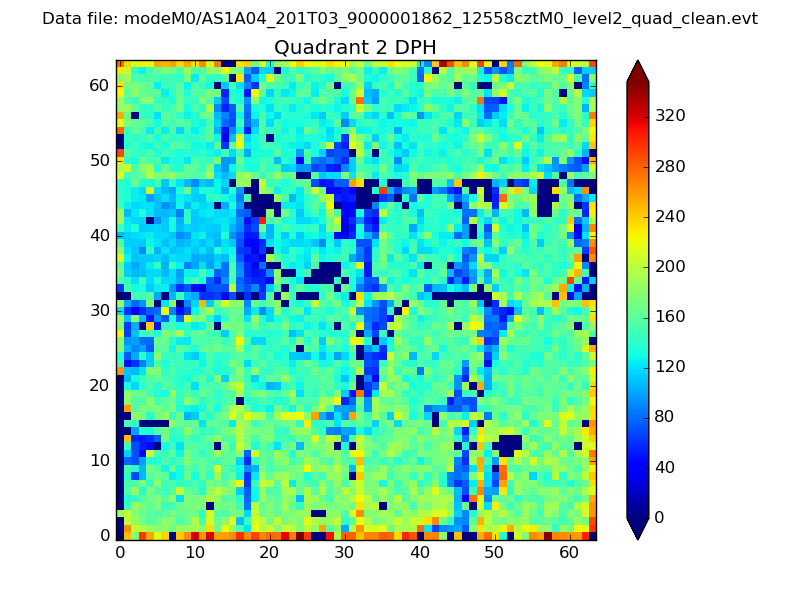
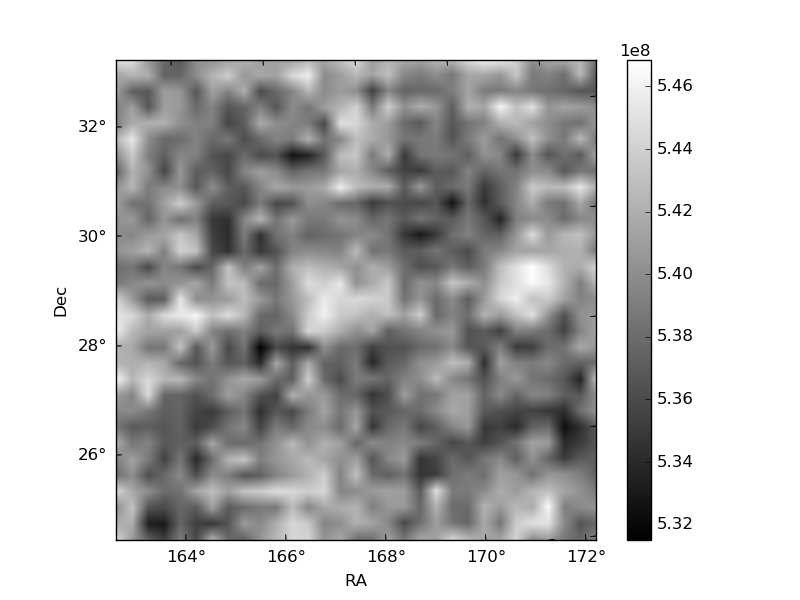
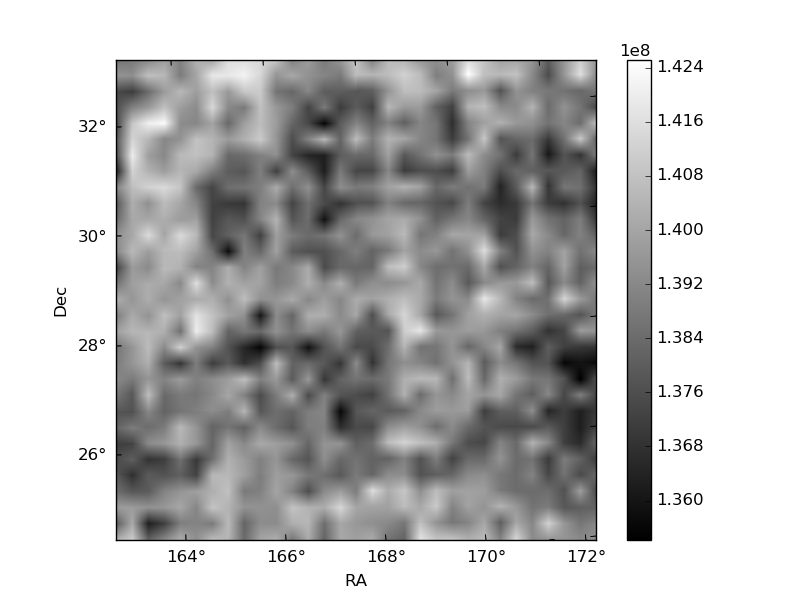
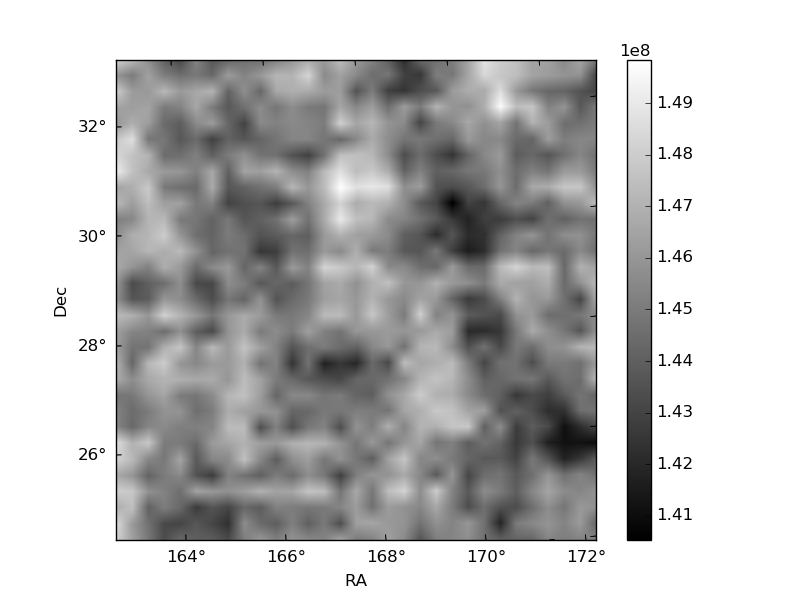
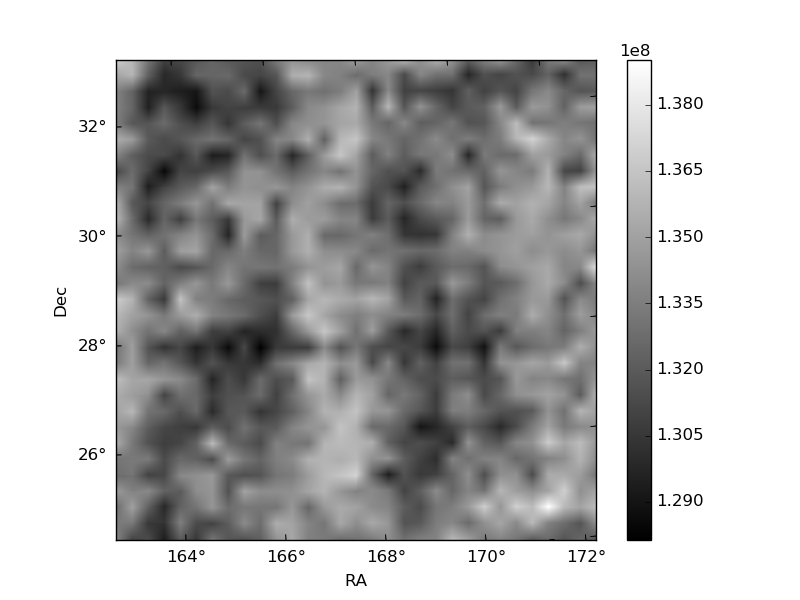
Histogram calculated using DETX and DETY for each event in the final _common_clean file
| Quadrant A | 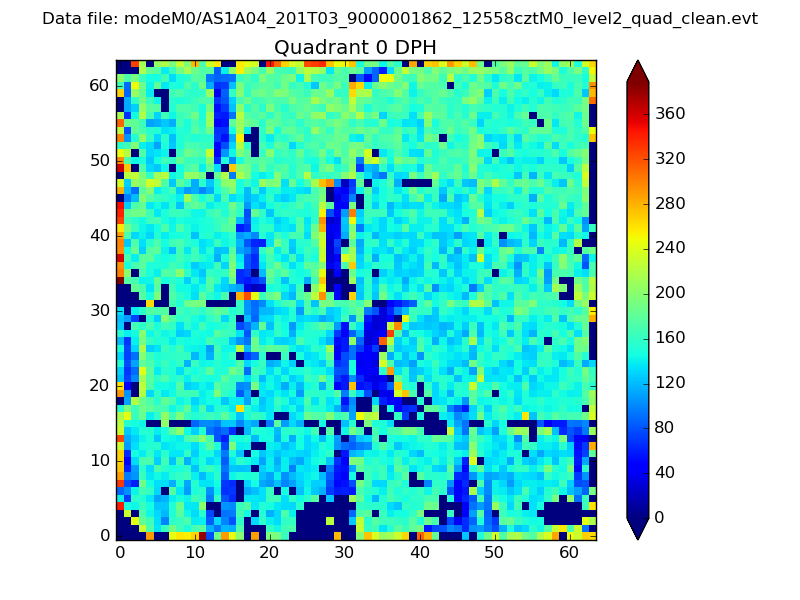 |
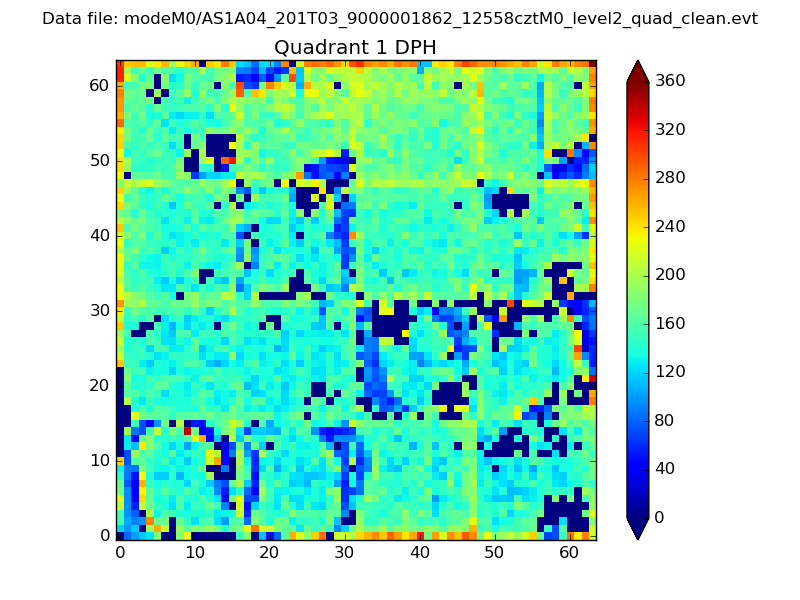 |
Quadrant B |
|---|---|---|---|
| Quadrant D | 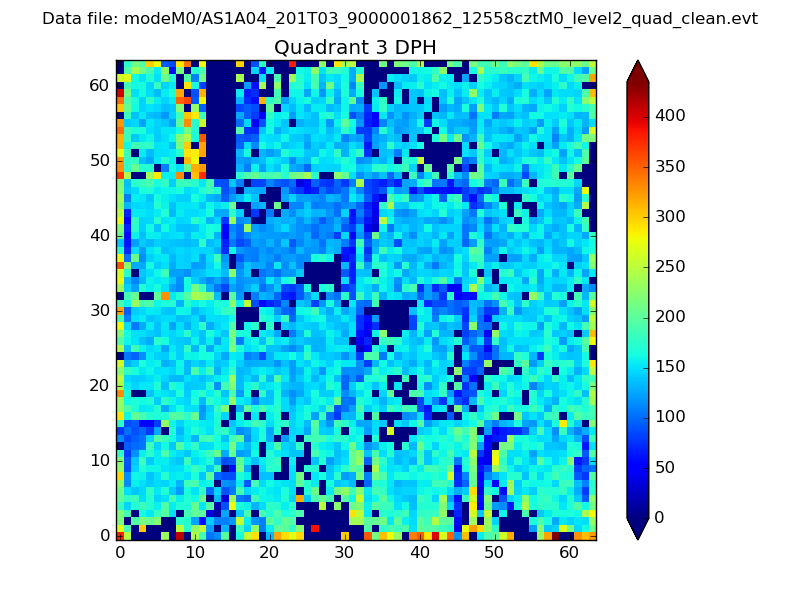 |
 |
Quadrant C |
| Plot type | Count rate plots | Images |
|---|---|---|
| Comparison with Poisson distribution Blue bars denote a histogram of data divided into 1 sec bins. Red curve is a Poisson curve with rate = median count rate of data. |
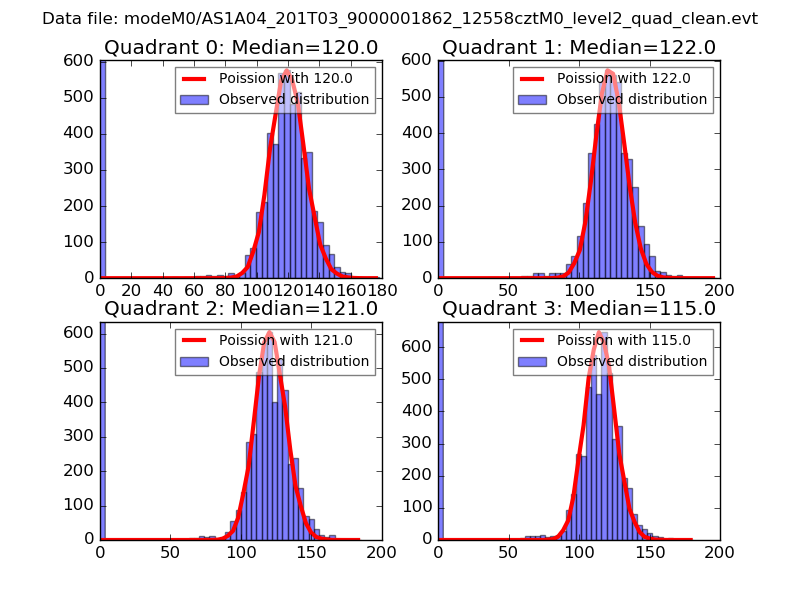 |
 |
| Quadrant-wise count rates Data is divided into 100 sec bins |
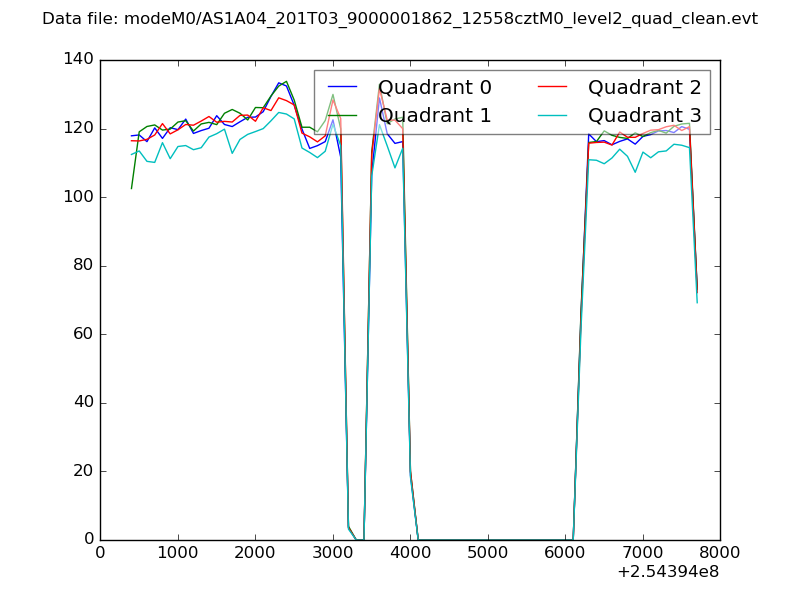 |
|
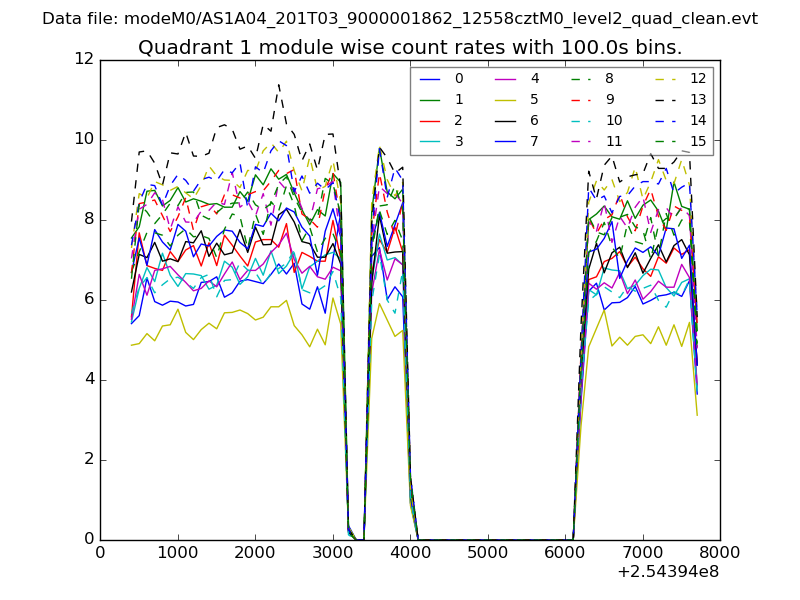
| Module-wise count rates for Quadrant A Data is divided into 100 sec bins |
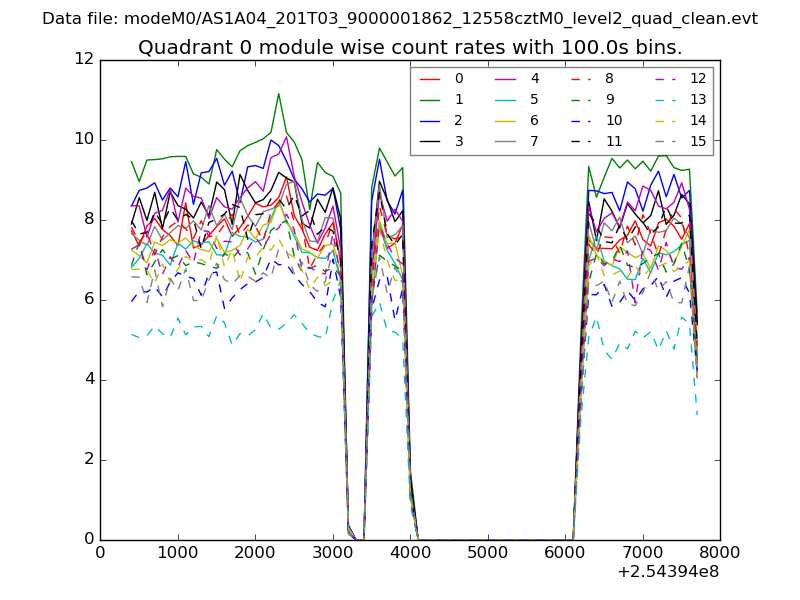 |
 |
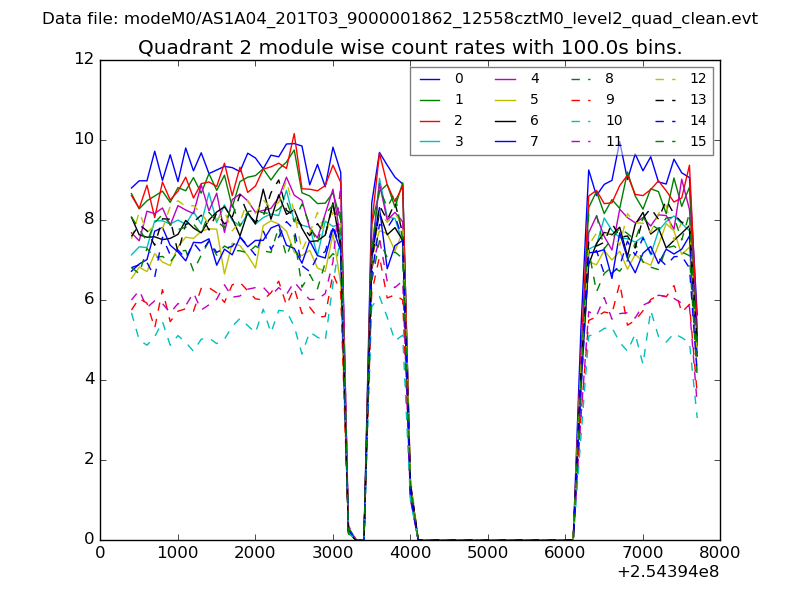
| Module-wise count rates for Quadrant B Data is divided into 100 sec bins |
 |
 |
| Module-wise count rates for Quadrant C Data is divided into 100 sec bins |
 |
 |
| Module-wise count rates for Quadrant D Data is divided into 100 sec bins |
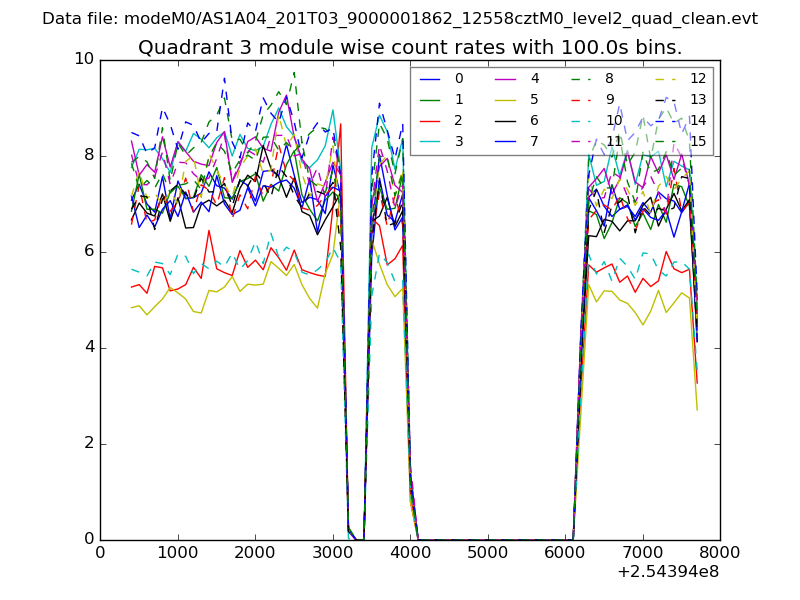 |
 |
| Parameter | Plot |
|---|---|
| CZT HV Monitor | 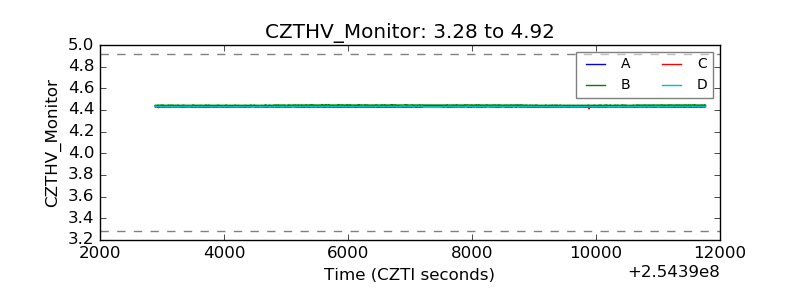 |
| D_VDD | 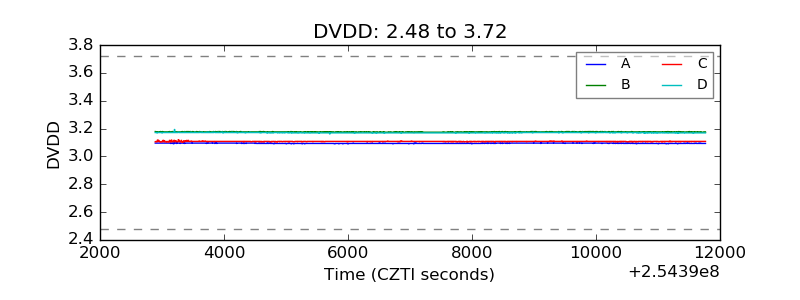 |
| Temperature 1 | 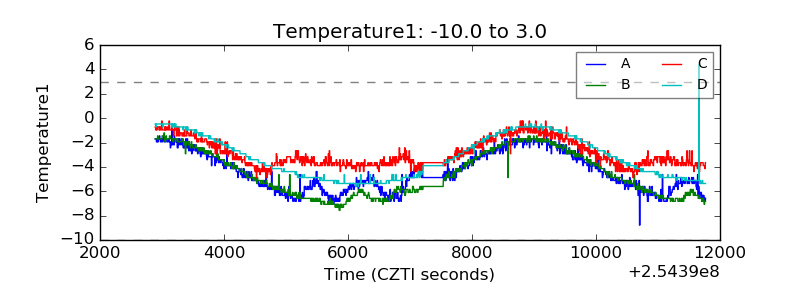 |
| Veto HV Monitor | 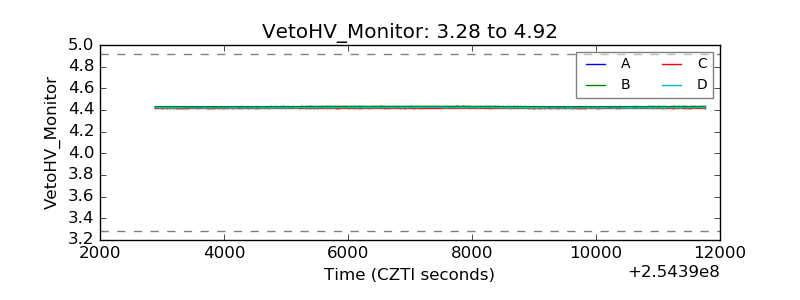 |
| Veto LLD | 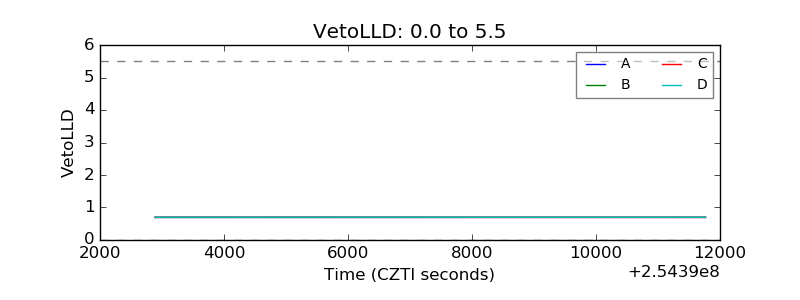 |
| Alpha Counter | 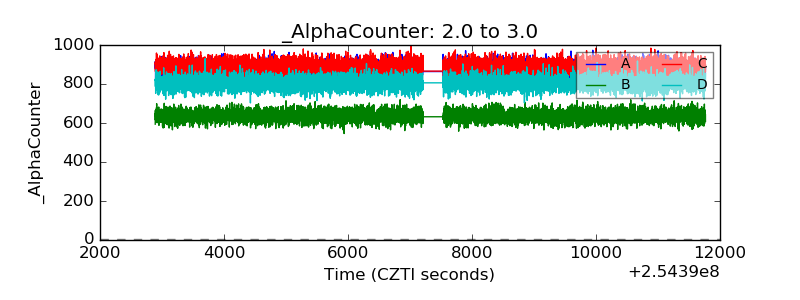 |
| _CPM_Rate | 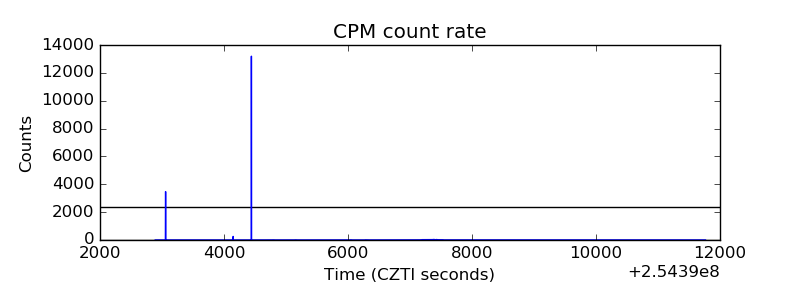 |
| CZT Counter | 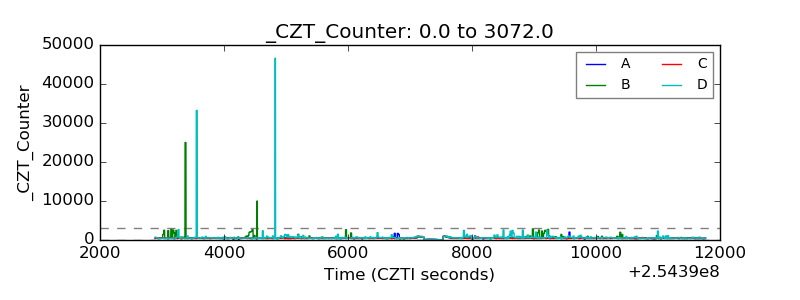 |
| +2.5 Volts monitor | 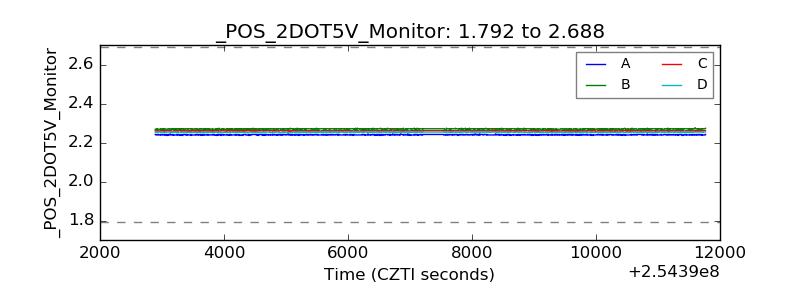 |
| +5 Volts monitor | 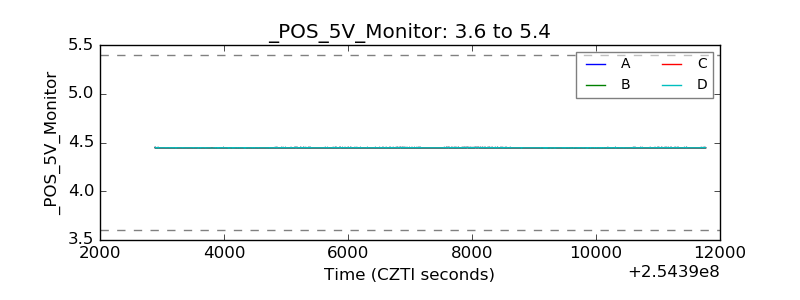 |
| _ROLL_ROT | 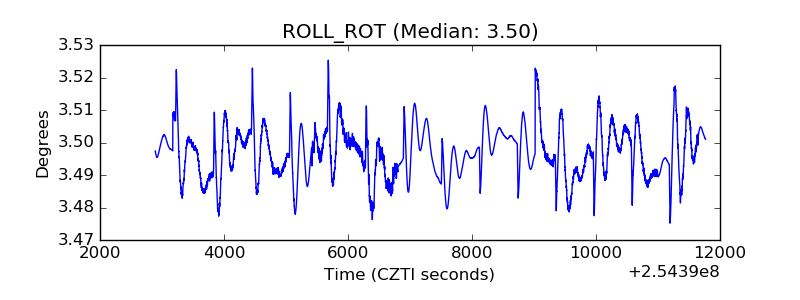 |
| _Roll_DEC | 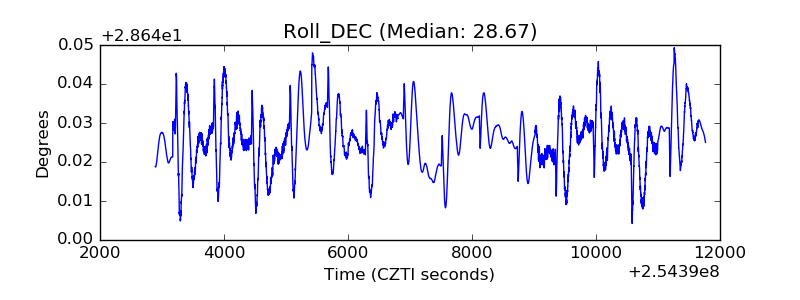 |
| _Roll_RA | 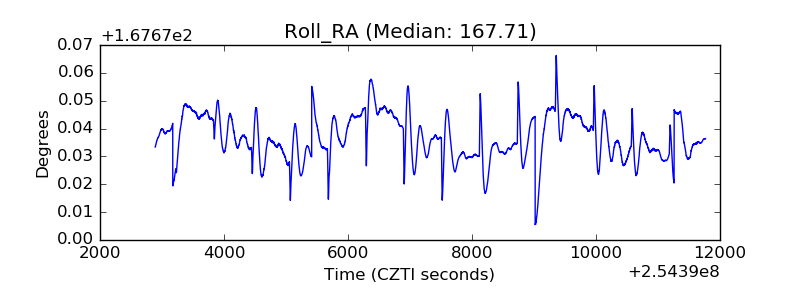 |
| Veto Counter | 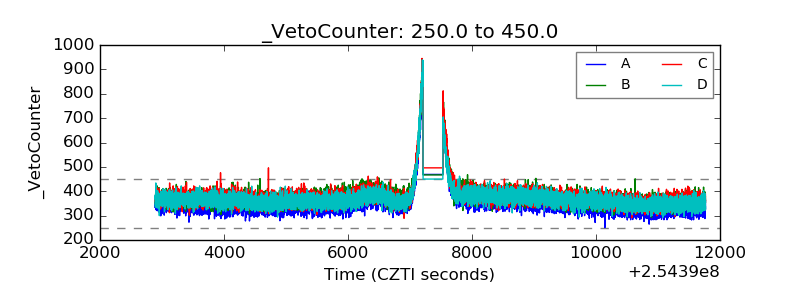 |