| Param | Original file | Final file |
|---|---|---|
| Filename | modeM0/AS1C03_021T01_9000001864_12558cztM0_level2.evt | modeM0/AS1C03_021T01_9000001864_12558cztM0_level2_quad_clean.evt |
| Size (bytes) | 958,055,040 | 147,574,080 |
| Size | 913.7 MB | 140.7 MB |
| Events in quadrant A | 6,411,148 | 891,835 |
| Events in quadrant B | 8,018,740 | 896,464 |
| Events in quadrant C | 6,146,994 | 899,175 |
| Events in quadrant D | 7,535,636 | 860,445 |
| Mode M9 | |||
|---|---|---|---|
| Quadrant | BADHDUFLAG | Total packets | Discarded packets |
| A | 0 | 23 | 0 |
| B | 0 | 23 | 0 |
| C | 0 | 23 | 0 |
| D | 0 | 23 | 0 |
| Mode M0 | |||
|---|---|---|---|
| Quadrant | BADHDUFLAG | Total packets | Discarded packets |
| A | 0 | 27784 | 4 |
| B | 0 | 32457 | 3 |
| C | 0 | 27341 | 3 |
| D | 0 | 31579 | 3 |
| Mode SS | |||
|---|---|---|---|
| Quadrant | BADHDUFLAG | Total packets | Discarded packets |
| A | 0 | 272 | 0 |
| B | 0 | 272 | 0 |
| C | 0 | 272 | 0 |
| D | 0 | 272 | 0 |
| Quadrant | Total seconds | Saturated seconds | Saturation percentage |
|---|---|---|---|
| A | 13336 | 156 | 1.169766% |
| B | 13336 | 570 | 4.274145% |
| C | 13336 | 107 | 0.802340% |
| D | 13336 | 269 | 2.017097% |
Noise dominated data is calculated using 1-second bins in cleaned event files. If a bin has >2000 counts, and if more than 50% of those come from <1% of pixels, then it is considered to be noise-dominated and hence unusable.
| Quadrant | # 1 sec bins | Bins with >0 counts | Bins with >2000 counts | High rate bins dominated by noise | Noise dominated (total time) | Noise dominated (detector-on time) | Marked lightcurve |
|---|---|---|---|---|---|---|---|
| A | 15612 | 13338 | 3 | 3 | 0.02% | 0.02% | 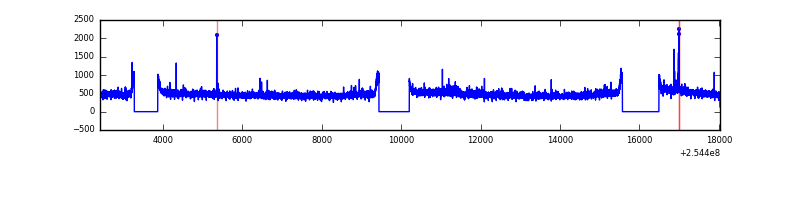 |
| B | 15612 | 13338 | 322 | 322 | 2.06% | 2.41% | 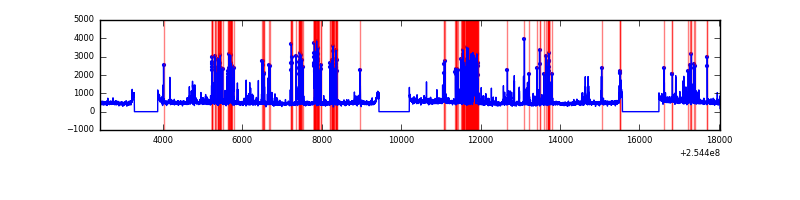 |
| C | 15612 | 13338 | 3 | 3 | 0.02% | 0.02% | 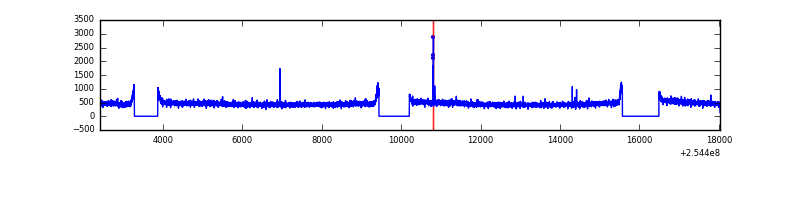 |
| D | 15612 | 13338 | 148 | 148 | 0.95% | 1.11% | 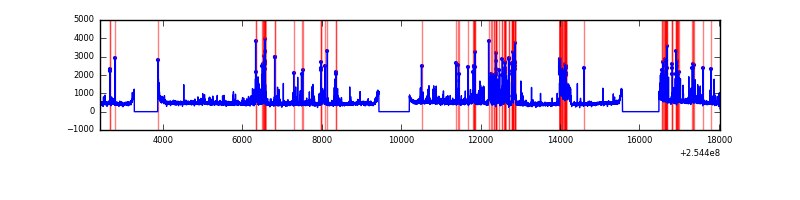 |
Top three noisy pixels from each quadrant. If the there are fewer than three noisy pixels in the level2.evt file, extra rows are filled as -1
| Pixel properties | Quadrant properties | ||||||
|---|---|---|---|---|---|---|---|
| Quadrant | DetID | PixID | Counts | Sigma | Mean | Median | Sigma |
| A | 1 | 162 | 72423 | 214.35 | 1606 | 1569 | 330.6 |
| A | 9 | 143 | 39284 | 114.1 | 1606 | 1569 | 330.6 |
| A | 1 | 178 | 37648 | 109.15 | 1606 | 1569 | 330.6 |
| B | 4 | 239 | 1446499 | 4728.32 | 1589 | 1546 | 305.6 |
| B | 3 | 64 | 74845 | 239.86 | 1589 | 1546 | 305.6 |
| B | 11 | 51 | 72467 | 232.07 | 1589 | 1546 | 305.6 |
| C | 14 | 234 | 16147 | 40.01 | 1572 | 1580 | 364.1 |
| C | 13 | 61 | 11679 | 27.74 | 1572 | 1580 | 364.1 |
| C | 3 | 202 | 4022 | 6.71 | 1572 | 1580 | 364.1 |
| D | 1 | 52 | 869704 | 2319.8 | 1559 | 1516 | 374.3 |
| D | 13 | 104 | 367888 | 978.95 | 1559 | 1516 | 374.3 |
| D | 11 | 176 | 176663 | 467.99 | 1559 | 1516 | 374.3 |
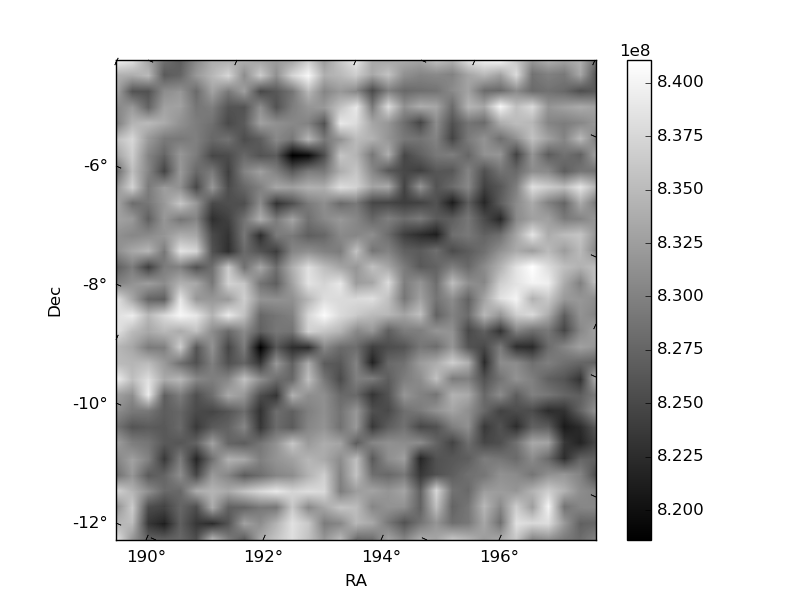
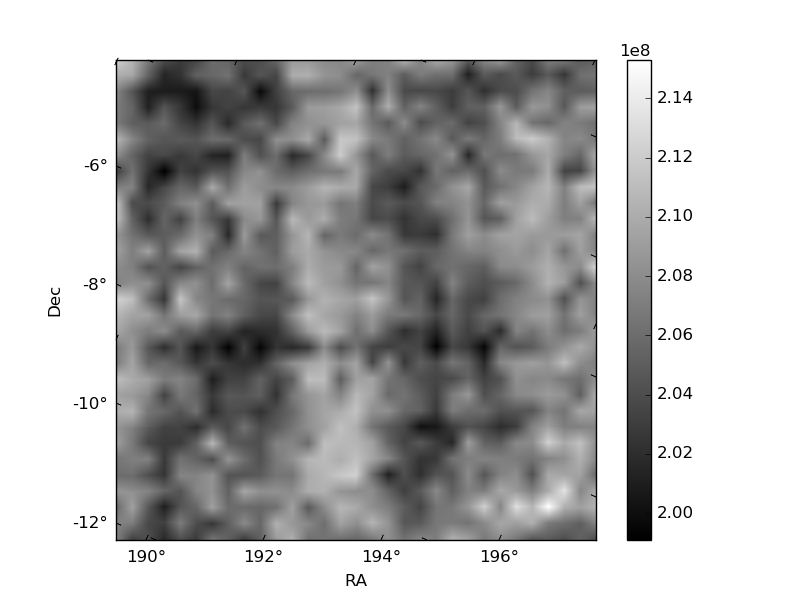
Histogram calculated using DETX and DETY for each event in the final _common_clean file
| Quadrant A | 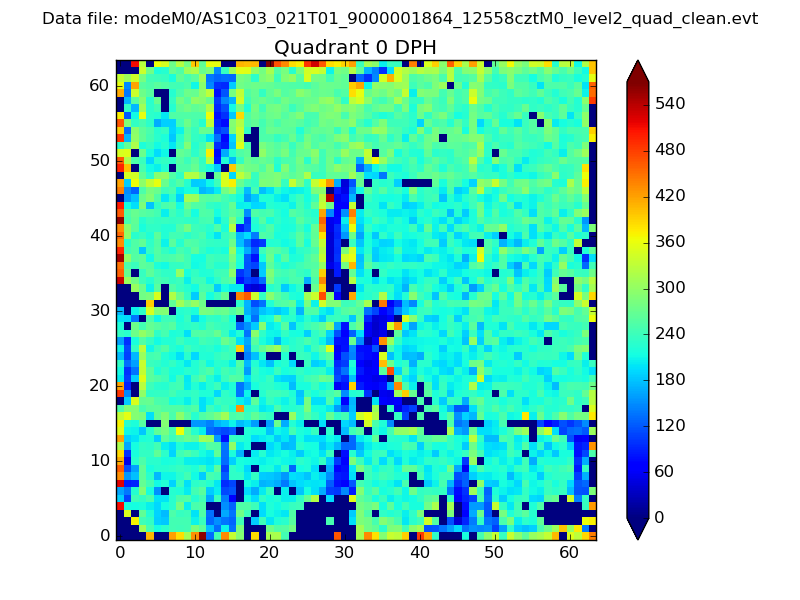 |
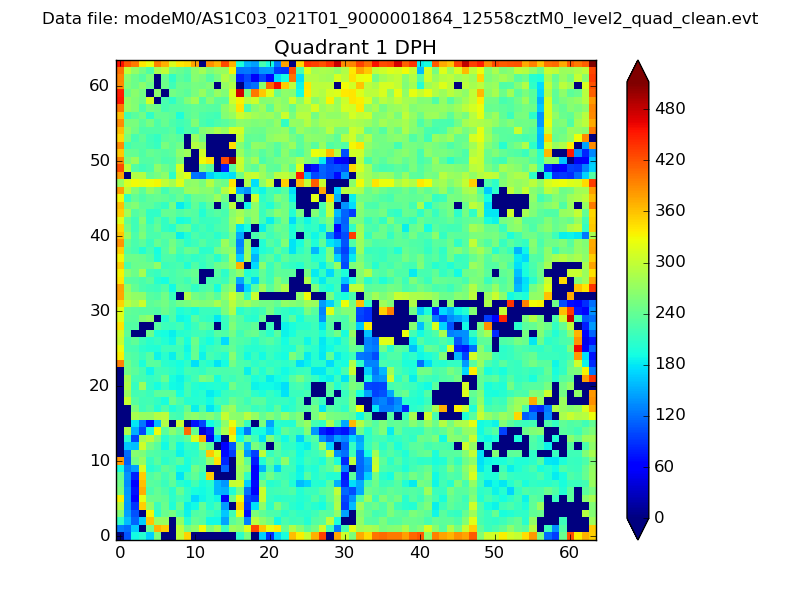 |
Quadrant B |
|---|---|---|---|
| Quadrant D | 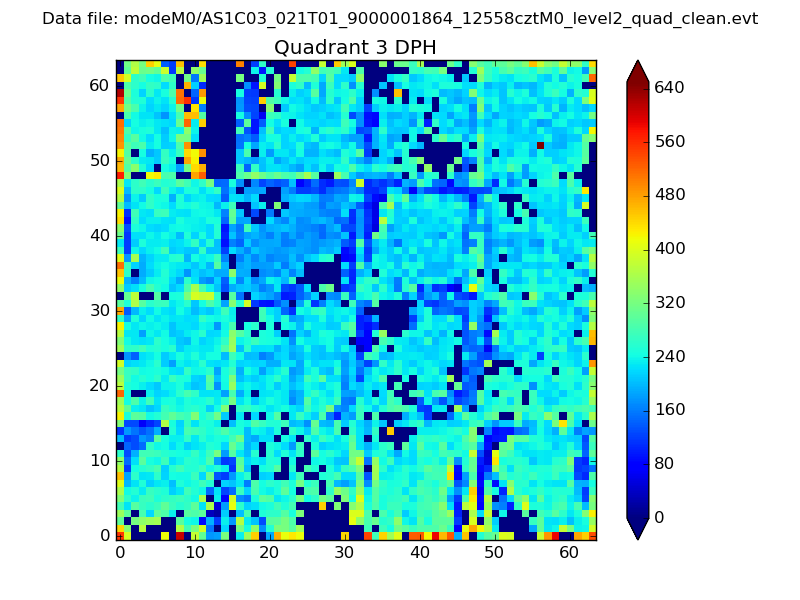 |
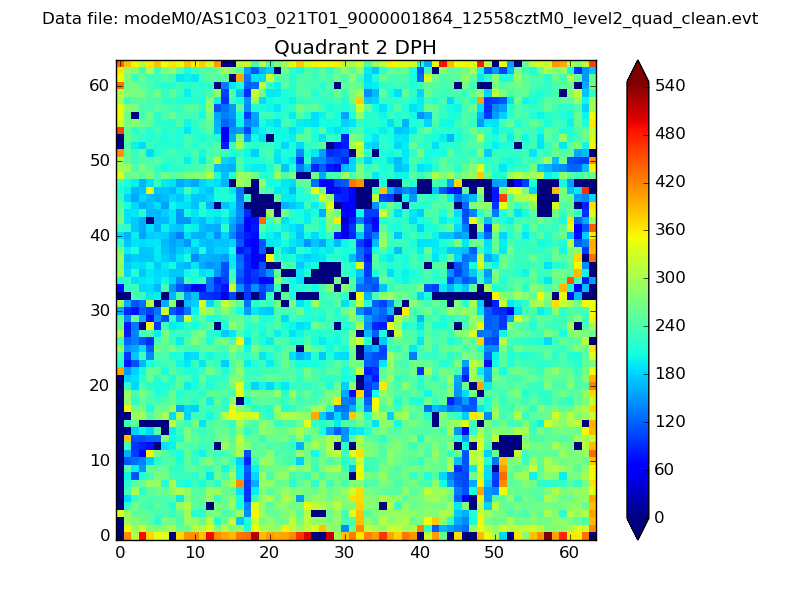 |
Quadrant C |
| Plot type | Count rate plots | Images |
|---|---|---|
| Comparison with Poisson distribution Blue bars denote a histogram of data divided into 1 sec bins. Red curve is a Poisson curve with rate = median count rate of data. |
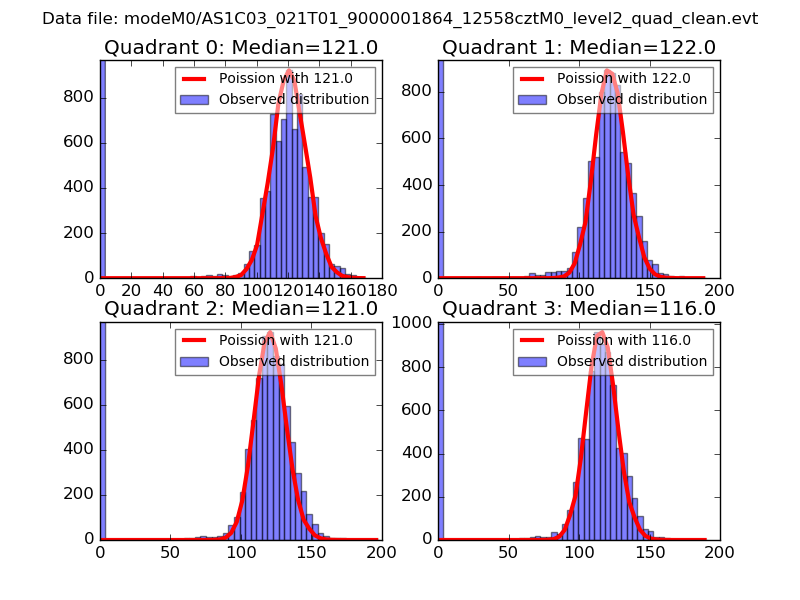 |
 |
| Quadrant-wise count rates Data is divided into 100 sec bins |
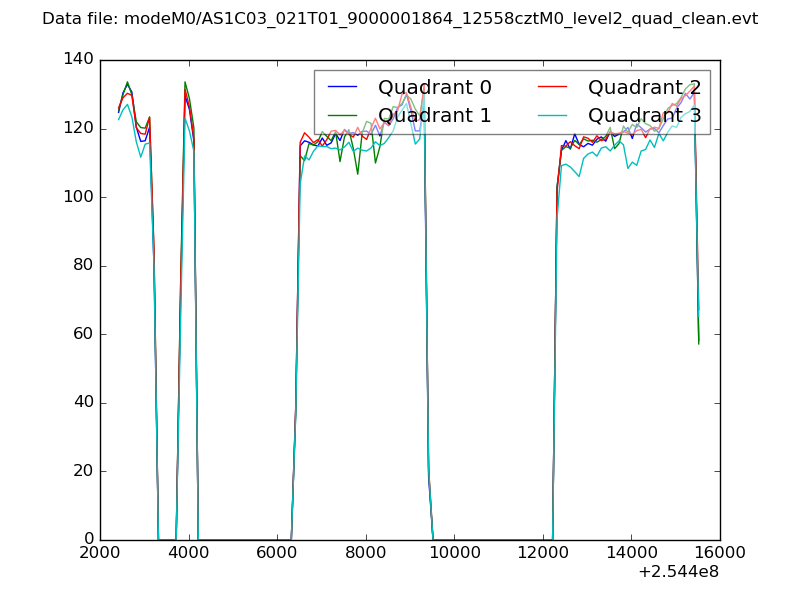 |
|
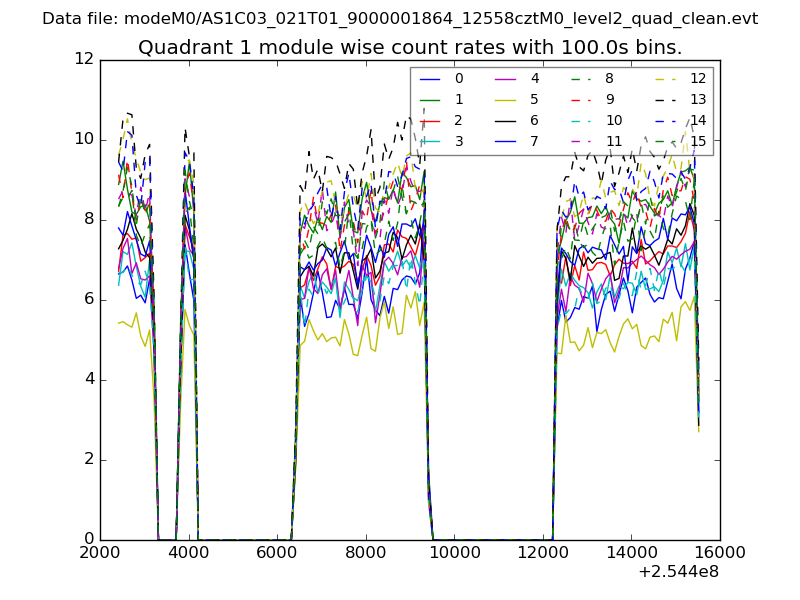
| Module-wise count rates for Quadrant A Data is divided into 100 sec bins |
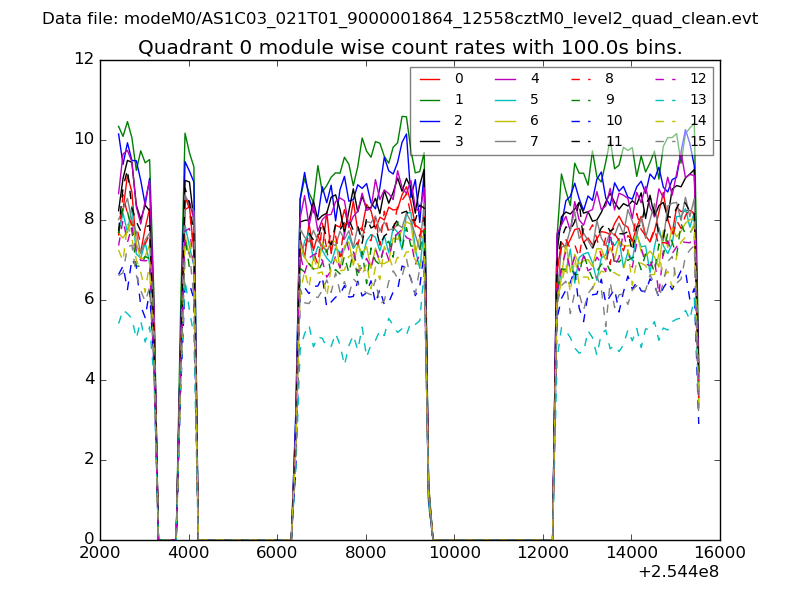 |
 |
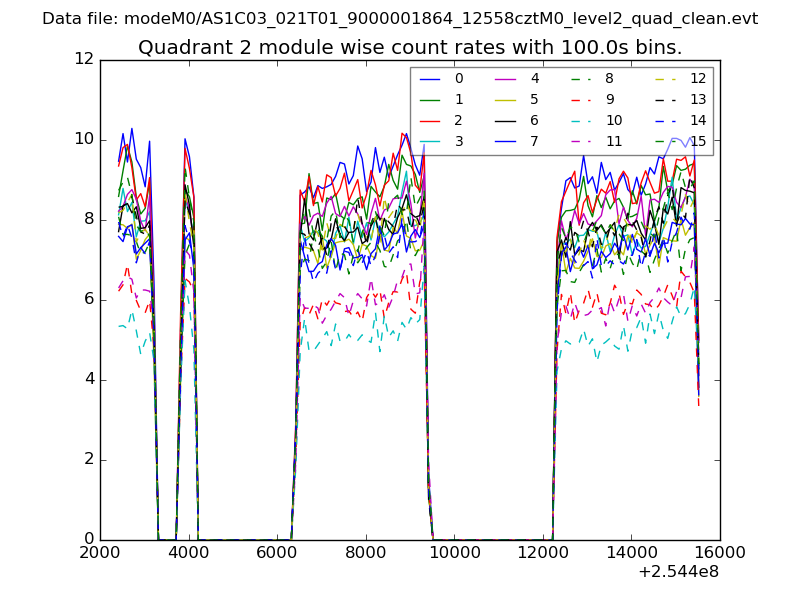
| Module-wise count rates for Quadrant B Data is divided into 100 sec bins |
 |
 |
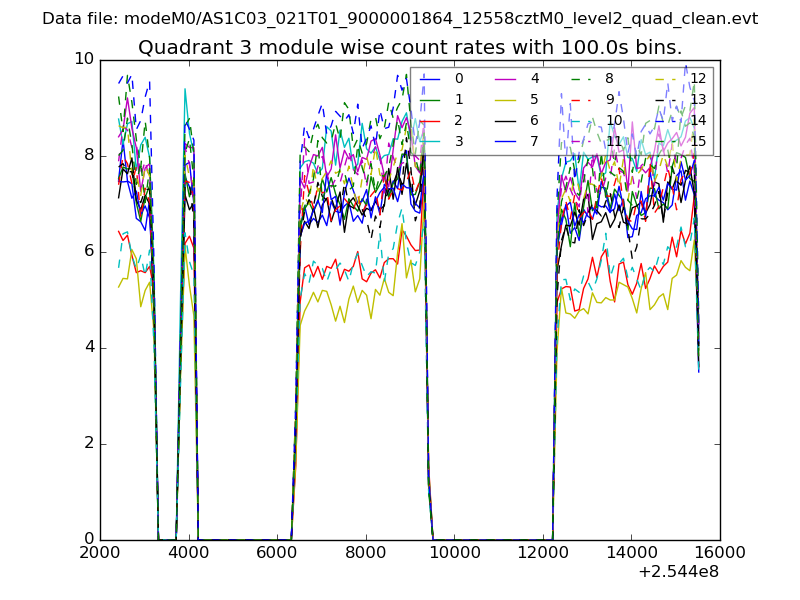
| Module-wise count rates for Quadrant C Data is divided into 100 sec bins |
 |
 |
| Module-wise count rates for Quadrant D Data is divided into 100 sec bins |
 |
 |
| Parameter | Plot |
|---|---|
| CZT HV Monitor | 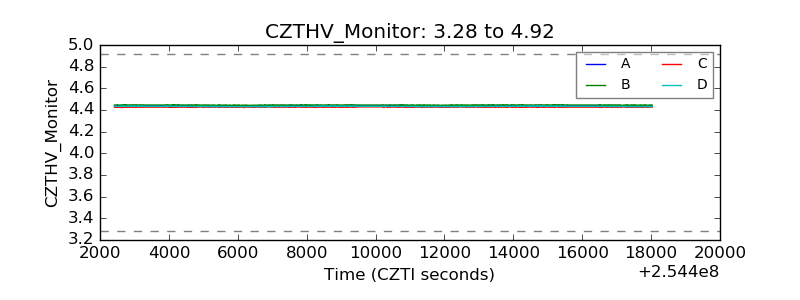 |
| D_VDD | 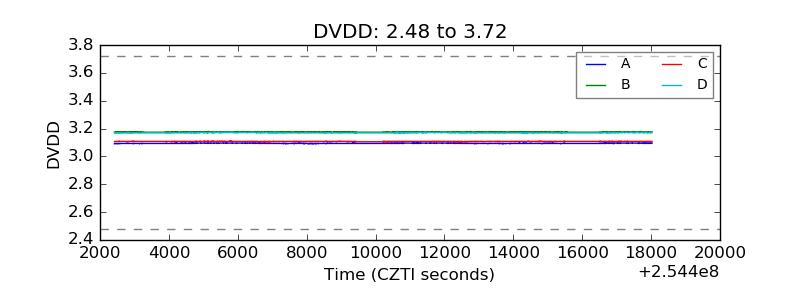 |
| Temperature 1 | 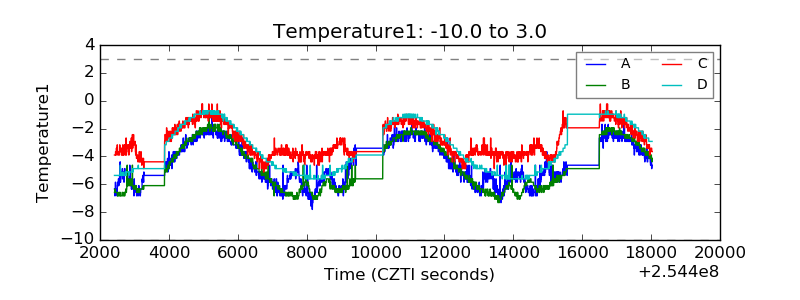 |
| Veto HV Monitor | 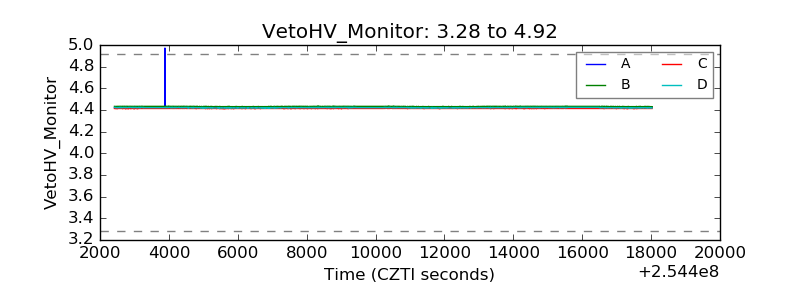 |
| Veto LLD | 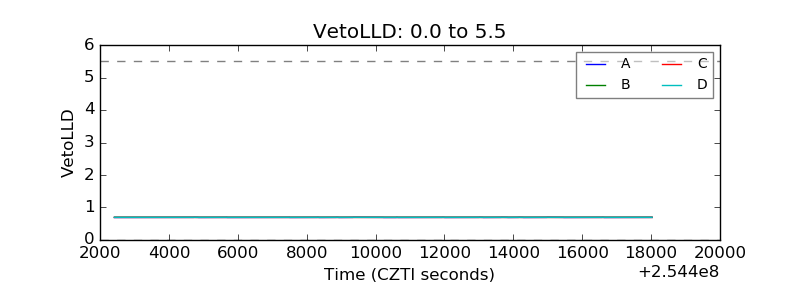 |
| Alpha Counter | 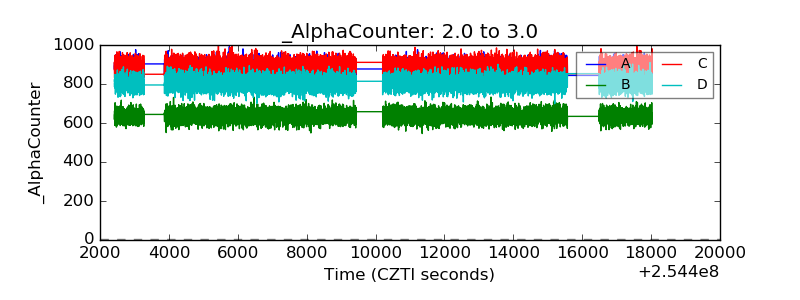 |
| _CPM_Rate | 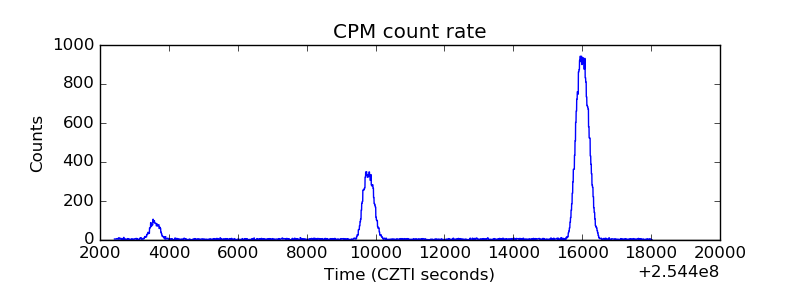 |
| CZT Counter | 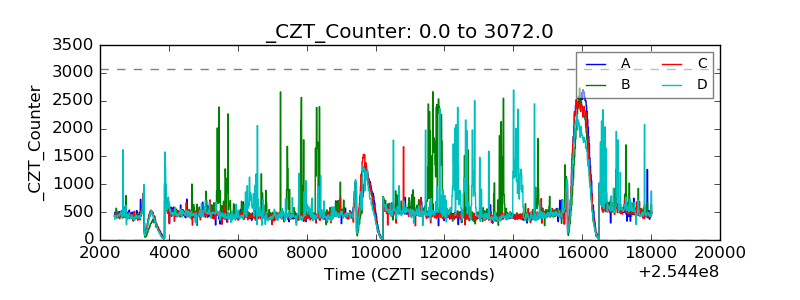 |
| +2.5 Volts monitor | 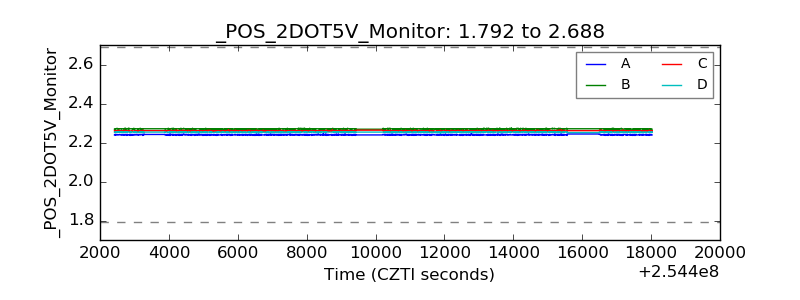 |
| +5 Volts monitor |  |
| _ROLL_ROT | 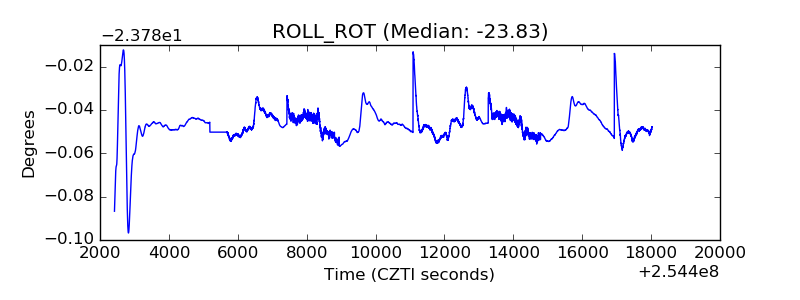 |
| _Roll_DEC | 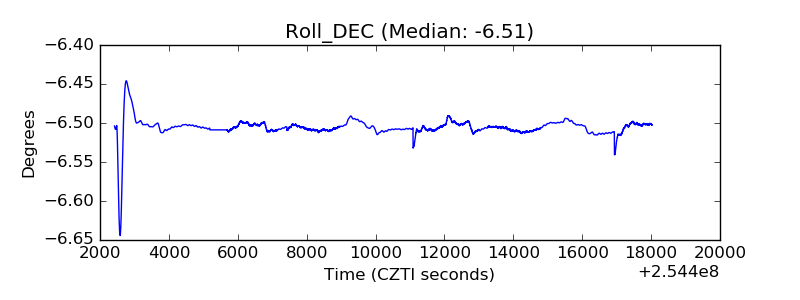 |
| _Roll_RA | 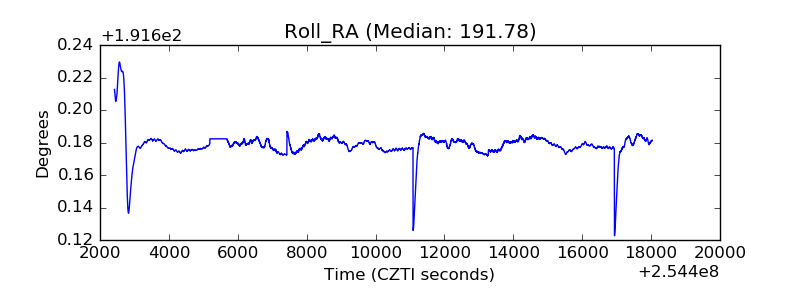 |
| Veto Counter | 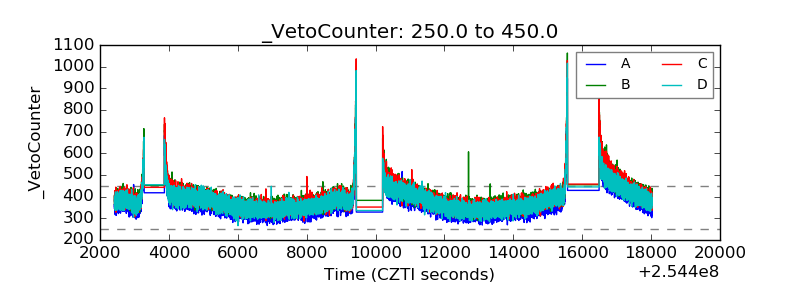 |