| Param | Original file | Final file |
|---|---|---|
| Filename | modeM0/AS1C03_021T01_9000001864_12563cztM0_level2.evt | modeM0/AS1C03_021T01_9000001864_12563cztM0_level2_quad_clean.evt |
| Size (bytes) | 504,463,680 | 104,664,960 |
| Size | 481.1 MB | 99.8 MB |
| Events in quadrant A | 3,466,280 | 684,488 |
| Events in quadrant B | 4,229,366 | 700,223 |
| Events in quadrant C | 3,360,535 | 682,649 |
| Events in quadrant D | 3,767,829 | 636,398 |
| Mode M9 | |||
|---|---|---|---|
| Quadrant | BADHDUFLAG | Total packets | Discarded packets |
| A | 0 | 26 | 0 |
| B | 0 | 26 | 0 |
| C | 0 | 26 | 0 |
| D | 0 | 26 | 0 |
| Mode M0 | |||
|---|---|---|---|
| Quadrant | BADHDUFLAG | Total packets | Discarded packets |
| A | 0 | 14517 | 3 |
| B | 0 | 16862 | 2 |
| C | 0 | 14189 | 2 |
| D | 0 | 15630 | 2 |
| Mode SS | |||
|---|---|---|---|
| Quadrant | BADHDUFLAG | Total packets | Discarded packets |
| A | 0 | 140 | 0 |
| B | 0 | 140 | 0 |
| C | 0 | 140 | 0 |
| D | 0 | 140 | 0 |
| Quadrant | Total seconds | Saturated seconds | Saturation percentage |
|---|---|---|---|
| A | 6675 | 110 | 1.647940% |
| B | 6675 | 302 | 4.524345% |
| C | 6675 | 58 | 0.868914% |
| D | 6675 | 149 | 2.232210% |
Noise dominated data is calculated using 1-second bins in cleaned event files. If a bin has >2000 counts, and if more than 50% of those come from <1% of pixels, then it is considered to be noise-dominated and hence unusable.
| Quadrant | # 1 sec bins | Bins with >0 counts | Bins with >2000 counts | High rate bins dominated by noise | Noise dominated (total time) | Noise dominated (detector-on time) | Marked lightcurve |
|---|---|---|---|---|---|---|---|
| A | 9341 | 6678 | 1 | 1 | 0.01% | 0.01% | 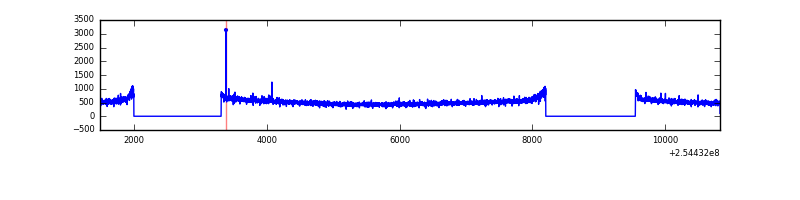 |
| B | 9341 | 6678 | 142 | 142 | 1.52% | 2.13% | 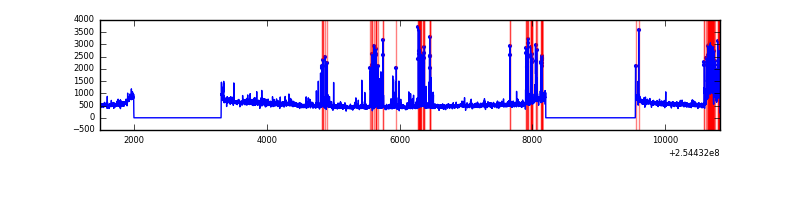 |
| C | 9341 | 6678 | 2 | 2 | 0.02% | 0.03% | 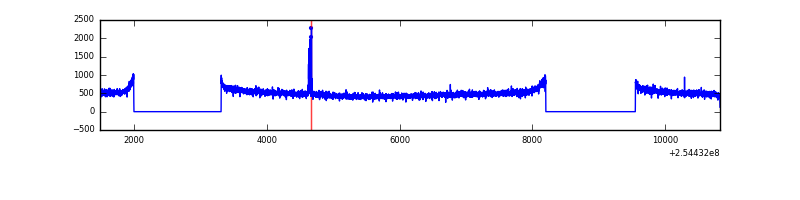 |
| D | 9340 | 6676 | 74 | 74 | 0.79% | 1.11% | 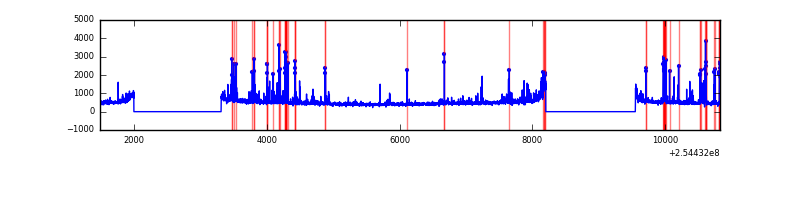 |
Top three noisy pixels from each quadrant. If the there are fewer than three noisy pixels in the level2.evt file, extra rows are filled as -1
| Pixel properties | Quadrant properties | ||||||
|---|---|---|---|---|---|---|---|
| Quadrant | DetID | PixID | Counts | Sigma | Mean | Median | Sigma |
| A | 12 | 189 | 38431 | 212.87 | 878 | 863 | 176.5 |
| A | 12 | 96 | 15617 | 83.6 | 878 | 863 | 176.5 |
| A | 8 | 15 | 9051 | 46.4 | 878 | 863 | 176.5 |
| B | 4 | 239 | 424792 | 2558.04 | 879 | 858 | 165.7 |
| B | 3 | 64 | 274704 | 1652.4 | 879 | 858 | 165.7 |
| B | 11 | 51 | 58079 | 345.27 | 879 | 858 | 165.7 |
| C | 15 | 208 | 30888 | 152.11 | 854 | 860 | 197.4 |
| C | 13 | 61 | 6209 | 27.1 | 854 | 860 | 197.4 |
| C | 3 | 202 | 2097 | 6.27 | 854 | 860 | 197.4 |
| D | 1 | 52 | 209235 | 1050.54 | 830 | 809 | 198.4 |
| D | 11 | 176 | 173932 | 872.6 | 830 | 809 | 198.4 |
| D | 13 | 249 | 95441 | 476.98 | 830 | 809 | 198.4 |
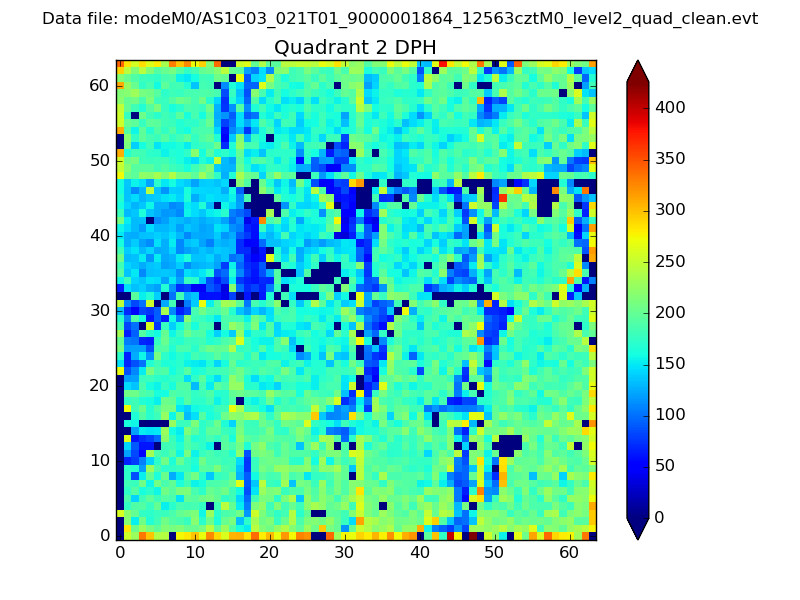
Histogram calculated using DETX and DETY for each event in the final _common_clean file
| Quadrant A | 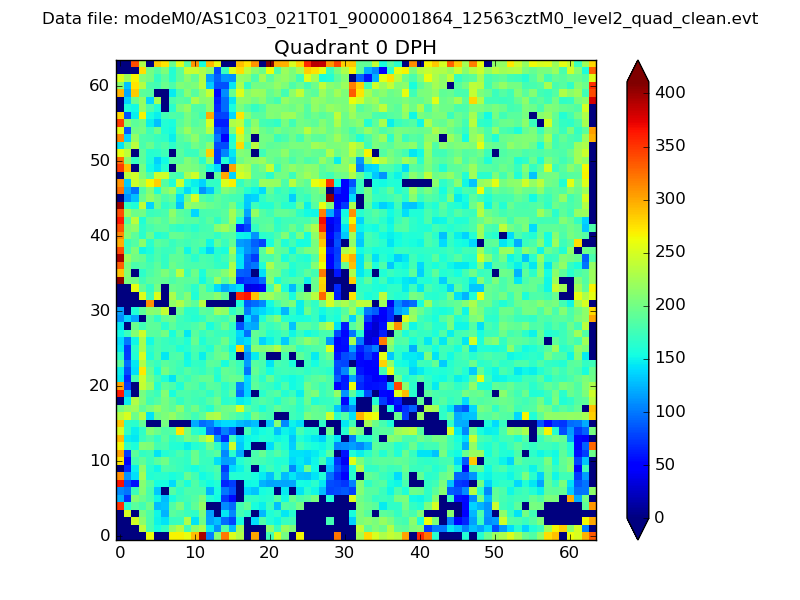 |
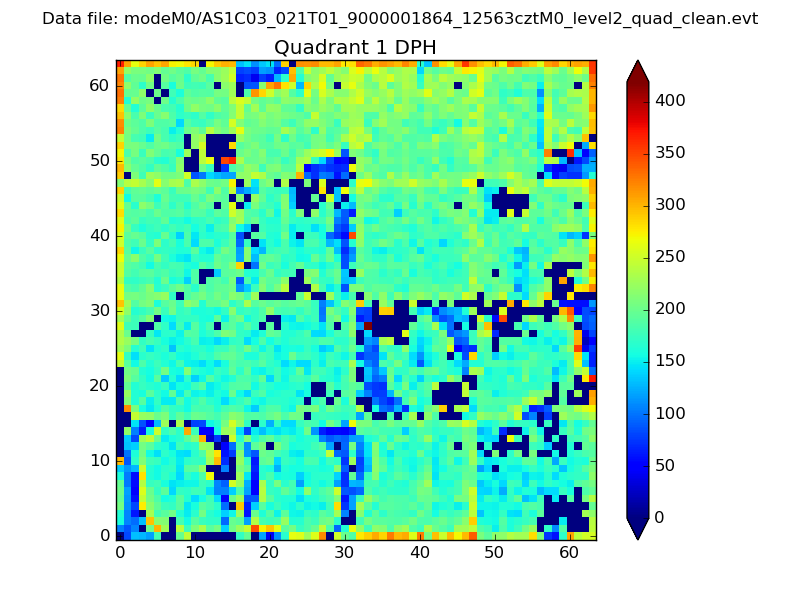 |
Quadrant B |
|---|---|---|---|
| Quadrant D | 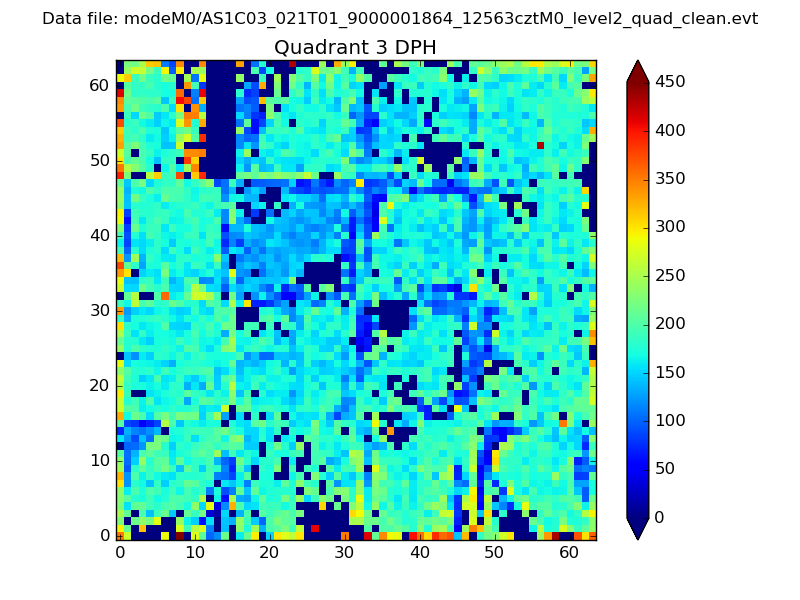 |
 |
Quadrant C |
| Plot type | Count rate plots | Images |
|---|---|---|
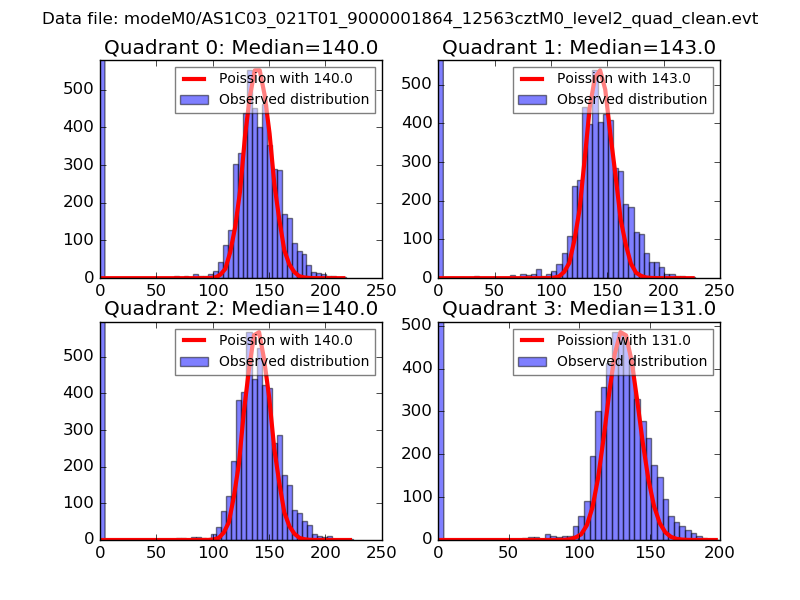
| Comparison with Poisson distribution Blue bars denote a histogram of data divided into 1 sec bins. Red curve is a Poisson curve with rate = median count rate of data. |
 |
 |
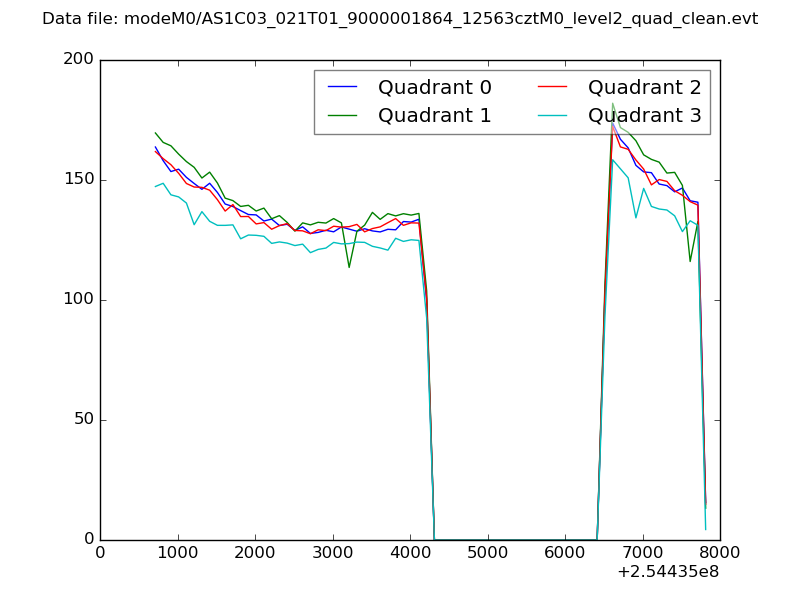
| Quadrant-wise count rates Data is divided into 100 sec bins |
 |
|
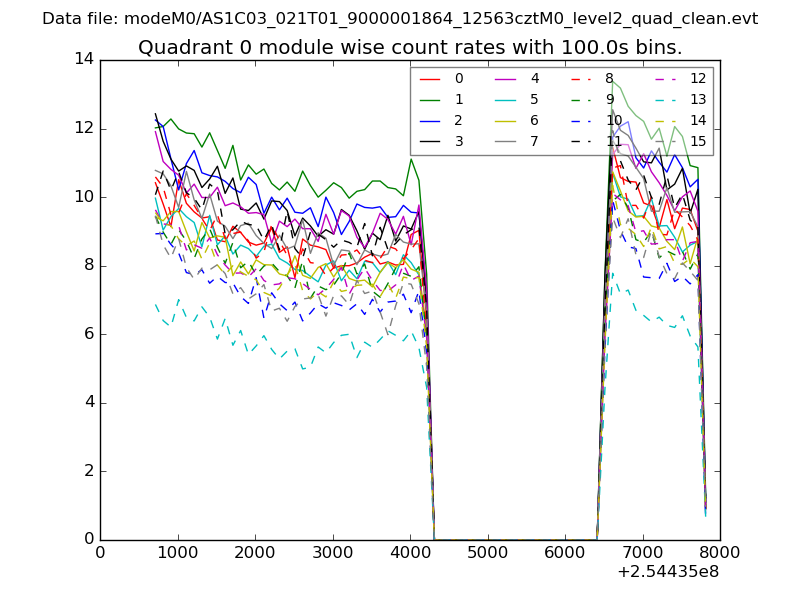
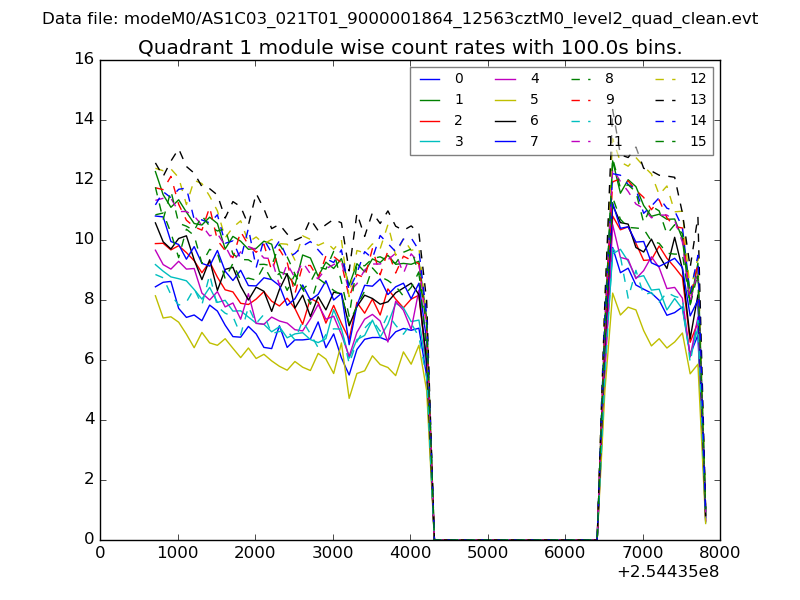
| Module-wise count rates for Quadrant A Data is divided into 100 sec bins |
 |
 |
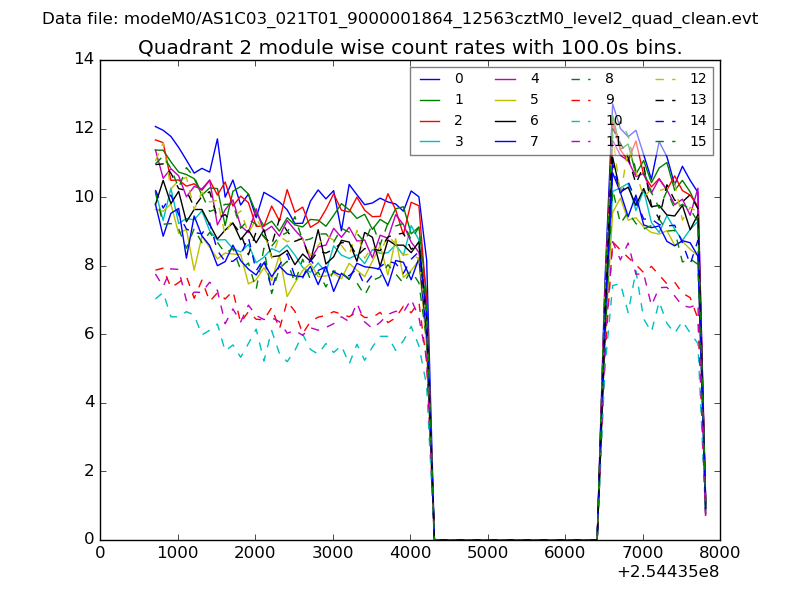
| Module-wise count rates for Quadrant B Data is divided into 100 sec bins |
 |
 |
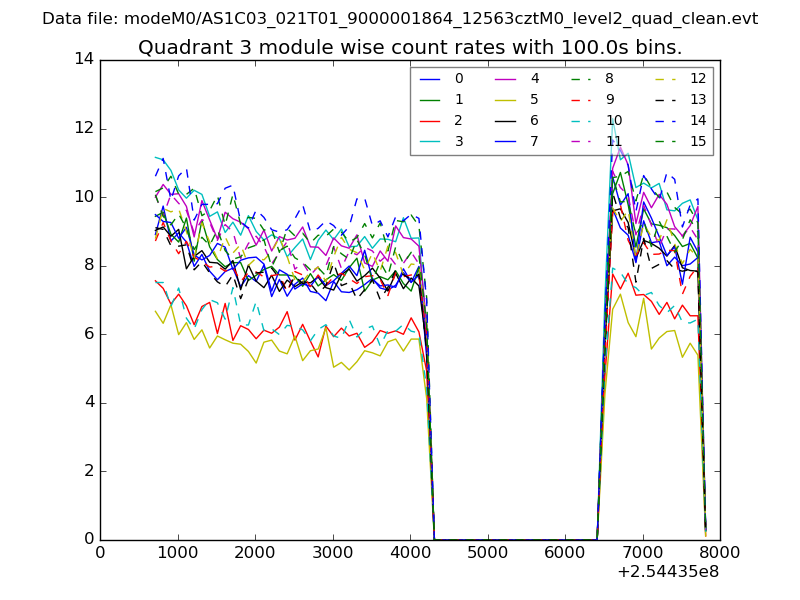
| Module-wise count rates for Quadrant C Data is divided into 100 sec bins |
 |
 |
| Module-wise count rates for Quadrant D Data is divided into 100 sec bins |
 |
 |
| Parameter | Plot |
|---|---|
| CZT HV Monitor | 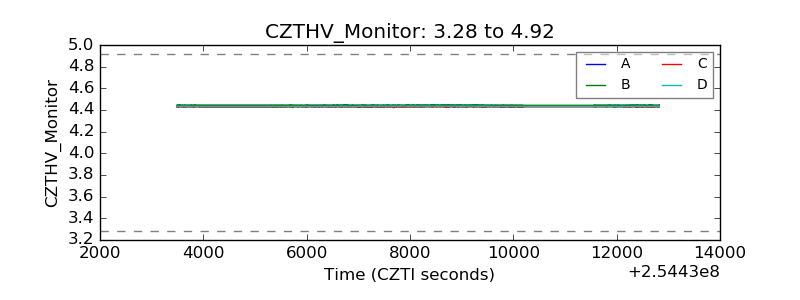 |
| D_VDD | 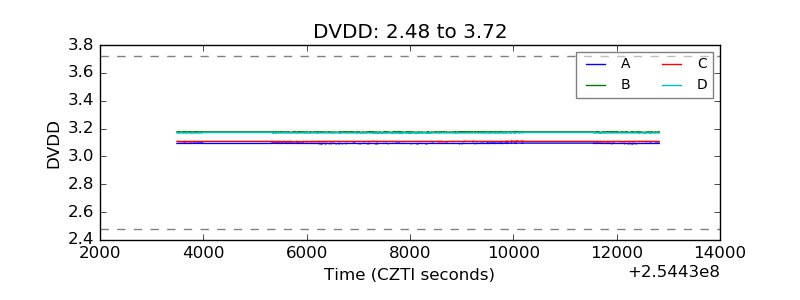 |
| Temperature 1 | 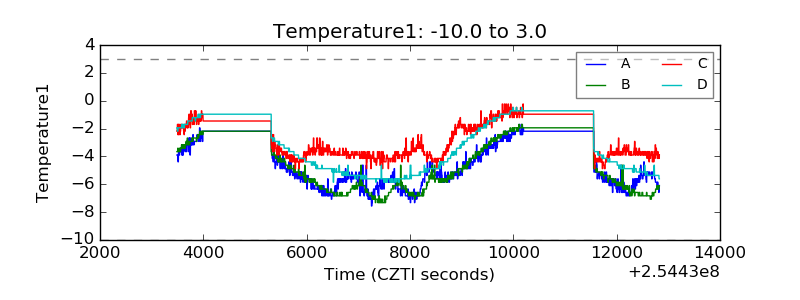 |
| Veto HV Monitor | 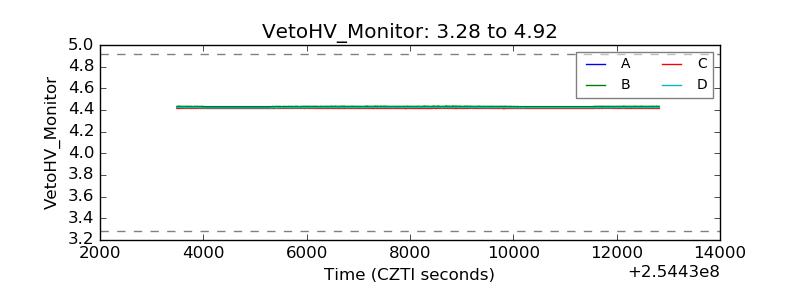 |
| Veto LLD | 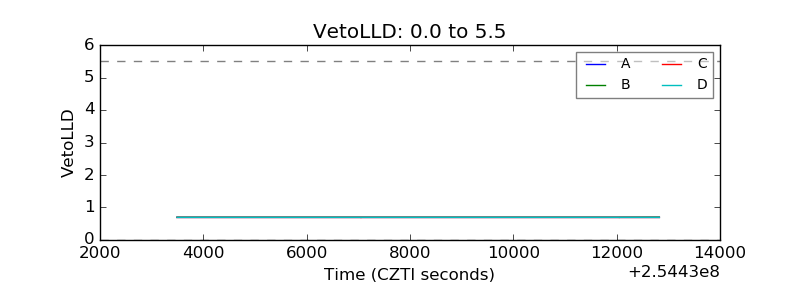 |
| Alpha Counter | 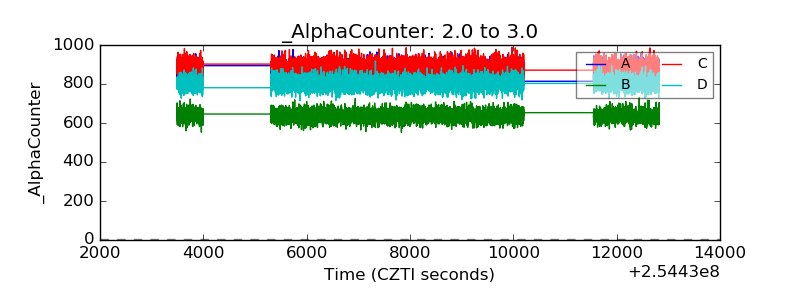 |
| _CPM_Rate | 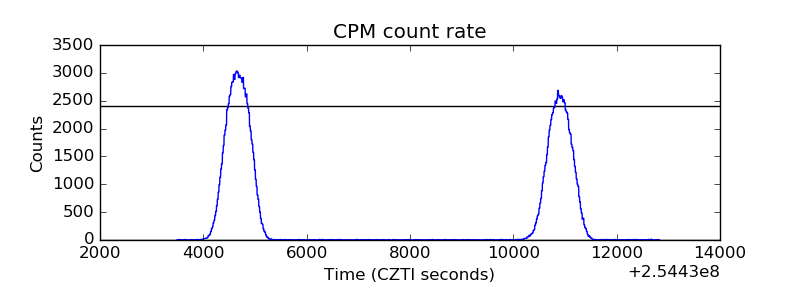 |
| CZT Counter | 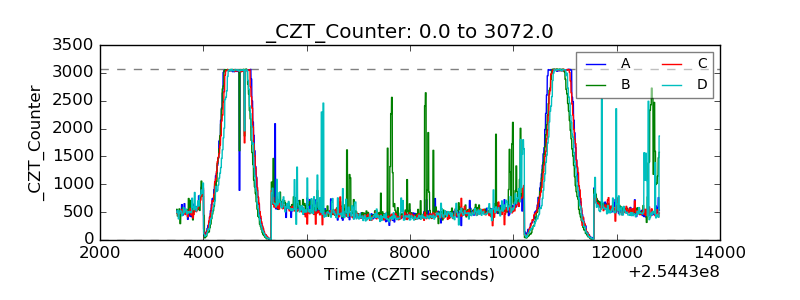 |
| +2.5 Volts monitor | 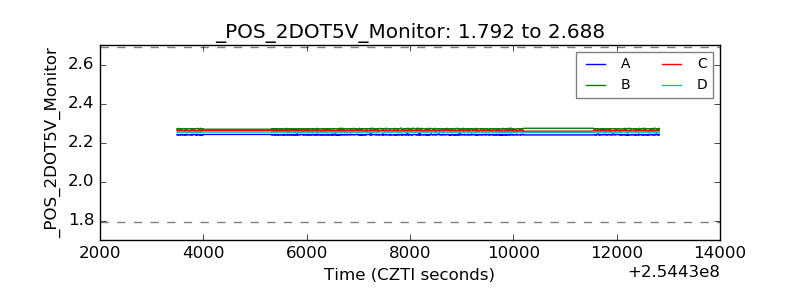 |
| +5 Volts monitor |  |
| _ROLL_ROT | 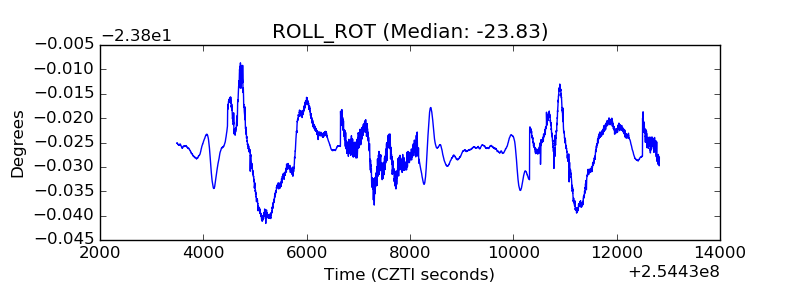 |
| _Roll_DEC |  |
| _Roll_RA | 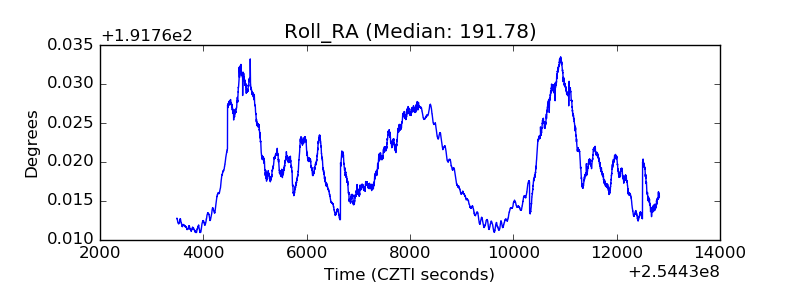 |
| Veto Counter | 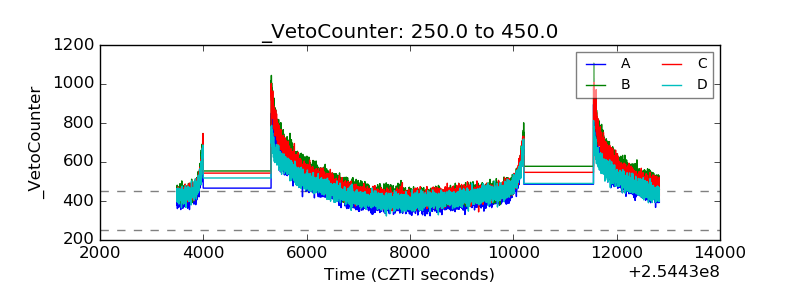 |