| Param | Original file | Final file |
|---|---|---|
| Filename | modeM0/AS1C03_021T01_9000001864_12565cztM0_level2.evt | modeM0/AS1C03_021T01_9000001864_12565cztM0_level2_quad_clean.evt |
| Size (bytes) | 463,775,040 | 97,292,160 |
| Size | 442.3 MB | 92.8 MB |
| Events in quadrant A | 3,211,084 | 626,791 |
| Events in quadrant B | 3,693,179 | 642,071 |
| Events in quadrant C | 3,121,034 | 625,882 |
| Events in quadrant D | 3,569,240 | 588,994 |
| Mode M9 | |||
|---|---|---|---|
| Quadrant | BADHDUFLAG | Total packets | Discarded packets |
| A | 0 | 16 | 0 |
| B | 0 | 16 | 0 |
| C | 0 | 16 | 0 |
| D | 0 | 17 | 0 |
| Mode M0 | |||
|---|---|---|---|
| Quadrant | BADHDUFLAG | Total packets | Discarded packets |
| A | 0 | 13974 | 3 |
| B | 0 | 15309 | 2 |
| C | 0 | 13734 | 2 |
| D | 0 | 15328 | 2 |
| Mode SS | |||
|---|---|---|---|
| Quadrant | BADHDUFLAG | Total packets | Discarded packets |
| A | 0 | 134 | 0 |
| B | 0 | 134 | 0 |
| C | 0 | 134 | 0 |
| D | 0 | 134 | 0 |
| Quadrant | Total seconds | Saturated seconds | Saturation percentage |
|---|---|---|---|
| A | 6640 | 41 | 0.617470% |
| B | 6640 | 135 | 2.033133% |
| C | 6640 | 27 | 0.406627% |
| D | 6640 | 111 | 1.671687% |
Noise dominated data is calculated using 1-second bins in cleaned event files. If a bin has >2000 counts, and if more than 50% of those come from <1% of pixels, then it is considered to be noise-dominated and hence unusable.
| Quadrant | # 1 sec bins | Bins with >0 counts | Bins with >2000 counts | High rate bins dominated by noise | Noise dominated (total time) | Noise dominated (detector-on time) | Marked lightcurve |
|---|---|---|---|---|---|---|---|
| A | 7816 | 6642 | 1 | 1 | 0.01% | 0.02% | 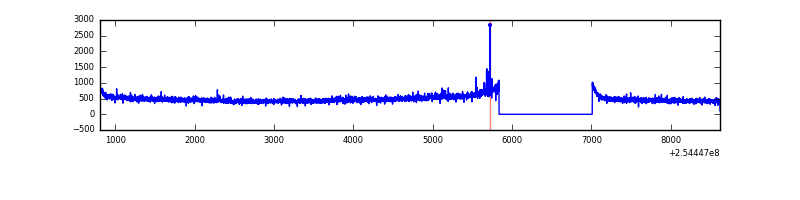 |
| B | 7816 | 6642 | 66 | 66 | 0.84% | 0.99% | 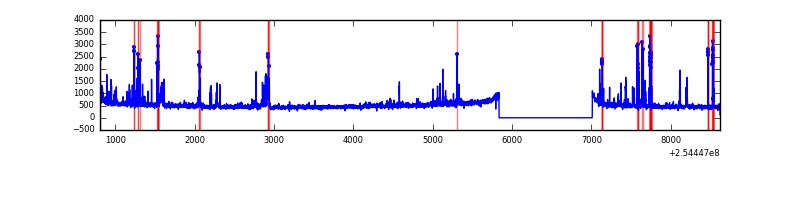 |
| C | 7816 | 6642 | 0 | 0 | 0.00% | 0.00% |  |
| D | 7816 | 6642 | 76 | 76 | 0.97% | 1.14% | 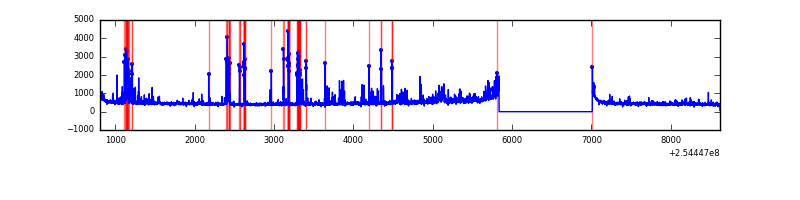 |
Top three noisy pixels from each quadrant. If the there are fewer than three noisy pixels in the level2.evt file, extra rows are filled as -1
| Pixel properties | Quadrant properties | ||||||
|---|---|---|---|---|---|---|---|
| Quadrant | DetID | PixID | Counts | Sigma | Mean | Median | Sigma |
| A | 12 | 189 | 30046 | 175.42 | 816 | 799 | 166.7 |
| A | 12 | 96 | 16894 | 96.54 | 816 | 799 | 166.7 |
| A | 1 | 162 | 8085 | 43.7 | 816 | 799 | 166.7 |
| B | 4 | 239 | 301185 | 1913.14 | 823 | 803 | 157.0 |
| B | 3 | 64 | 128117 | 810.87 | 823 | 803 | 157.0 |
| B | 11 | 51 | 40970 | 255.82 | 823 | 803 | 157.0 |
| C | 13 | 61 | 5810 | 26.94 | 800 | 807 | 185.7 |
| C | 0 | 15 | 2316 | 8.12 | 800 | 807 | 185.7 |
| C | 14 | 67 | 2223 | 7.62 | 800 | 807 | 185.7 |
| D | 1 | 52 | 260304 | 1385.45 | 782 | 761 | 187.3 |
| D | 7 | 223 | 172238 | 915.35 | 782 | 761 | 187.3 |
| D | 13 | 104 | 42431 | 222.44 | 782 | 761 | 187.3 |
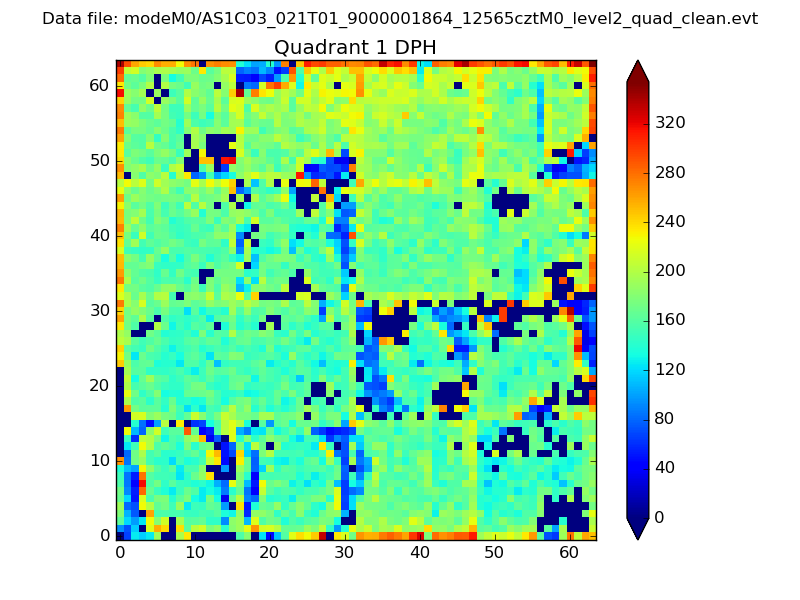
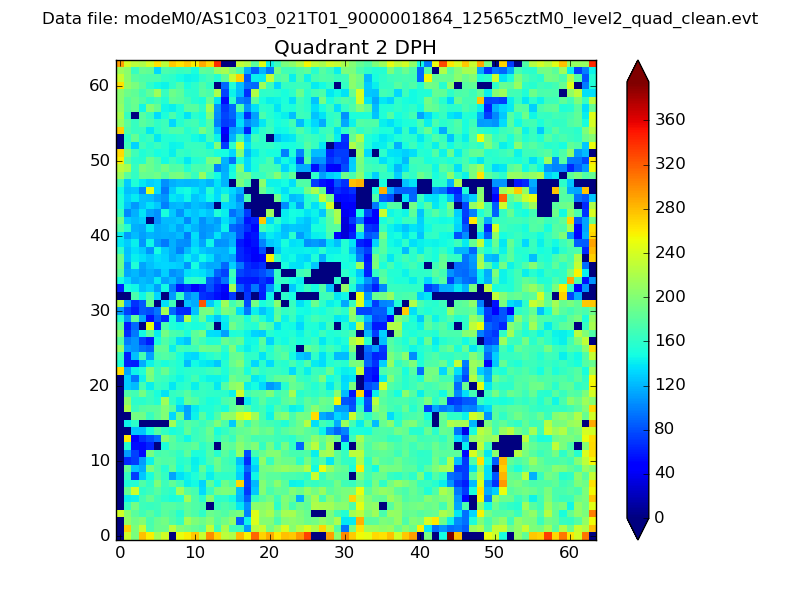
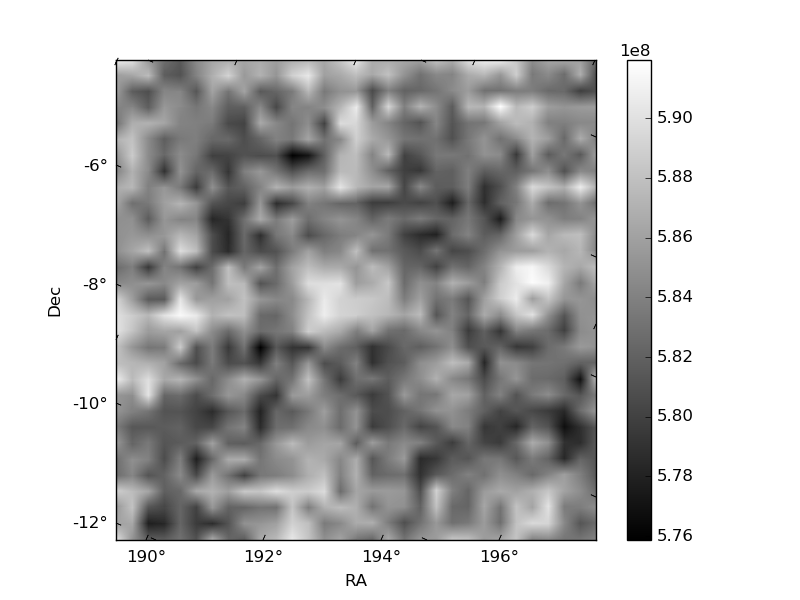
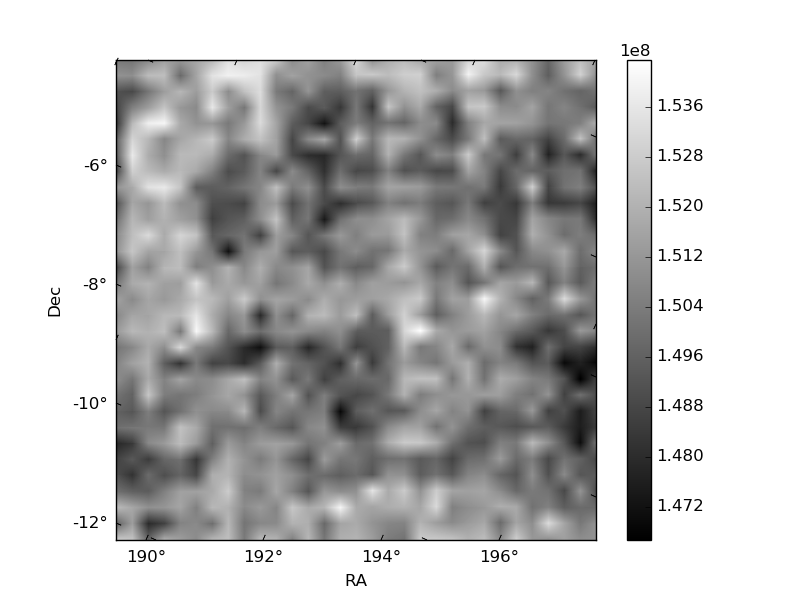
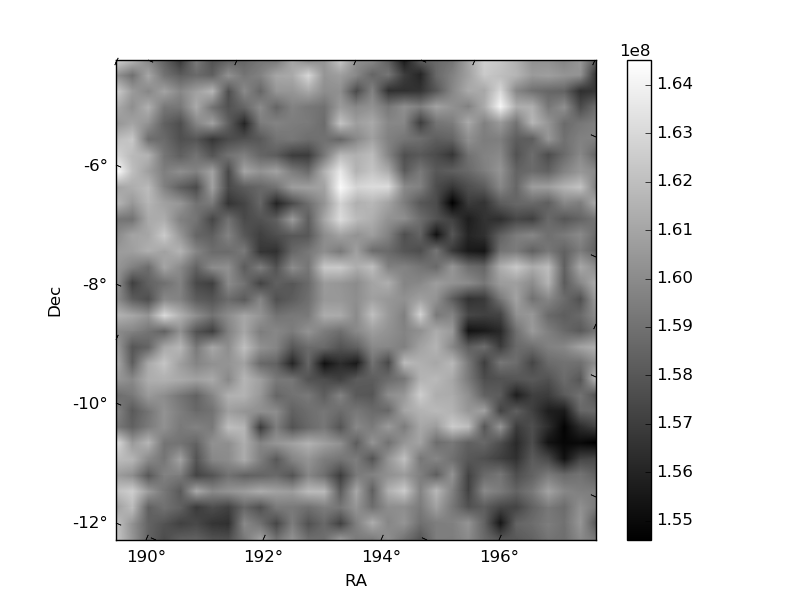
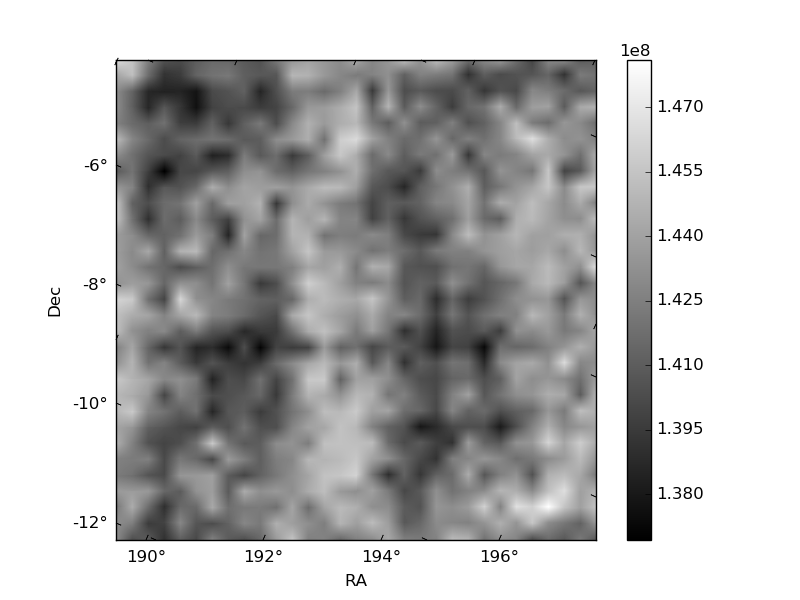
Histogram calculated using DETX and DETY for each event in the final _common_clean file
| Quadrant A | 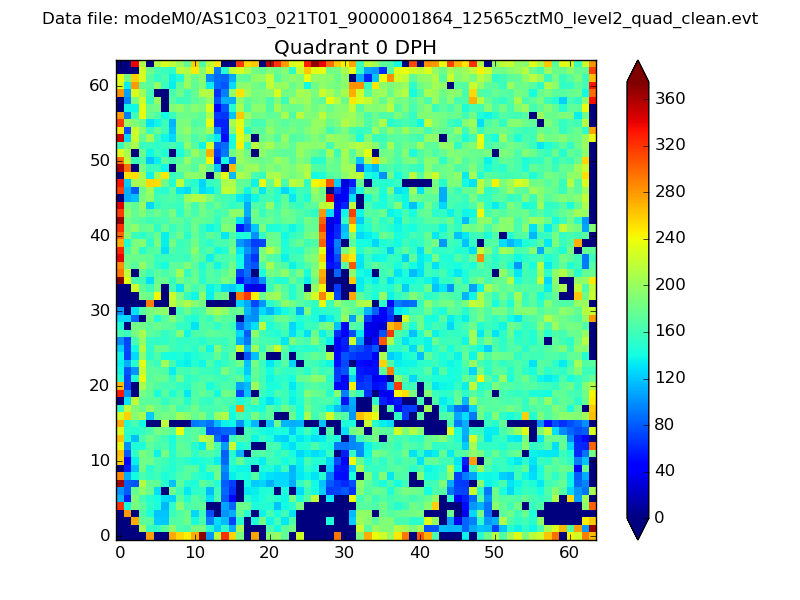 |
 |
Quadrant B |
|---|---|---|---|
| Quadrant D | 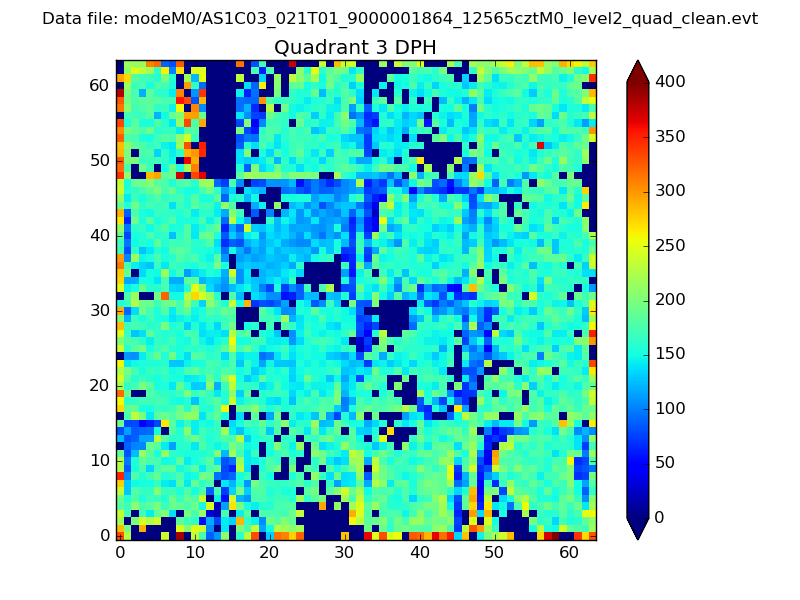 |
 |
Quadrant C |
| Plot type | Count rate plots | Images |
|---|---|---|
| Comparison with Poisson distribution Blue bars denote a histogram of data divided into 1 sec bins. Red curve is a Poisson curve with rate = median count rate of data. |
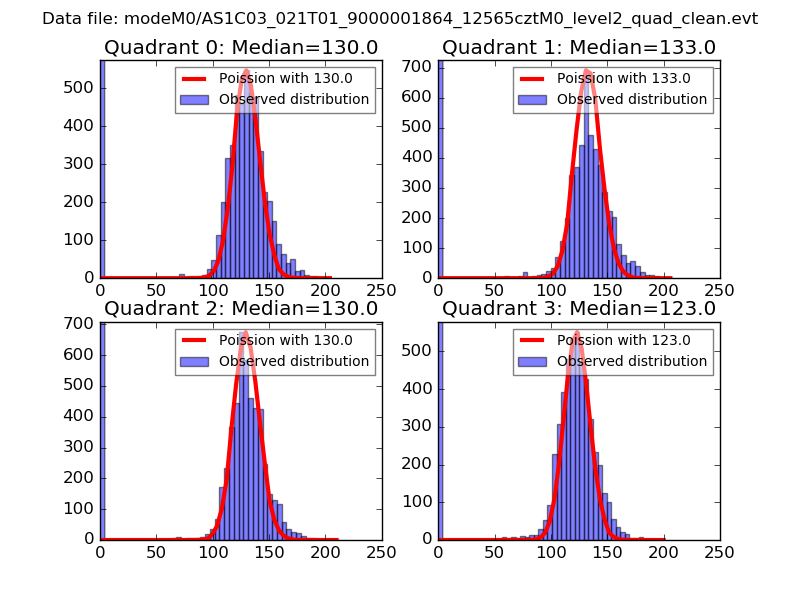 |
 |
| Quadrant-wise count rates Data is divided into 100 sec bins |
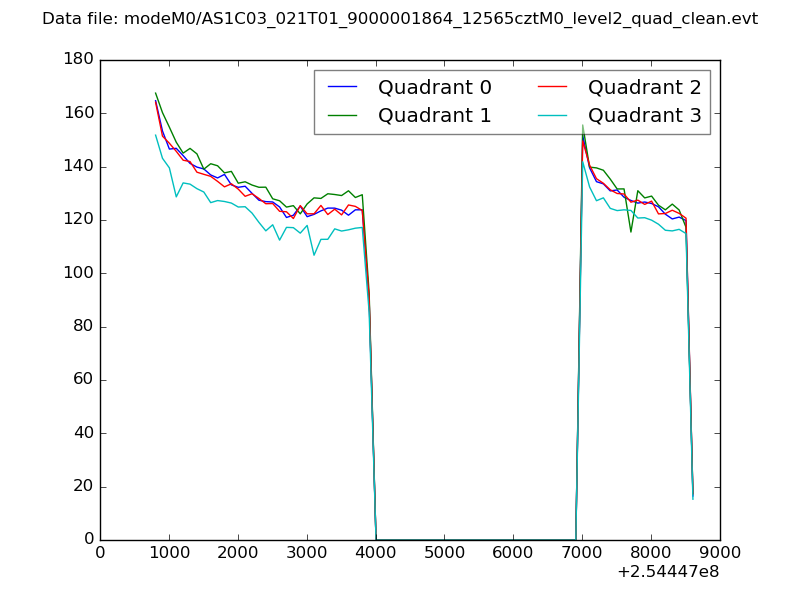 |
|
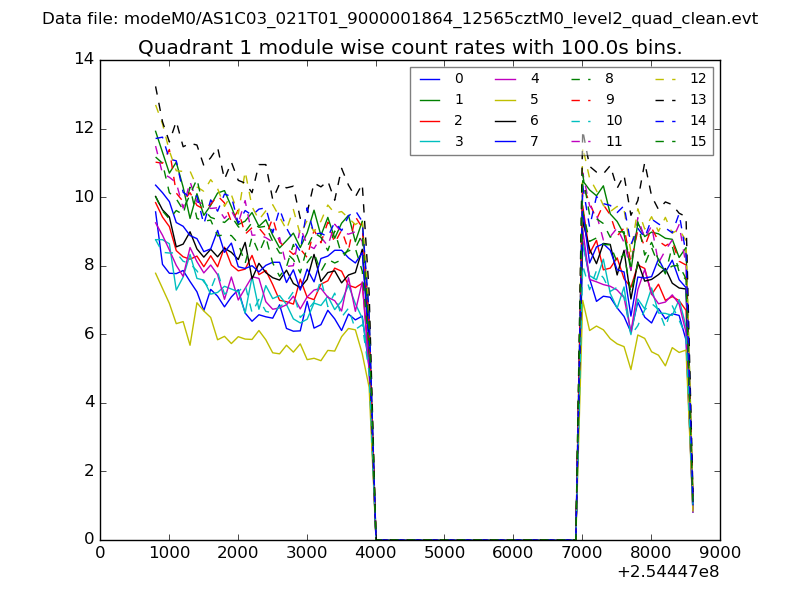
| Module-wise count rates for Quadrant A Data is divided into 100 sec bins |
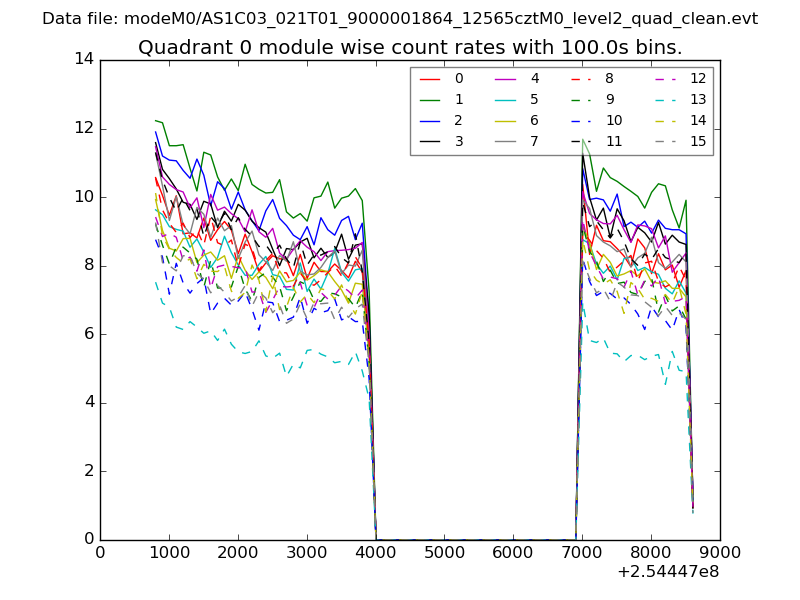 |
 |
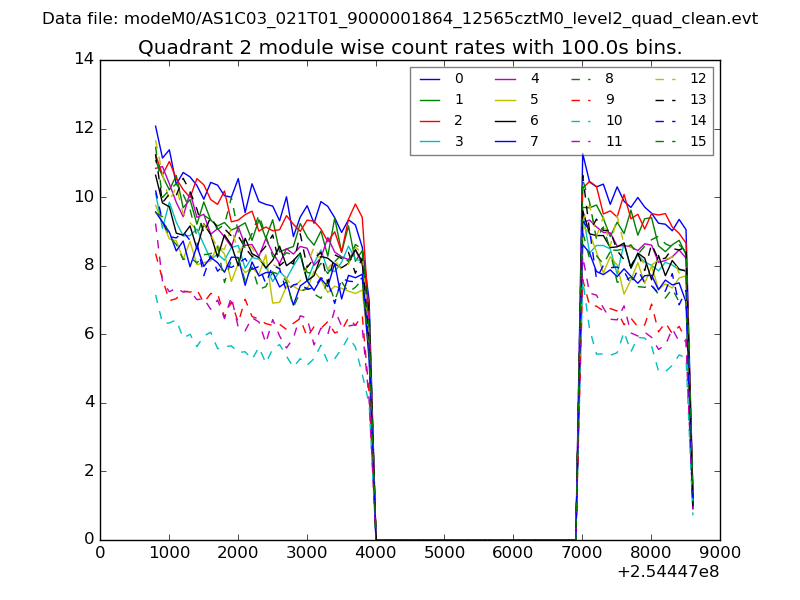
| Module-wise count rates for Quadrant B Data is divided into 100 sec bins |
 |
 |
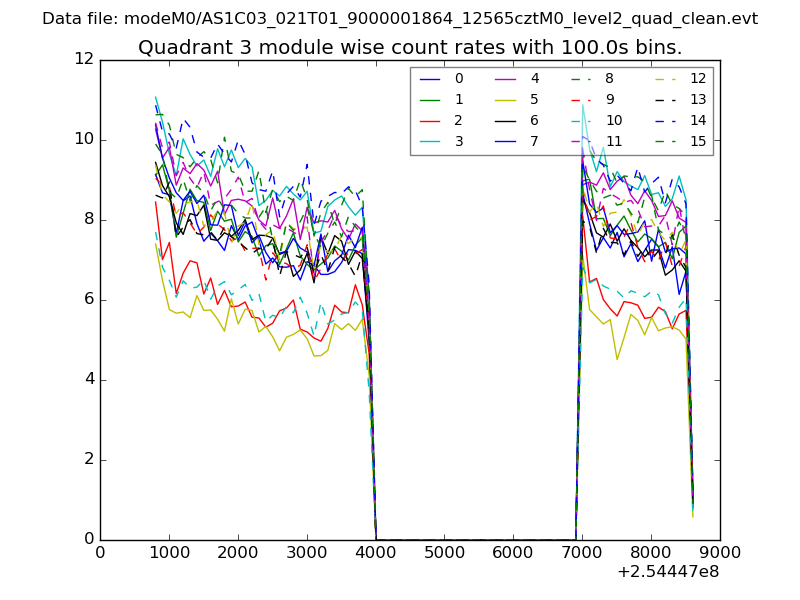
| Module-wise count rates for Quadrant C Data is divided into 100 sec bins |
 |
 |
| Module-wise count rates for Quadrant D Data is divided into 100 sec bins |
 |
 |
| Parameter | Plot |
|---|---|
| CZT HV Monitor |  |
| D_VDD | 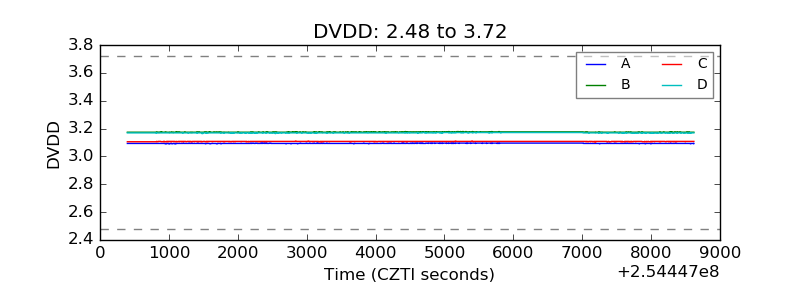 |
| Temperature 1 | 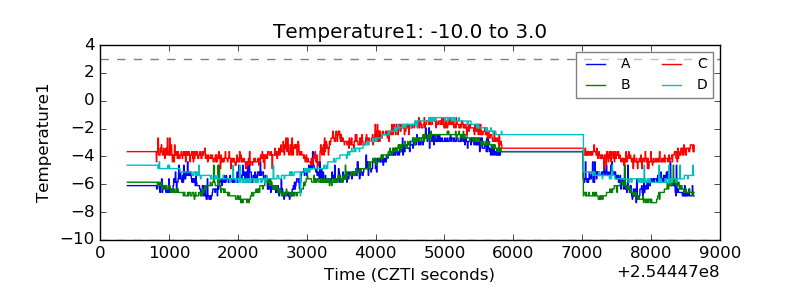 |
| Veto HV Monitor | 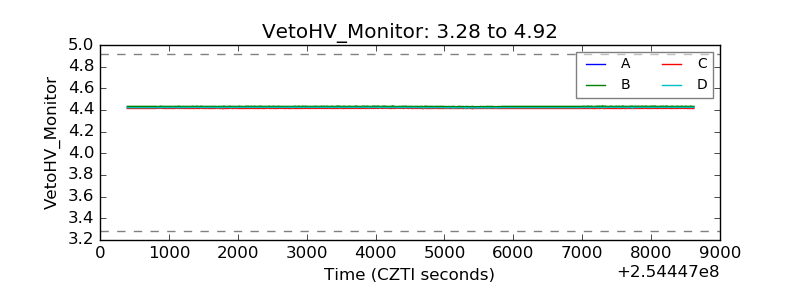 |
| Veto LLD | 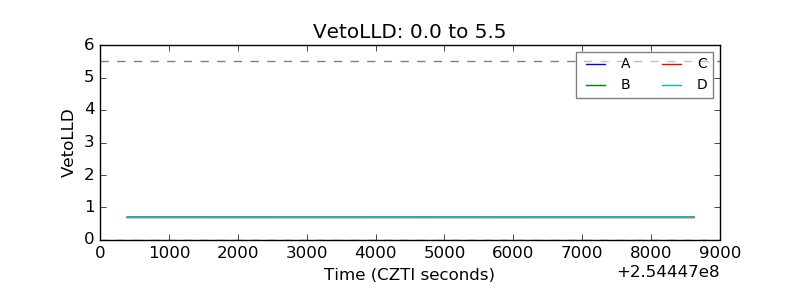 |
| Alpha Counter | 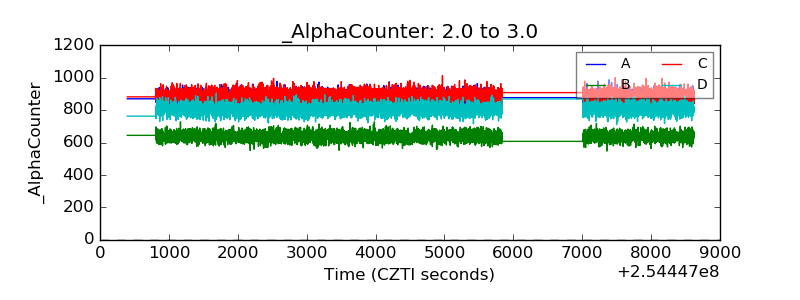 |
| _CPM_Rate | 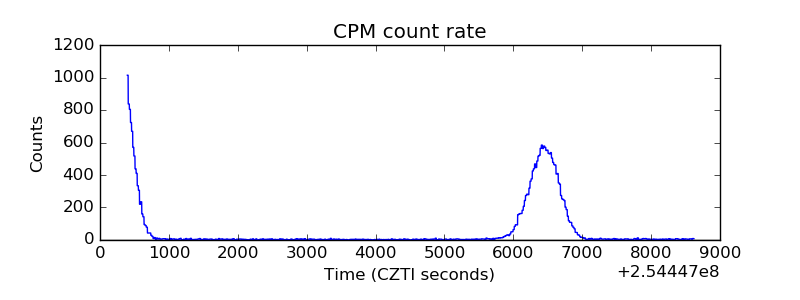 |
| CZT Counter | 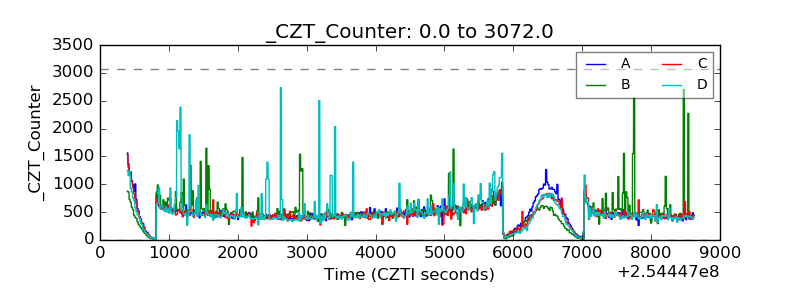 |
| +2.5 Volts monitor |  |
| +5 Volts monitor |  |
| _ROLL_ROT | 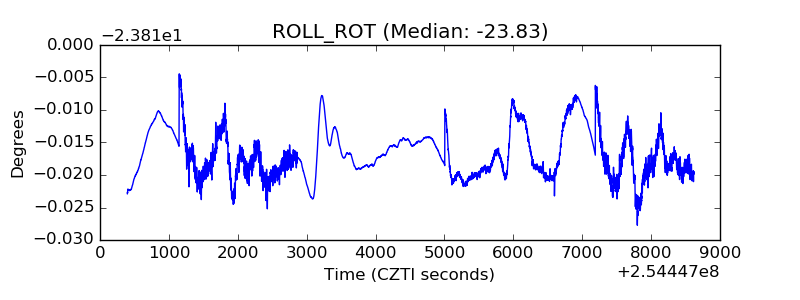 |
| _Roll_DEC | 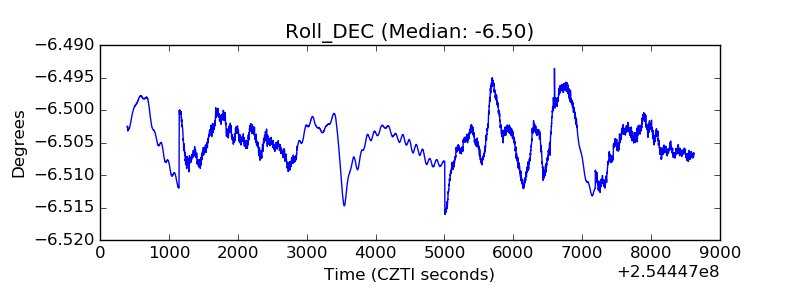 |
| _Roll_RA | 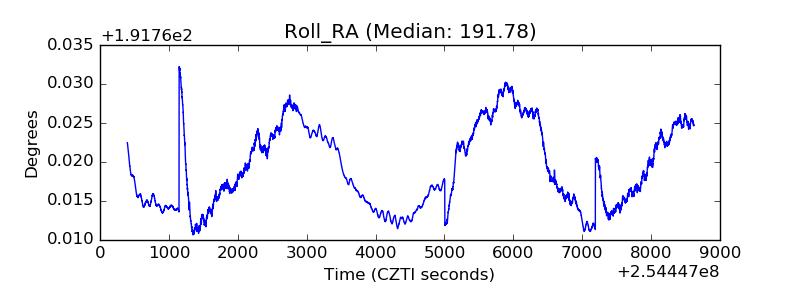 |
| Veto Counter | 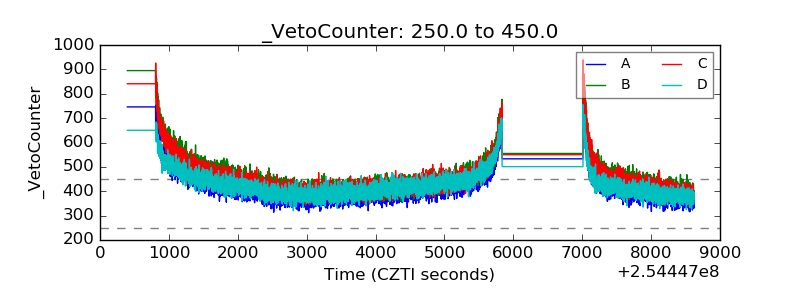 |