| Param | Original file | Final file |
|---|---|---|
| Filename | modeM0/AS1C03_021T01_9000001864_12566cztM0_level2.evt | modeM0/AS1C03_021T01_9000001864_12566cztM0_level2_quad_clean.evt |
| Size (bytes) | 500,040,000 | 95,112,000 |
| Size | 476.9 MB | 90.7 MB |
| Events in quadrant A | 3,585,132 | 593,847 |
| Events in quadrant B | 3,902,695 | 607,767 |
| Events in quadrant C | 3,451,142 | 598,430 |
| Events in quadrant D | 3,706,043 | 569,264 |
| Mode M9 | |||
|---|---|---|---|
| Quadrant | BADHDUFLAG | Total packets | Discarded packets |
| A | 0 | 20 | 0 |
| B | 0 | 20 | 0 |
| C | 0 | 20 | 0 |
| D | 0 | 20 | 0 |
| Mode M0 | |||
|---|---|---|---|
| Quadrant | BADHDUFLAG | Total packets | Discarded packets |
| A | 0 | 15675 | 3 |
| B | 0 | 16549 | 2 |
| C | 0 | 15302 | 2 |
| D | 0 | 16136 | 2 |
| Mode SS | |||
|---|---|---|---|
| Quadrant | BADHDUFLAG | Total packets | Discarded packets |
| A | 0 | 150 | 0 |
| B | 0 | 150 | 0 |
| C | 0 | 150 | 0 |
| D | 0 | 150 | 0 |
| Quadrant | Total seconds | Saturated seconds | Saturation percentage |
|---|---|---|---|
| A | 7343 | 103 | 1.402696% |
| B | 7343 | 198 | 2.696446% |
| C | 7343 | 49 | 0.667302% |
| D | 7343 | 85 | 1.157565% |
Noise dominated data is calculated using 1-second bins in cleaned event files. If a bin has >2000 counts, and if more than 50% of those come from <1% of pixels, then it is considered to be noise-dominated and hence unusable.
| Quadrant | # 1 sec bins | Bins with >0 counts | Bins with >2000 counts | High rate bins dominated by noise | Noise dominated (total time) | Noise dominated (detector-on time) | Marked lightcurve |
|---|---|---|---|---|---|---|---|
| A | 9344 | 7347 | 4 | 4 | 0.04% | 0.05% | 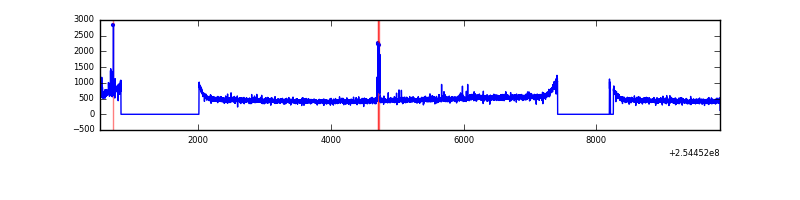 |
| B | 9344 | 7346 | 50 | 50 | 0.54% | 0.68% | 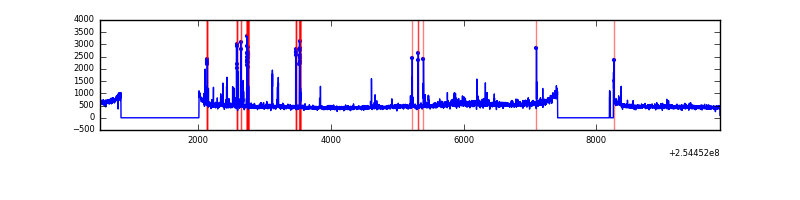 |
| C | 9344 | 7347 | 0 | 0 | 0.00% | 0.00% | 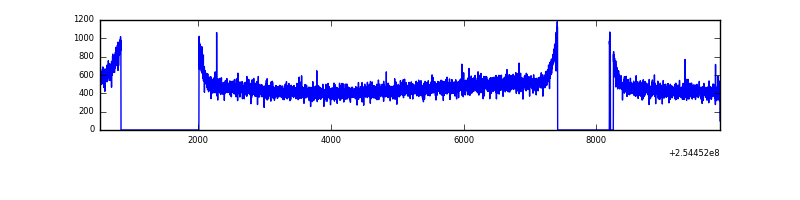 |
| D | 9344 | 7347 | 28 | 28 | 0.30% | 0.38% | 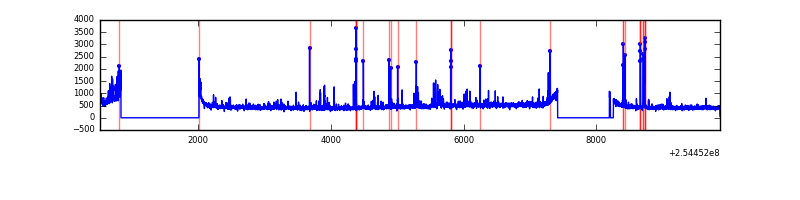 |
Top three noisy pixels from each quadrant. If the there are fewer than three noisy pixels in the level2.evt file, extra rows are filled as -1
| Pixel properties | Quadrant properties | ||||||
|---|---|---|---|---|---|---|---|
| Quadrant | DetID | PixID | Counts | Sigma | Mean | Median | Sigma |
| A | 9 | 143 | 36406 | 192.72 | 903 | 884 | 184.3 |
| A | 12 | 189 | 23555 | 123.0 | 903 | 884 | 184.3 |
| A | 12 | 96 | 18454 | 95.32 | 903 | 884 | 184.3 |
| B | 4 | 239 | 246165 | 1401.32 | 906 | 885 | 175.0 |
| B | 11 | 51 | 50540 | 283.69 | 906 | 885 | 175.0 |
| B | 3 | 209 | 45968 | 257.57 | 906 | 885 | 175.0 |
| C | 13 | 61 | 6328 | 26.33 | 883 | 888 | 206.6 |
| C | 0 | 15 | 3192 | 11.15 | 883 | 888 | 206.6 |
| C | 14 | 67 | 2657 | 8.56 | 883 | 888 | 206.6 |
| D | 1 | 52 | 180151 | 854.56 | 873 | 851 | 209.8 |
| D | 8 | 195 | 62836 | 295.43 | 873 | 851 | 209.8 |
| D | 7 | 223 | 55307 | 259.54 | 873 | 851 | 209.8 |
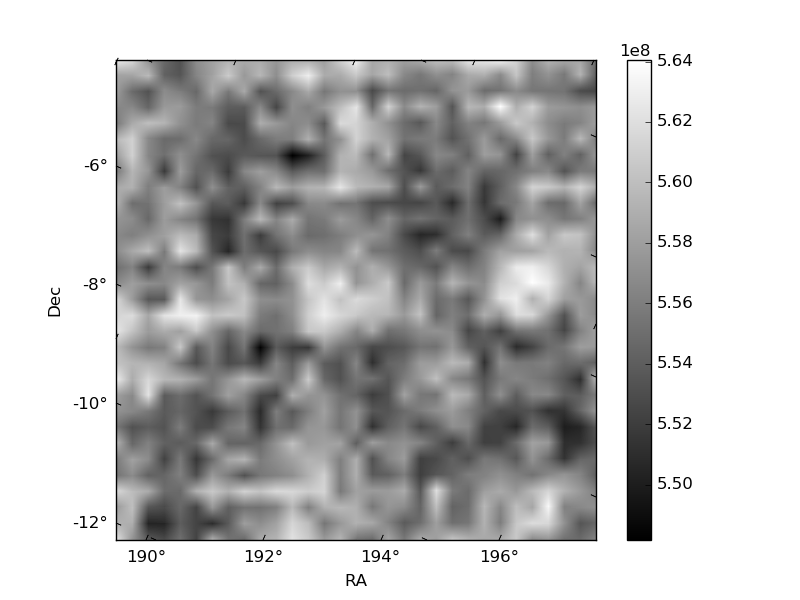
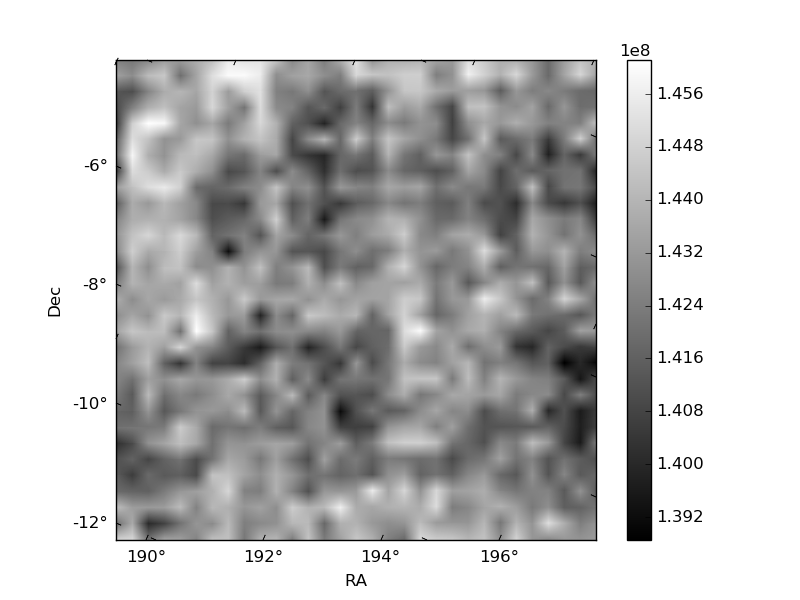
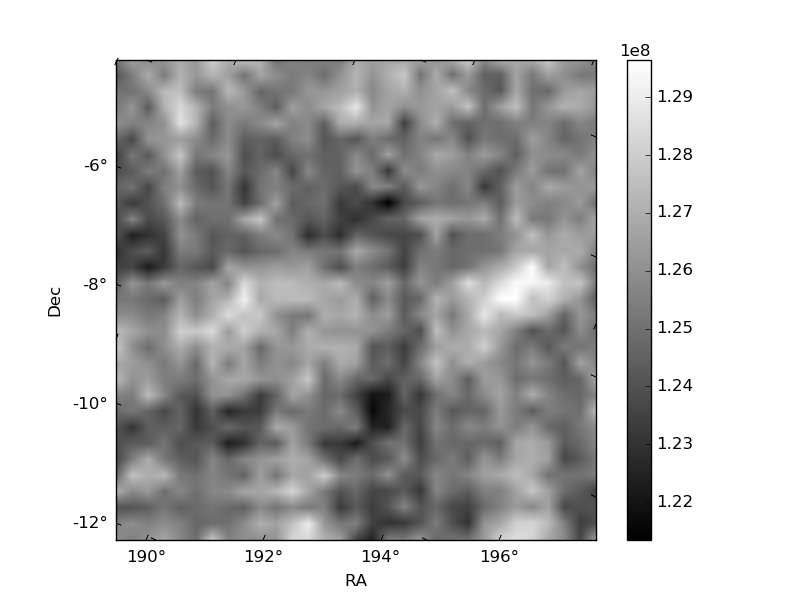
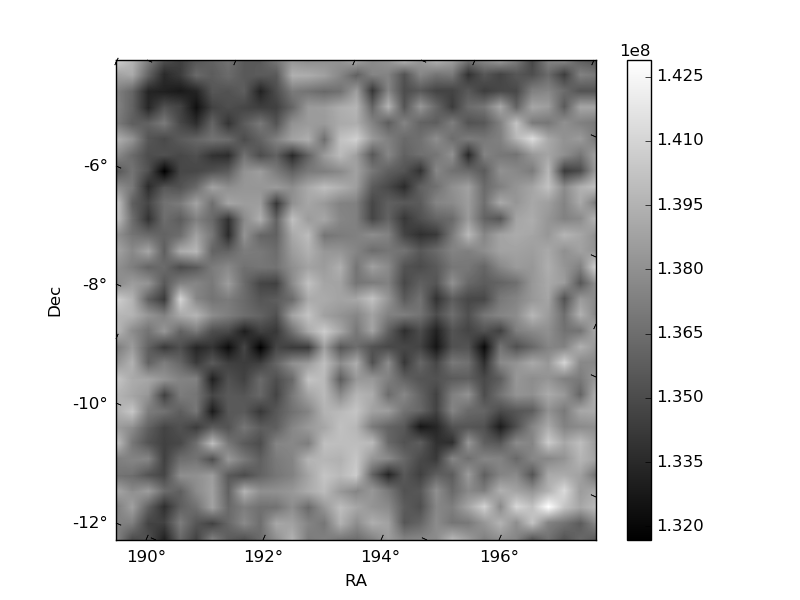
Histogram calculated using DETX and DETY for each event in the final _common_clean file
| Quadrant A | 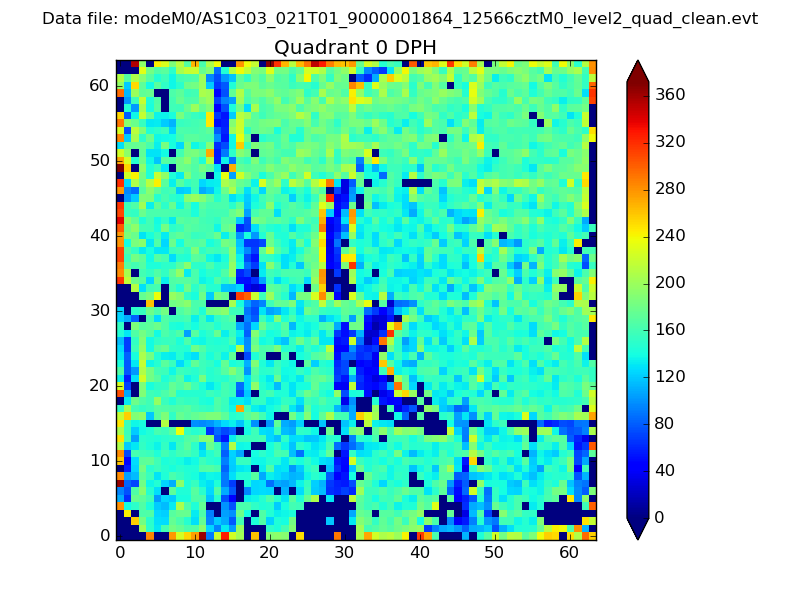 |
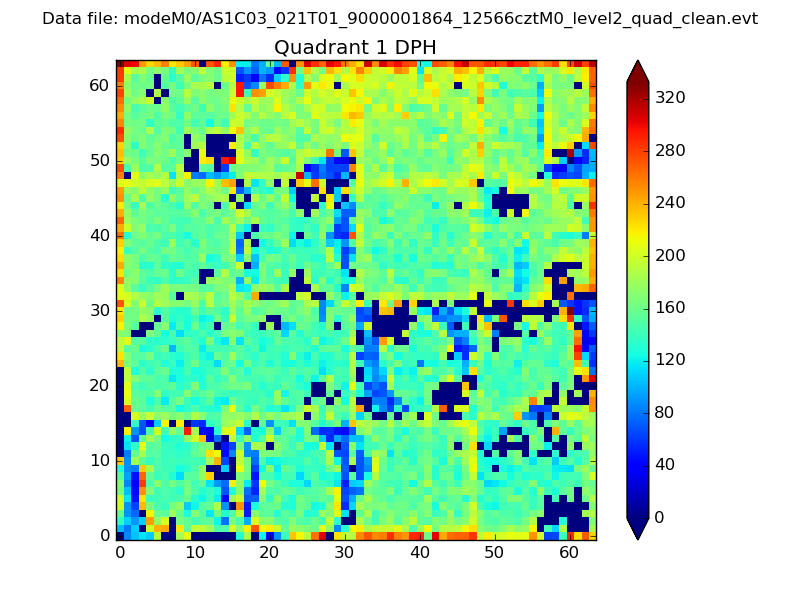 |
Quadrant B |
|---|---|---|---|
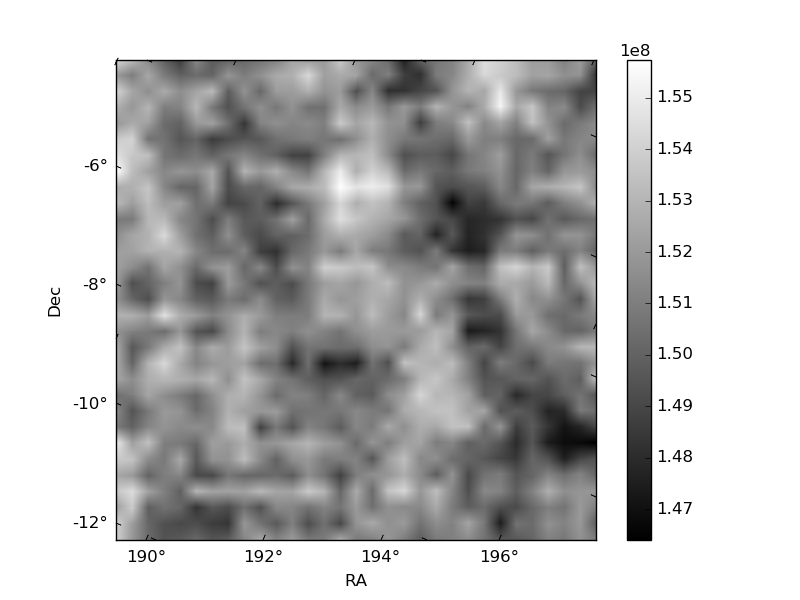
| Quadrant D | 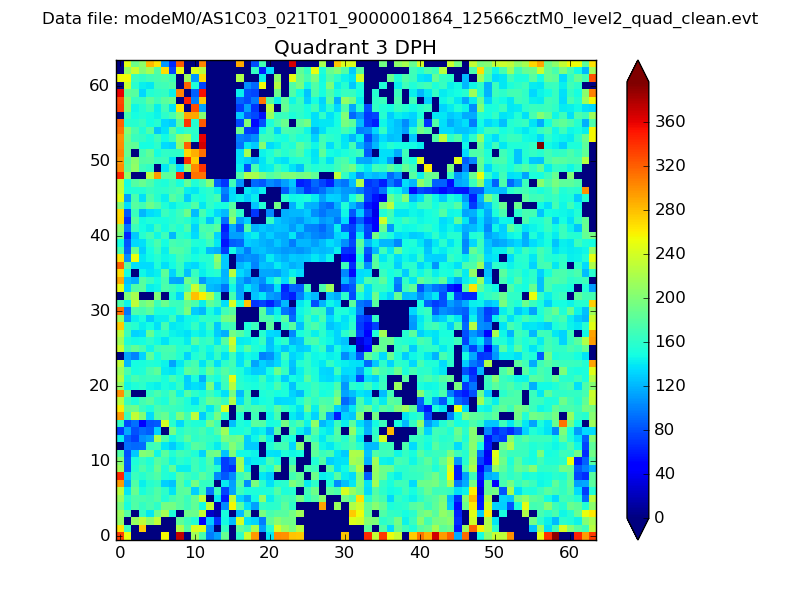 |
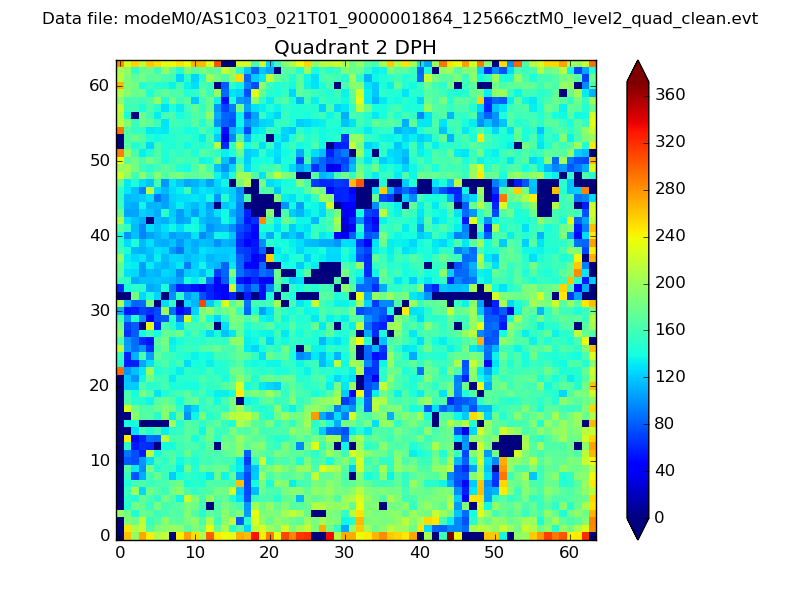 |
Quadrant C |
| Plot type | Count rate plots | Images |
|---|---|---|
| Comparison with Poisson distribution Blue bars denote a histogram of data divided into 1 sec bins. Red curve is a Poisson curve with rate = median count rate of data. |
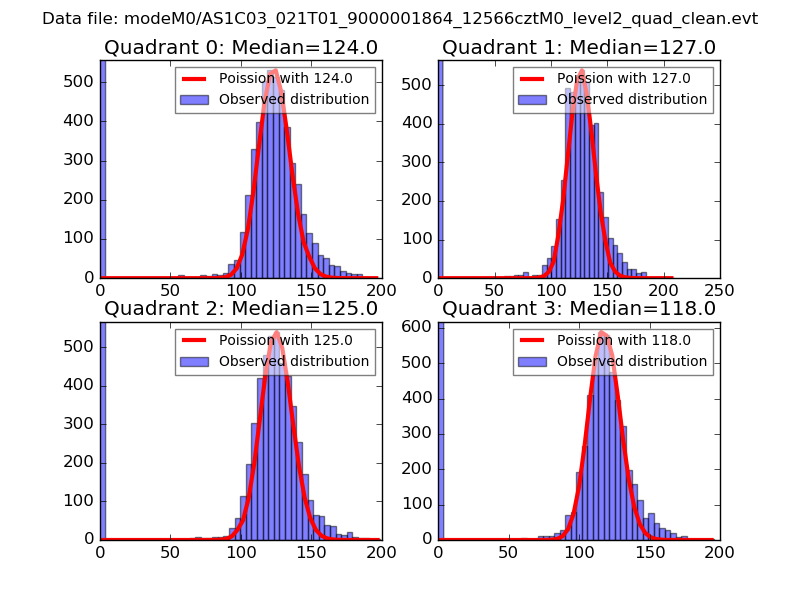 |
 |
| Quadrant-wise count rates Data is divided into 100 sec bins |
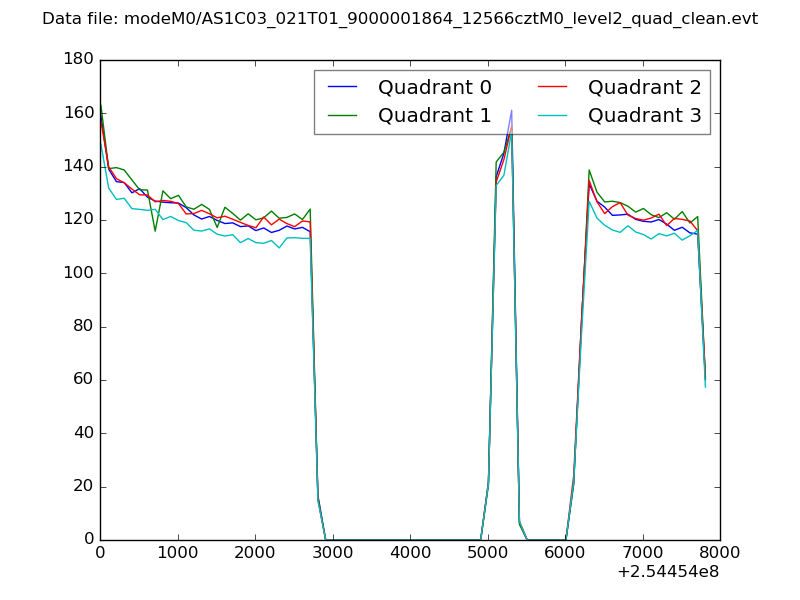 |
|
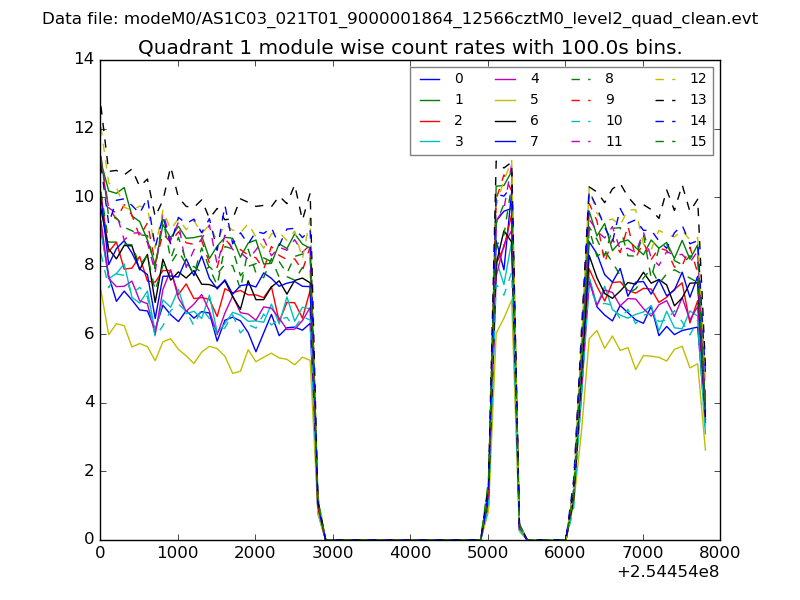
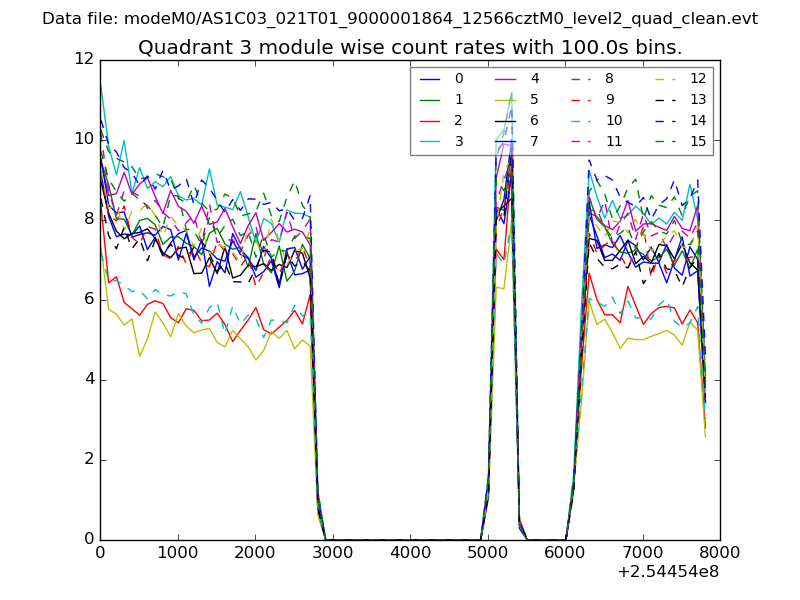
| Module-wise count rates for Quadrant A Data is divided into 100 sec bins |
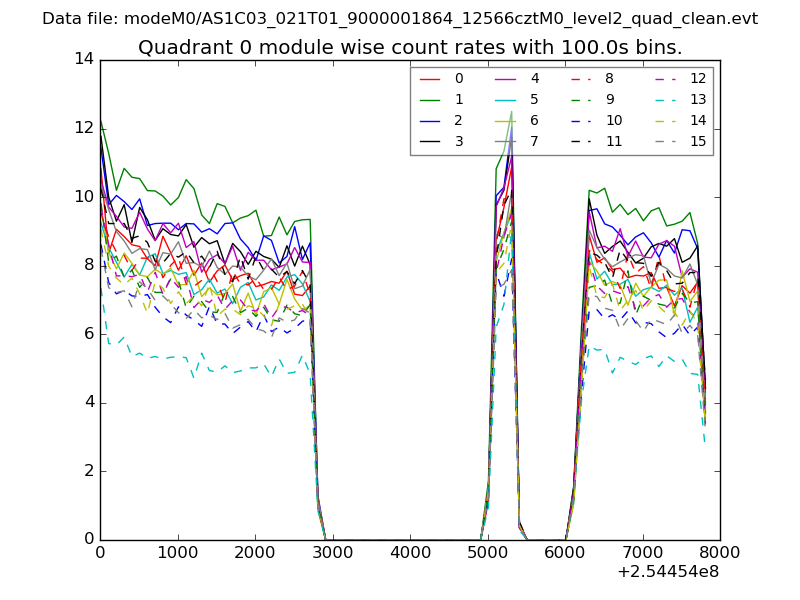 |
 |
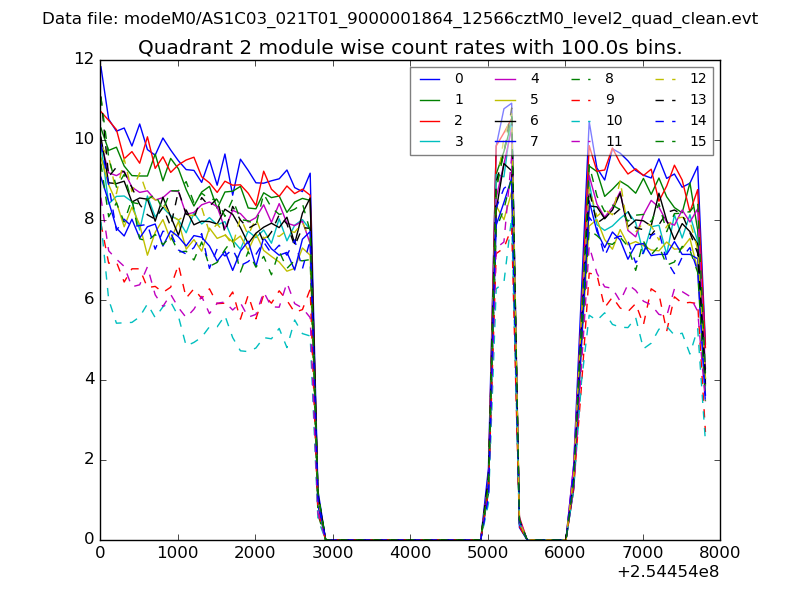
| Module-wise count rates for Quadrant B Data is divided into 100 sec bins |
 |
 |
| Module-wise count rates for Quadrant C Data is divided into 100 sec bins |
 |
 |
| Module-wise count rates for Quadrant D Data is divided into 100 sec bins |
 |
 |
| Parameter | Plot |
|---|---|
| CZT HV Monitor | 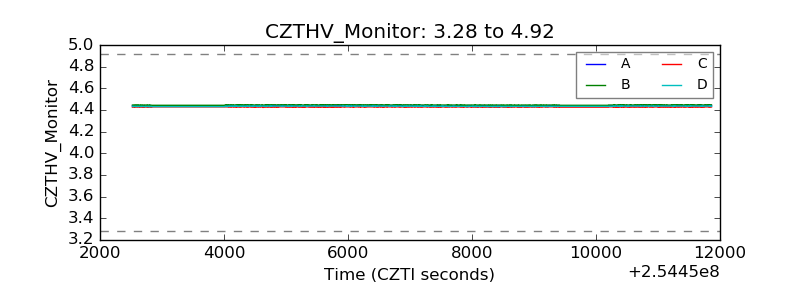 |
| D_VDD | 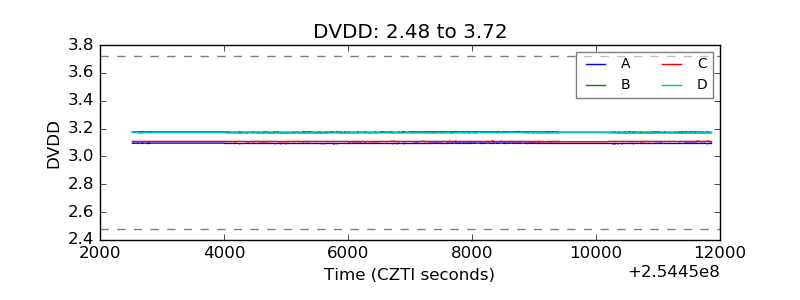 |
| Temperature 1 | 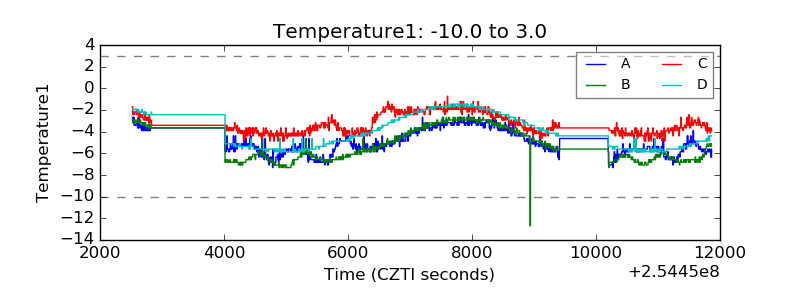 |
| Veto HV Monitor | 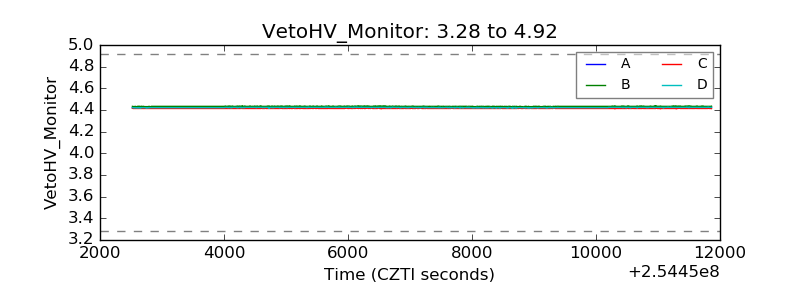 |
| Veto LLD | 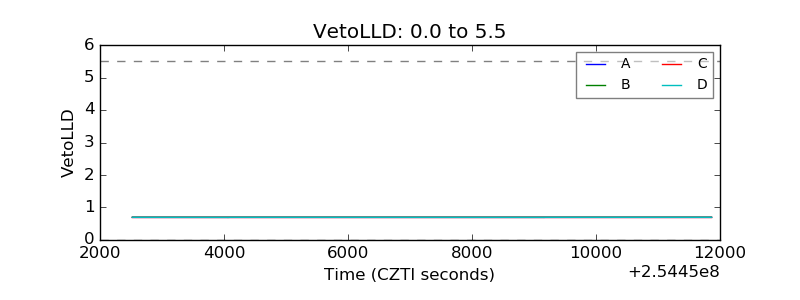 |
| Alpha Counter | 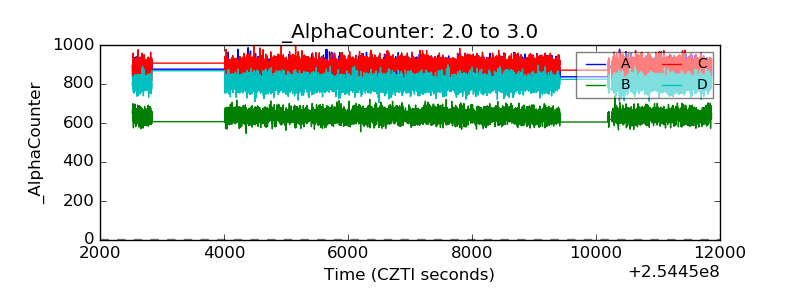 |
| _CPM_Rate | 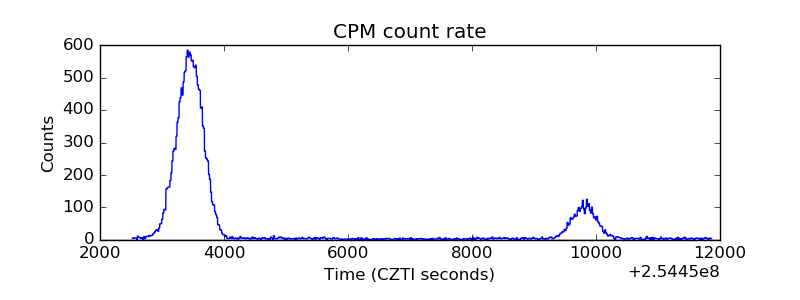 |
| CZT Counter | 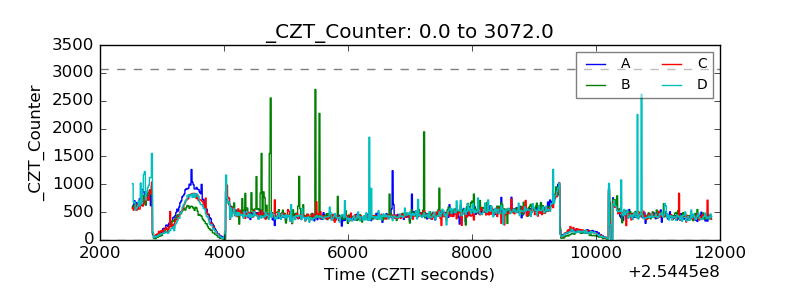 |
| +2.5 Volts monitor |  |
| +5 Volts monitor | 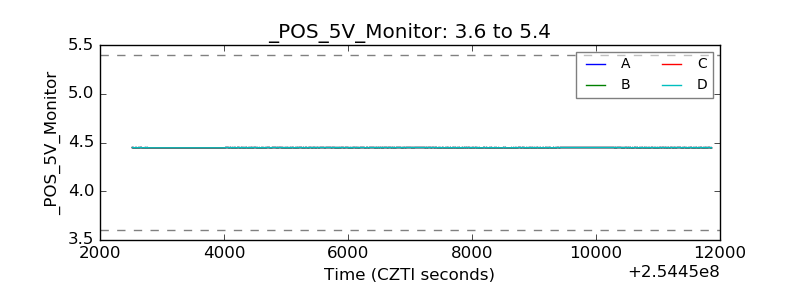 |
| _ROLL_ROT | 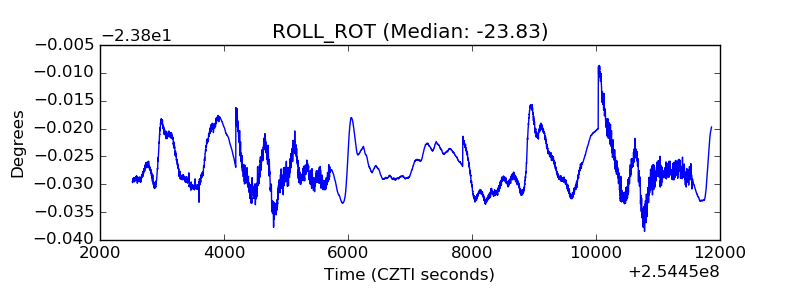 |
| _Roll_DEC | 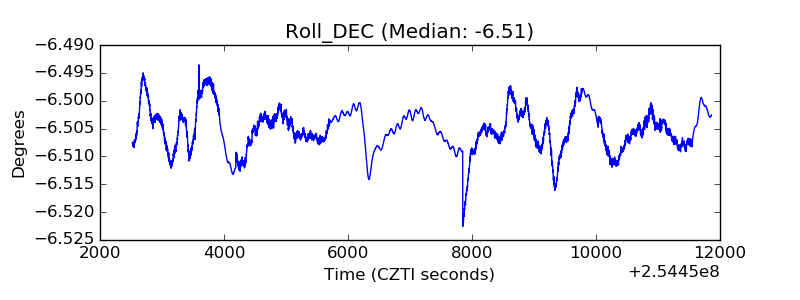 |
| _Roll_RA | 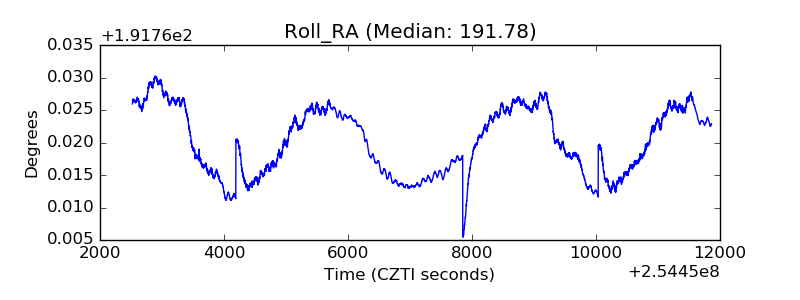 |
| Veto Counter | 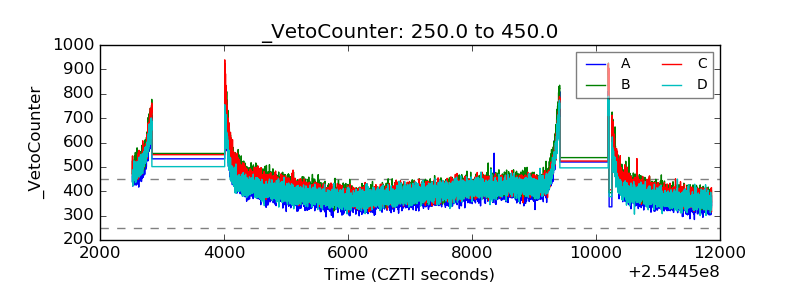 |