| Param | Original file | Final file |
|---|---|---|
| Filename | modeM0/AS1C03_021T01_9000001864_12567cztM0_level2.evt | modeM0/AS1C03_021T01_9000001864_12567cztM0_level2_quad_clean.evt |
| Size (bytes) | 496,339,200 | 102,942,720 |
| Size | 473.3 MB | 98.2 MB |
| Events in quadrant A | 3,583,024 | 647,258 |
| Events in quadrant B | 3,692,503 | 665,977 |
| Events in quadrant C | 3,477,980 | 653,733 |
| Events in quadrant D | 3,763,142 | 623,382 |
| Mode M9 | |||
|---|---|---|---|
| Quadrant | BADHDUFLAG | Total packets | Discarded packets |
| A | 0 | 12 | 0 |
| B | 0 | 12 | 0 |
| C | 0 | 12 | 0 |
| D | 0 | 12 | 0 |
| Mode M0 | |||
|---|---|---|---|
| Quadrant | BADHDUFLAG | Total packets | Discarded packets |
| A | 0 | 15711 | 3 |
| B | 0 | 15894 | 2 |
| C | 0 | 15612 | 2 |
| D | 0 | 16433 | 2 |
| Mode SS | |||
|---|---|---|---|
| Quadrant | BADHDUFLAG | Total packets | Discarded packets |
| A | 0 | 156 | 0 |
| B | 0 | 156 | 0 |
| C | 0 | 156 | 0 |
| D | 0 | 156 | 0 |
| Quadrant | Total seconds | Saturated seconds | Saturation percentage |
|---|---|---|---|
| A | 7579 | 94 | 1.240269% |
| B | 7579 | 118 | 1.556934% |
| C | 7579 | 51 | 0.672912% |
| D | 7579 | 93 | 1.227075% |
Noise dominated data is calculated using 1-second bins in cleaned event files. If a bin has >2000 counts, and if more than 50% of those come from <1% of pixels, then it is considered to be noise-dominated and hence unusable.
| Quadrant | # 1 sec bins | Bins with >0 counts | Bins with >2000 counts | High rate bins dominated by noise | Noise dominated (total time) | Noise dominated (detector-on time) | Marked lightcurve |
|---|---|---|---|---|---|---|---|
| A | 8820 | 7584 | 0 | 0 | 0.00% | 0.00% | 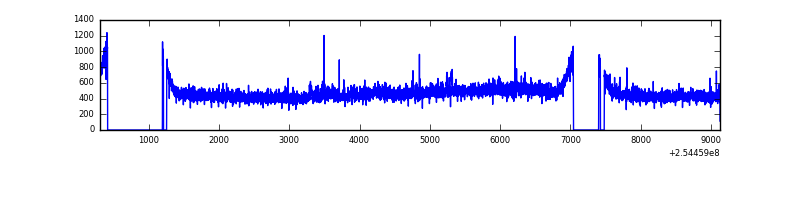 |
| B | 8820 | 7583 | 2 | 2 | 0.02% | 0.03% | 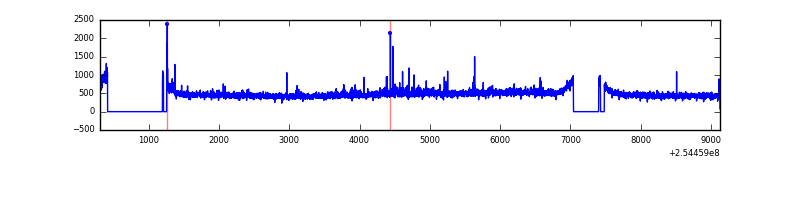 |
| C | 8820 | 7584 | 0 | 0 | 0.00% | 0.00% | 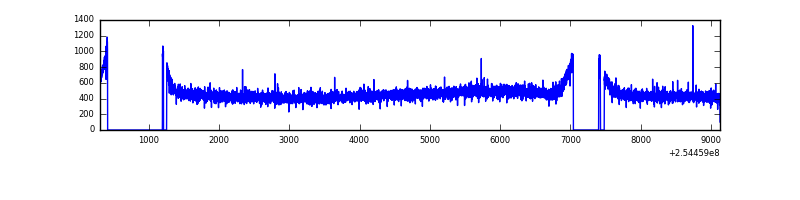 |
| D | 8820 | 7584 | 46 | 46 | 0.52% | 0.61% | 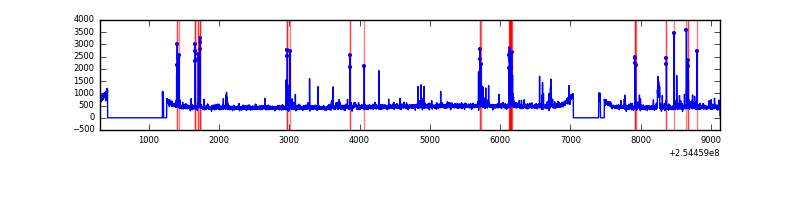 |
Top three noisy pixels from each quadrant. If the there are fewer than three noisy pixels in the level2.evt file, extra rows are filled as -1
| Pixel properties | Quadrant properties | ||||||
|---|---|---|---|---|---|---|---|
| Quadrant | DetID | PixID | Counts | Sigma | Mean | Median | Sigma |
| A | 12 | 189 | 44814 | 234.22 | 911 | 891 | 187.5 |
| A | 1 | 162 | 14074 | 70.3 | 911 | 891 | 187.5 |
| A | 1 | 178 | 8499 | 40.57 | 911 | 891 | 187.5 |
| B | 11 | 51 | 73117 | 405.05 | 912 | 888 | 178.3 |
| B | 0 | 214 | 26835 | 145.51 | 912 | 888 | 178.3 |
| B | 12 | 111 | 20801 | 111.67 | 912 | 888 | 178.3 |
| C | 13 | 61 | 6536 | 27.03 | 890 | 896 | 208.6 |
| C | 14 | 234 | 3088 | 10.51 | 890 | 896 | 208.6 |
| C | 0 | 15 | 3013 | 10.15 | 890 | 896 | 208.6 |
| D | 1 | 52 | 194229 | 904.37 | 879 | 854 | 213.8 |
| D | 13 | 249 | 94702 | 438.91 | 879 | 854 | 213.8 |
| D | 8 | 195 | 43996 | 201.77 | 879 | 854 | 213.8 |
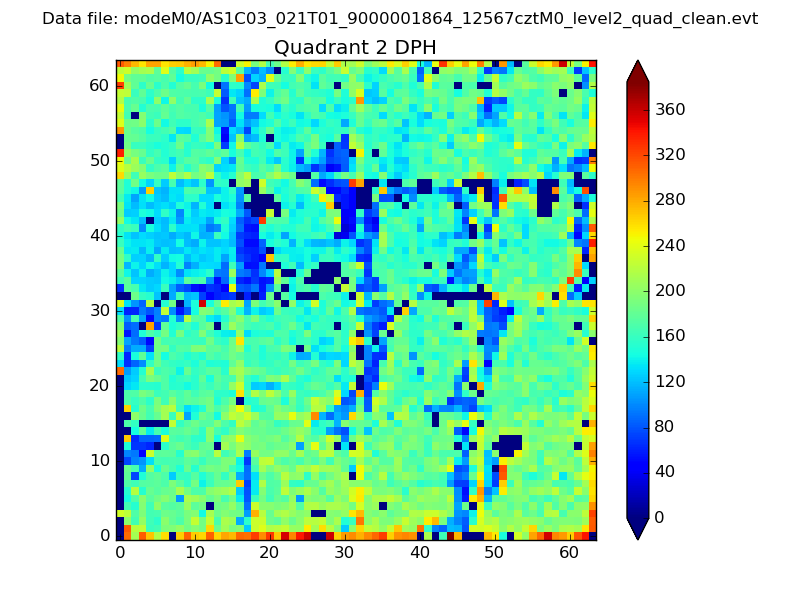
Histogram calculated using DETX and DETY for each event in the final _common_clean file
| Quadrant A | 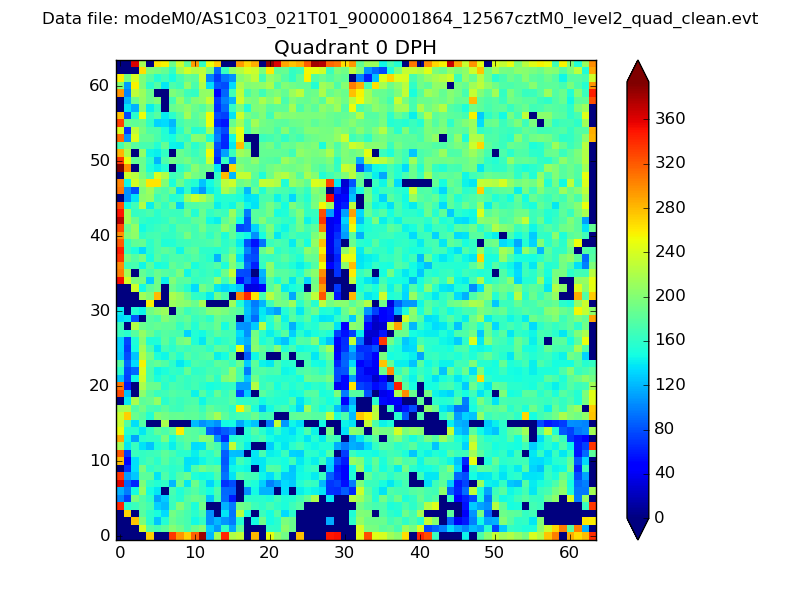 |
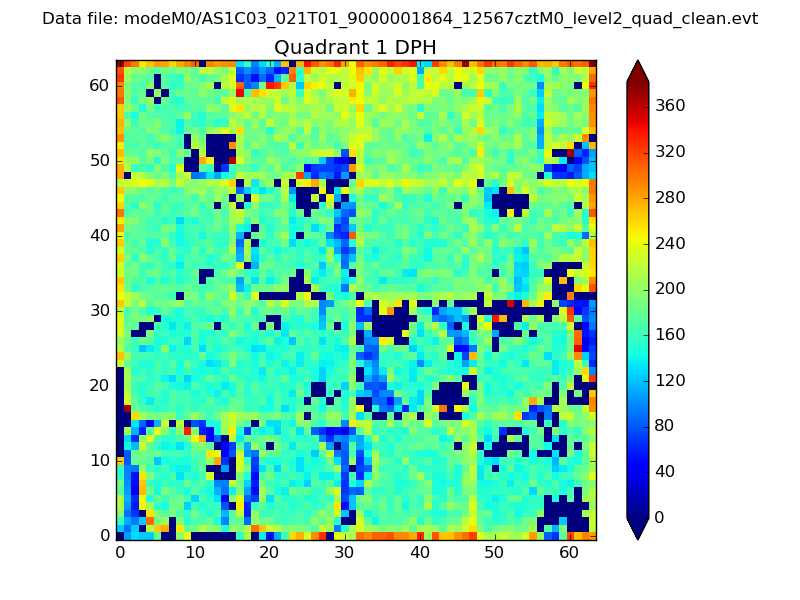 |
Quadrant B |
|---|---|---|---|
| Quadrant D | 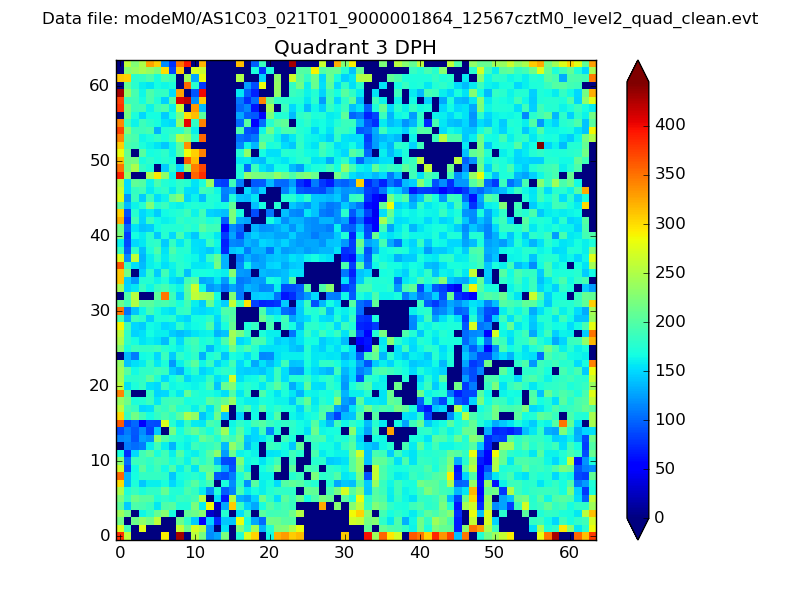 |
 |
Quadrant C |
| Plot type | Count rate plots | Images |
|---|---|---|
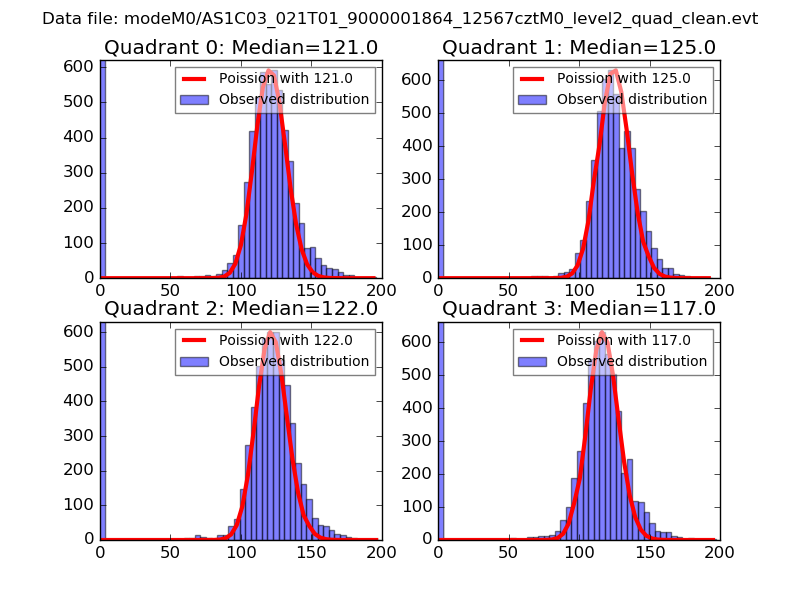
| Comparison with Poisson distribution Blue bars denote a histogram of data divided into 1 sec bins. Red curve is a Poisson curve with rate = median count rate of data. |
 |
 |
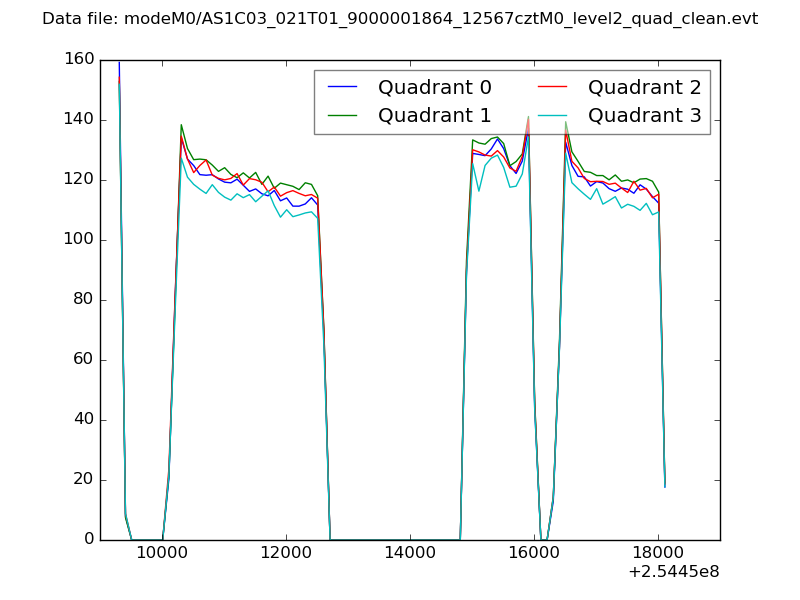
| Quadrant-wise count rates Data is divided into 100 sec bins |
 |
|
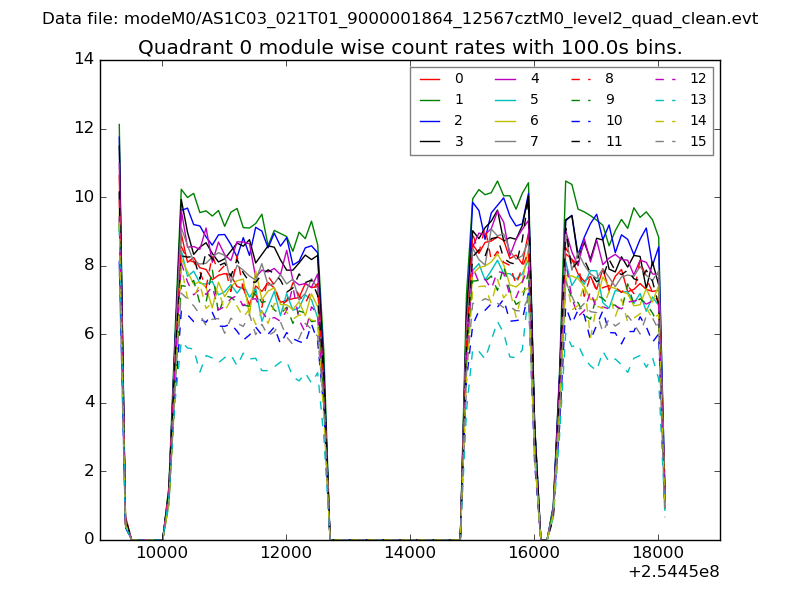
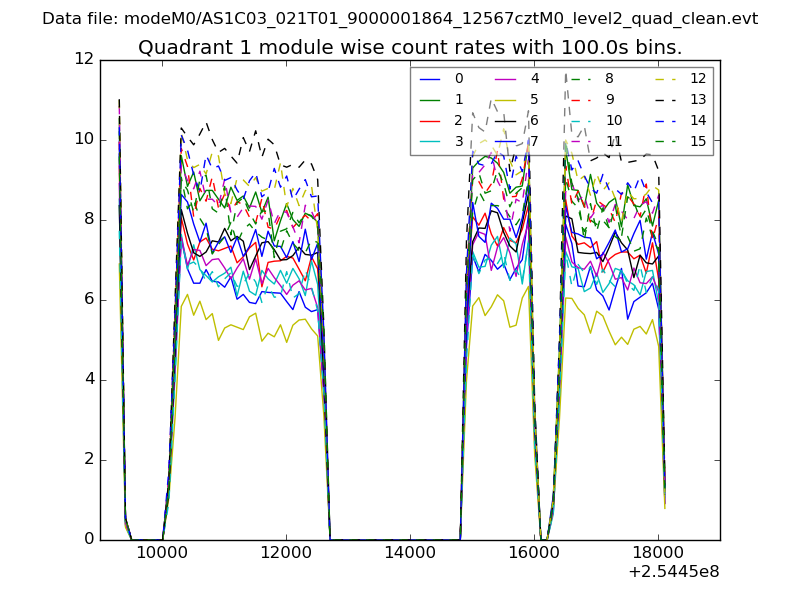
| Module-wise count rates for Quadrant A Data is divided into 100 sec bins |
 |
 |
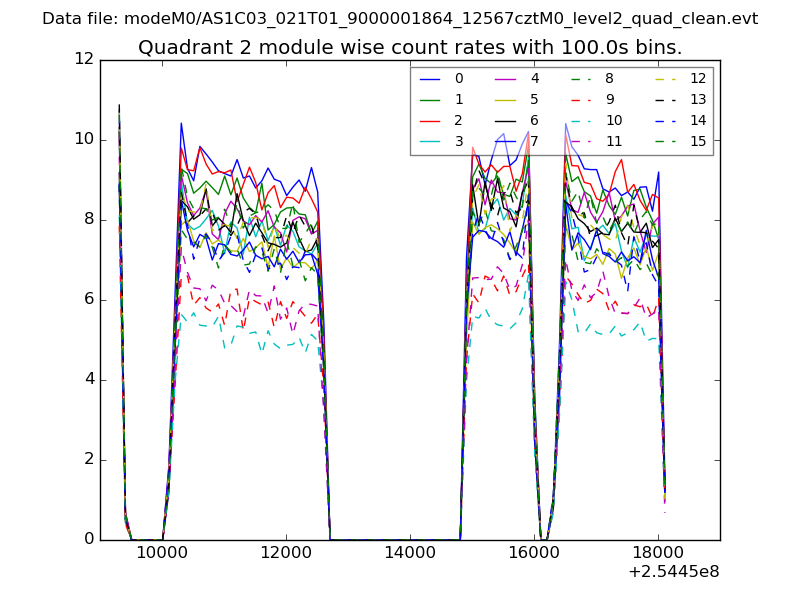
| Module-wise count rates for Quadrant B Data is divided into 100 sec bins |
 |
 |
| Module-wise count rates for Quadrant C Data is divided into 100 sec bins |
 |
 |
| Module-wise count rates for Quadrant D Data is divided into 100 sec bins |
 |
 |
| Parameter | Plot |
|---|---|
| CZT HV Monitor | 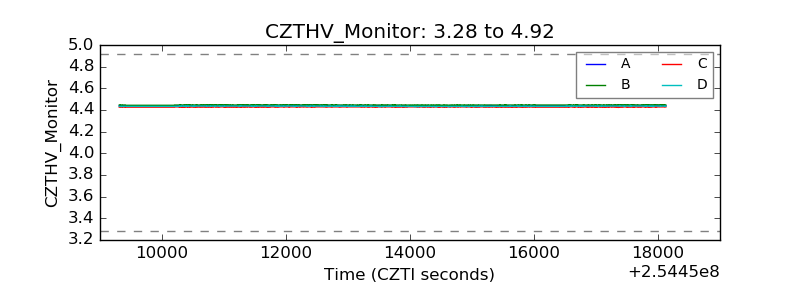 |
| D_VDD | 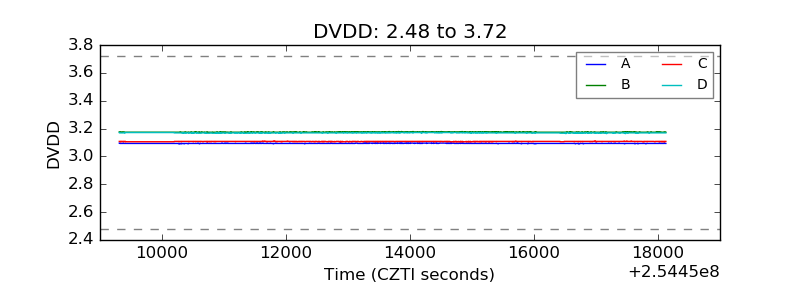 |
| Temperature 1 | 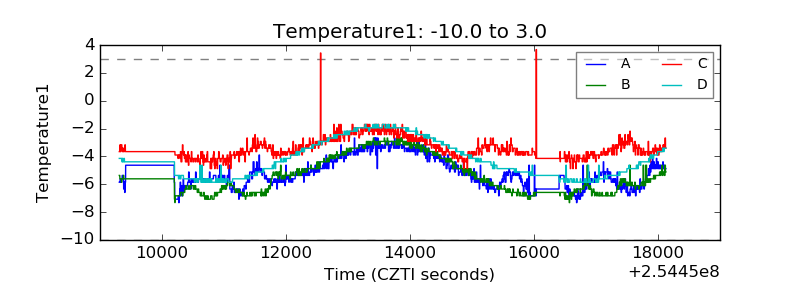 |
| Veto HV Monitor | 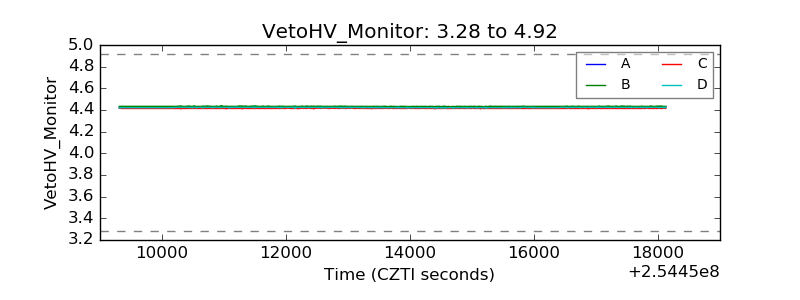 |
| Veto LLD | 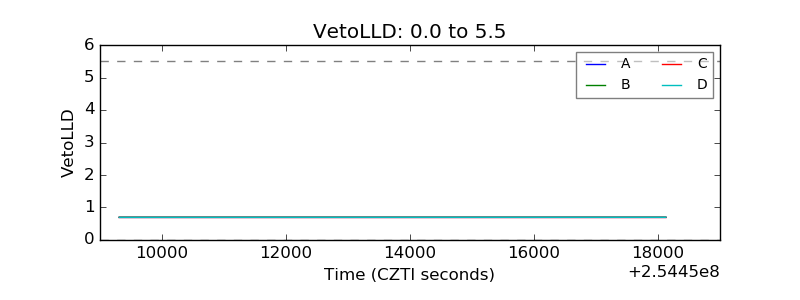 |
| Alpha Counter |  |
| _CPM_Rate | 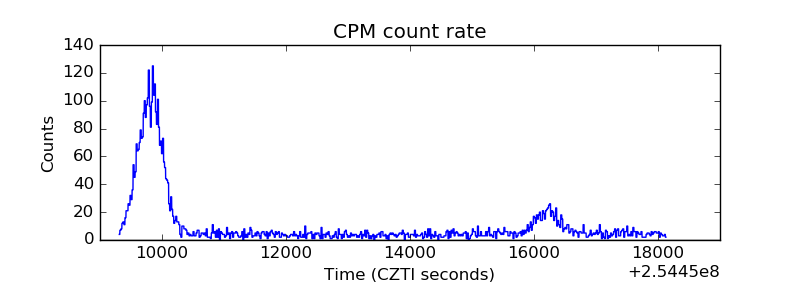 |
| CZT Counter | 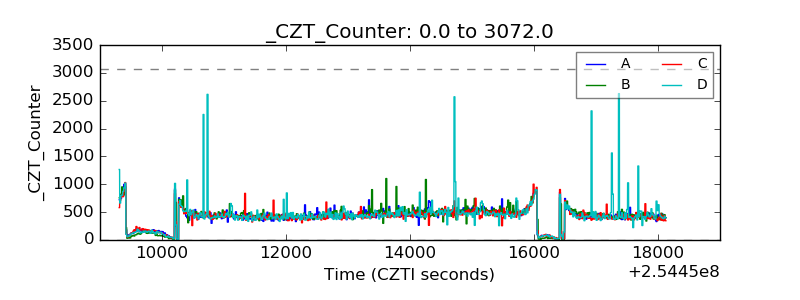 |
| +2.5 Volts monitor |  |
| +5 Volts monitor |  |
| _ROLL_ROT | 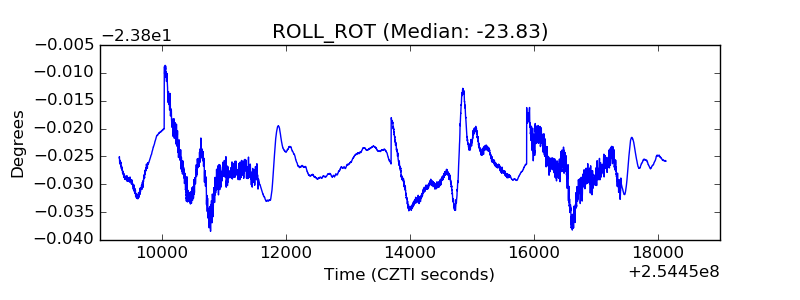 |
| _Roll_DEC | 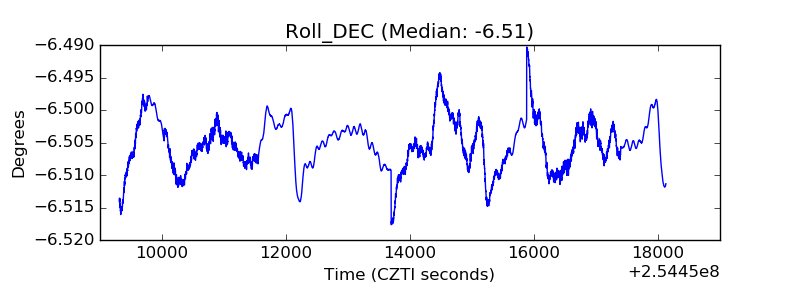 |
| _Roll_RA | 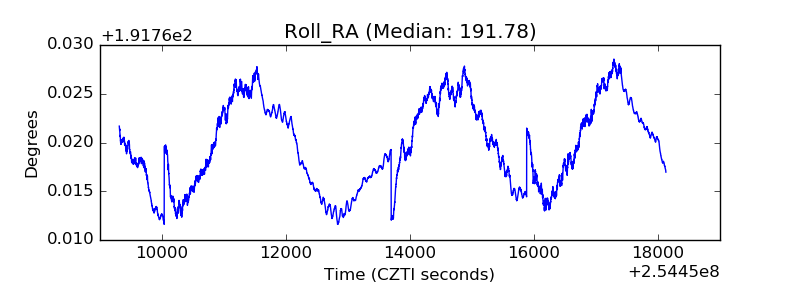 |
| Veto Counter | 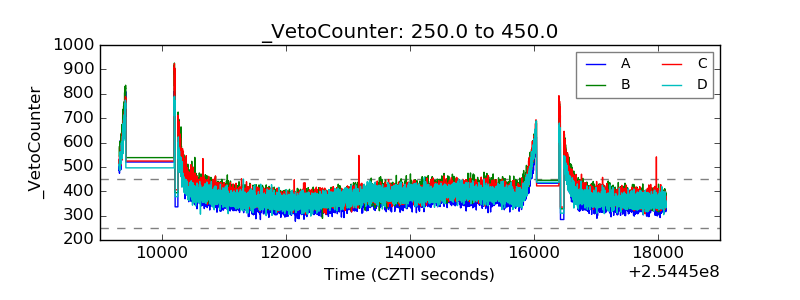 |