| Param | Original file | Final file |
|---|---|---|
| Filename | modeM0/AS1C03_021T01_9000001864_12568cztM0_level2.evt | modeM0/AS1C03_021T01_9000001864_12568cztM0_level2_quad_clean.evt |
| Size (bytes) | 566,694,720 | 100,215,360 |
| Size | 540.4 MB | 95.6 MB |
| Events in quadrant A | 3,523,040 | 642,403 |
| Events in quadrant B | 3,620,164 | 662,948 |
| Events in quadrant C | 3,460,648 | 648,186 |
| Events in quadrant D | 6,042,311 | 552,238 |
| Mode M0 | |||
|---|---|---|---|
| Quadrant | BADHDUFLAG | Total packets | Discarded packets |
| A | 0 | 15604 | 2 |
| B | 0 | 15761 | 1 |
| C | 0 | 15566 | 1 |
| D | 0 | 23235 | 1 |
| Mode SS | |||
|---|---|---|---|
| Quadrant | BADHDUFLAG | Total packets | Discarded packets |
| A | 0 | 154 | 0 |
| B | 0 | 154 | 0 |
| C | 0 | 154 | 0 |
| D | 0 | 154 | 0 |
| Quadrant | Total seconds | Saturated seconds | Saturation percentage |
|---|---|---|---|
| A | 7591 | 164 | 2.160453% |
| B | 7591 | 159 | 2.094586% |
| C | 7591 | 109 | 1.435911% |
| D | 7591 | 1026 | 13.516006% |
Noise dominated data is calculated using 1-second bins in cleaned event files. If a bin has >2000 counts, and if more than 50% of those come from <1% of pixels, then it is considered to be noise-dominated and hence unusable.
| Quadrant | # 1 sec bins | Bins with >0 counts | Bins with >2000 counts | High rate bins dominated by noise | Noise dominated (total time) | Noise dominated (detector-on time) | Marked lightcurve |
|---|---|---|---|---|---|---|---|
| A | 7632 | 7593 | 0 | 0 | 0.00% | 0.00% | 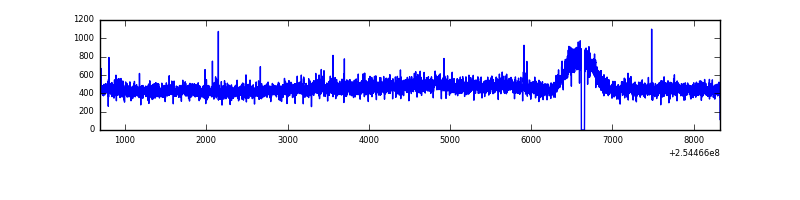 |
| B | 7632 | 7593 | 1 | 1 | 0.01% | 0.01% | 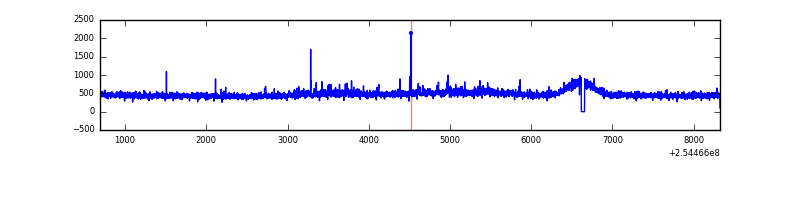 |
| C | 7632 | 7593 | 0 | 0 | 0.00% | 0.00% | 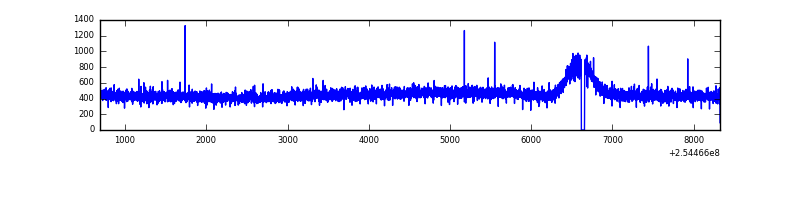 |
| D | 7632 | 7593 | 819 | 819 | 10.73% | 10.79% | 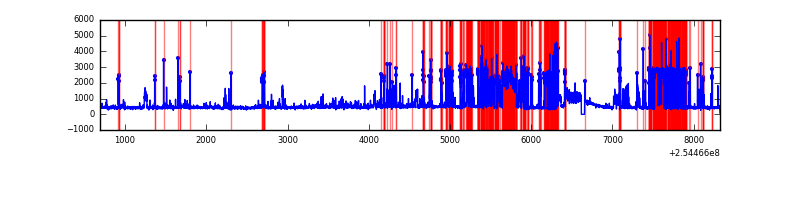 |
Top three noisy pixels from each quadrant. If the there are fewer than three noisy pixels in the level2.evt file, extra rows are filled as -1
| Pixel properties | Quadrant properties | ||||||
|---|---|---|---|---|---|---|---|
| Quadrant | DetID | PixID | Counts | Sigma | Mean | Median | Sigma |
| A | 12 | 189 | 19661 | 101.42 | 903 | 885 | 185.1 |
| A | 1 | 162 | 11683 | 58.33 | 903 | 885 | 185.1 |
| A | 0 | 226 | 7877 | 37.77 | 903 | 885 | 185.1 |
| B | 11 | 51 | 59574 | 333.36 | 905 | 881 | 176.1 |
| B | 0 | 214 | 20556 | 111.75 | 905 | 881 | 176.1 |
| B | 12 | 111 | 20545 | 111.69 | 905 | 881 | 176.1 |
| C | 13 | 61 | 6394 | 26.71 | 883 | 884 | 206.3 |
| C | 8 | 128 | 4983 | 19.87 | 883 | 884 | 206.3 |
| C | 15 | 208 | 3916 | 14.69 | 883 | 884 | 206.3 |
| D | 1 | 52 | 2787578 | 14124.01 | 815 | 791 | 197.3 |
| D | 13 | 249 | 103975 | 522.96 | 815 | 791 | 197.3 |
| D | 9 | 85 | 39457 | 195.97 | 815 | 791 | 197.3 |
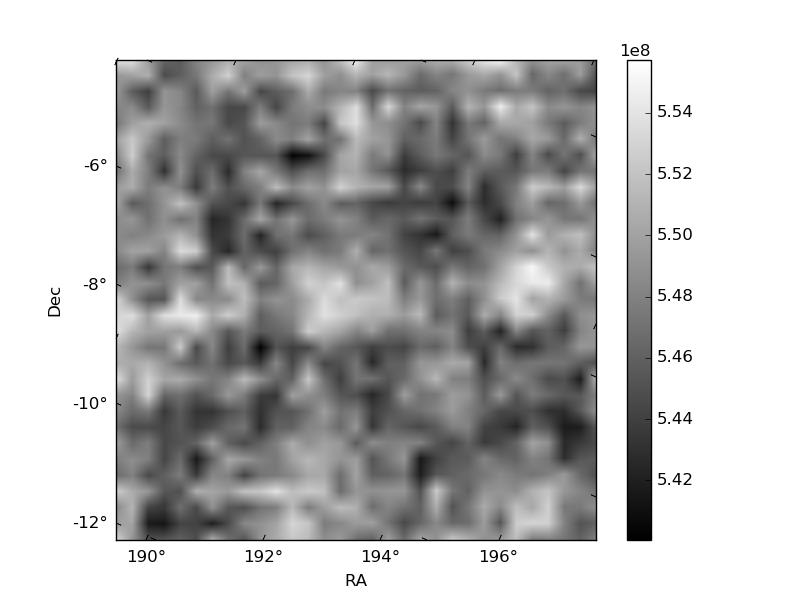
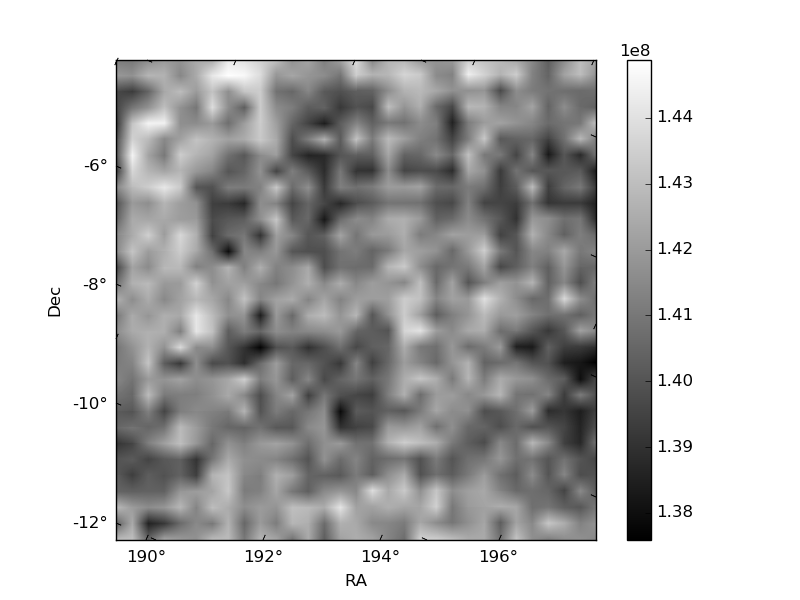
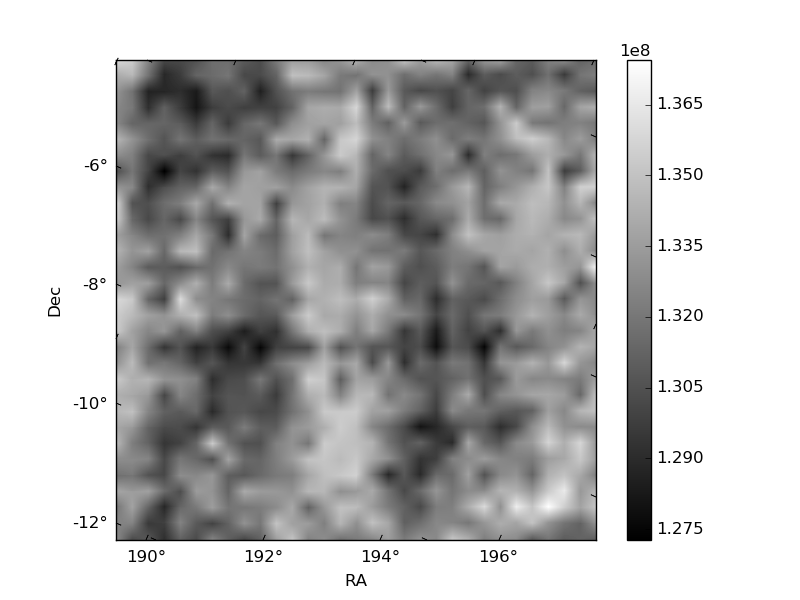
Histogram calculated using DETX and DETY for each event in the final _common_clean file
| Quadrant A | 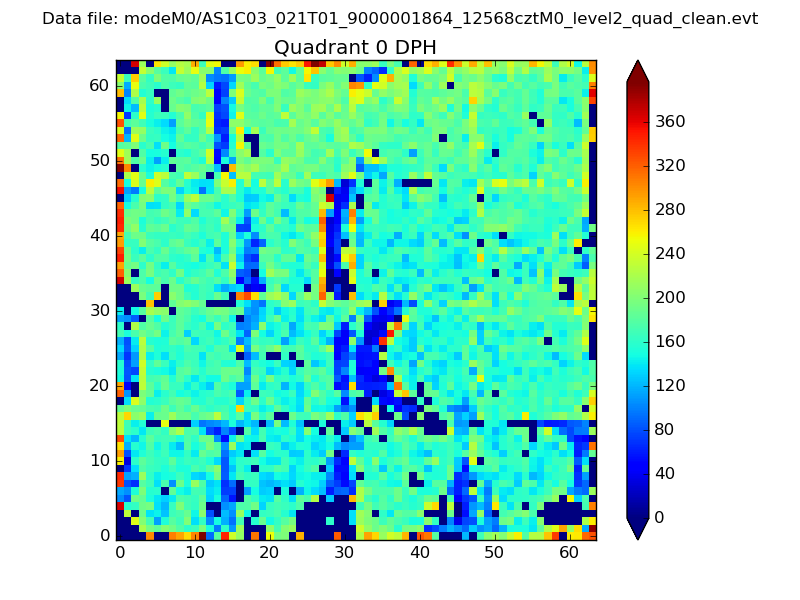 |
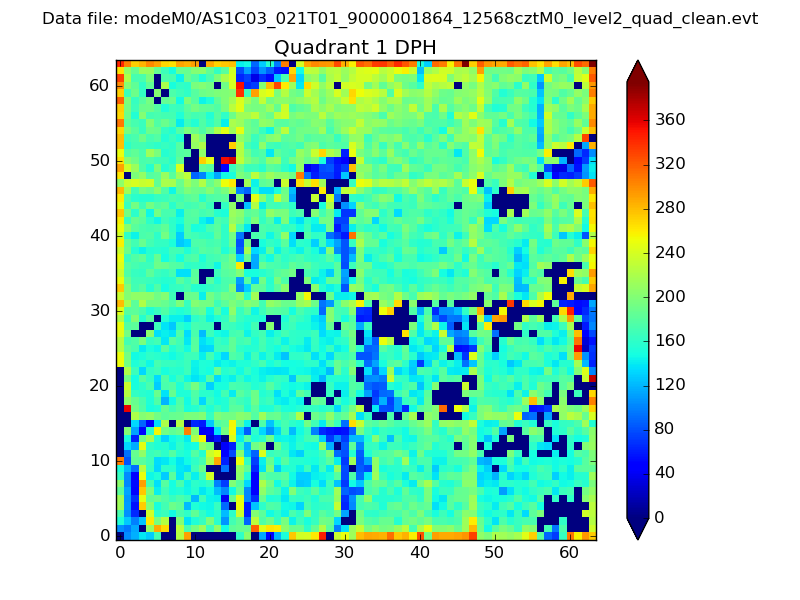 |
Quadrant B |
|---|---|---|---|
| Quadrant D | 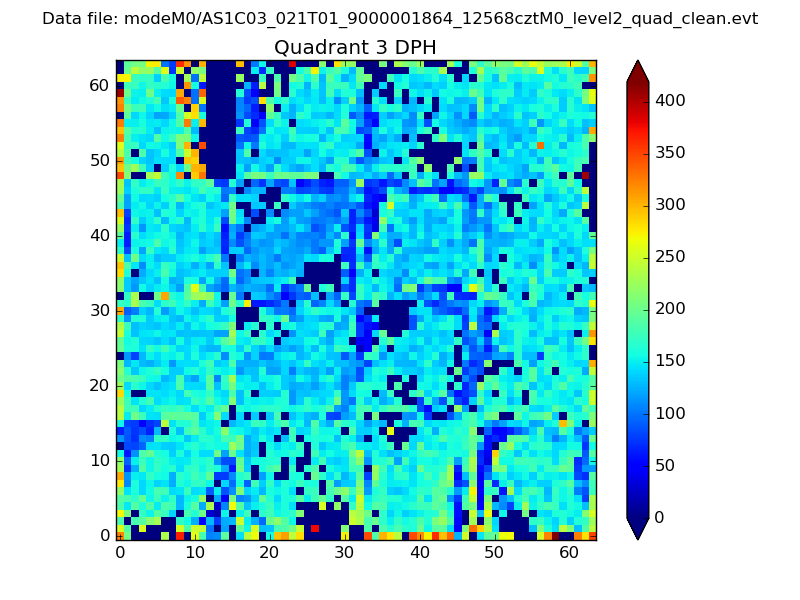 |
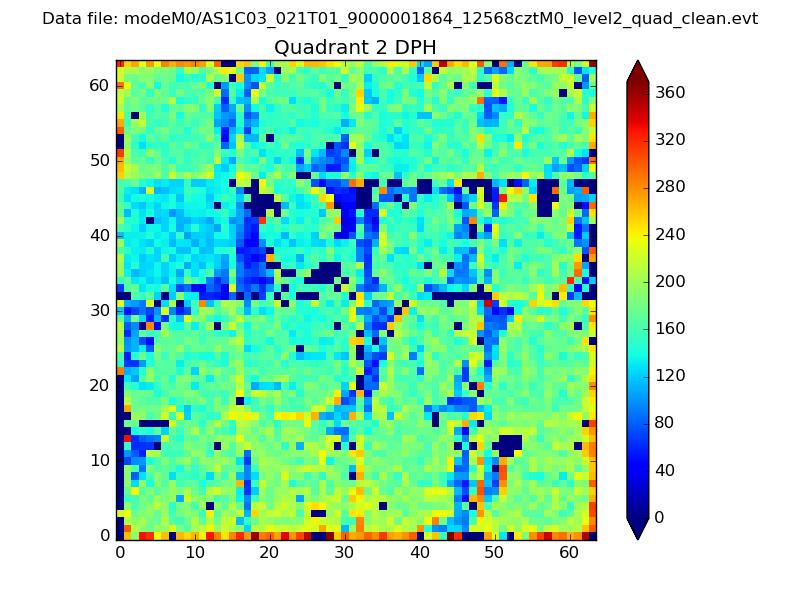 |
Quadrant C |
| Plot type | Count rate plots | Images |
|---|---|---|
| Comparison with Poisson distribution Blue bars denote a histogram of data divided into 1 sec bins. Red curve is a Poisson curve with rate = median count rate of data. |
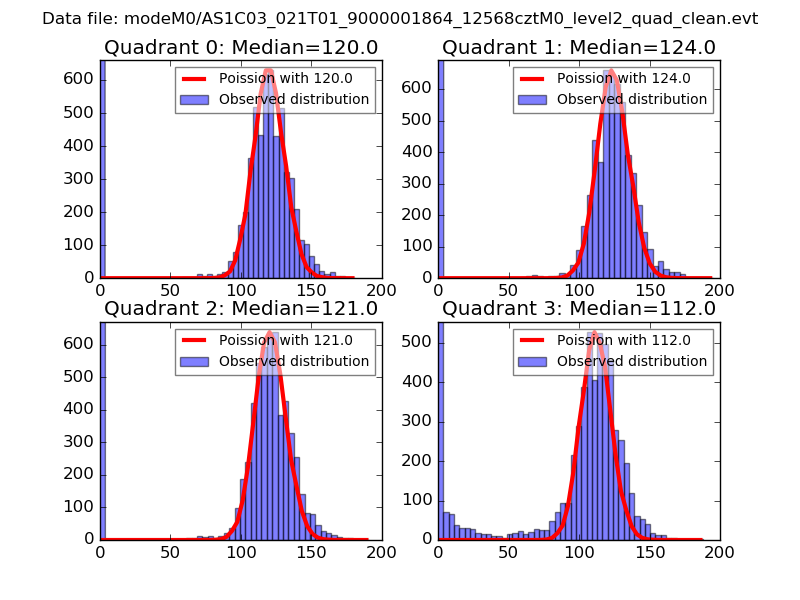 |
 |
| Quadrant-wise count rates Data is divided into 100 sec bins |
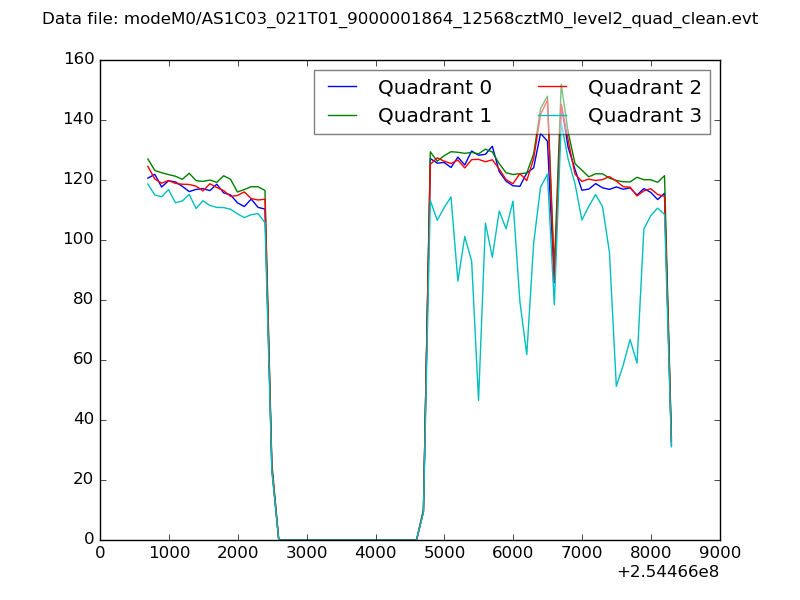 |
|
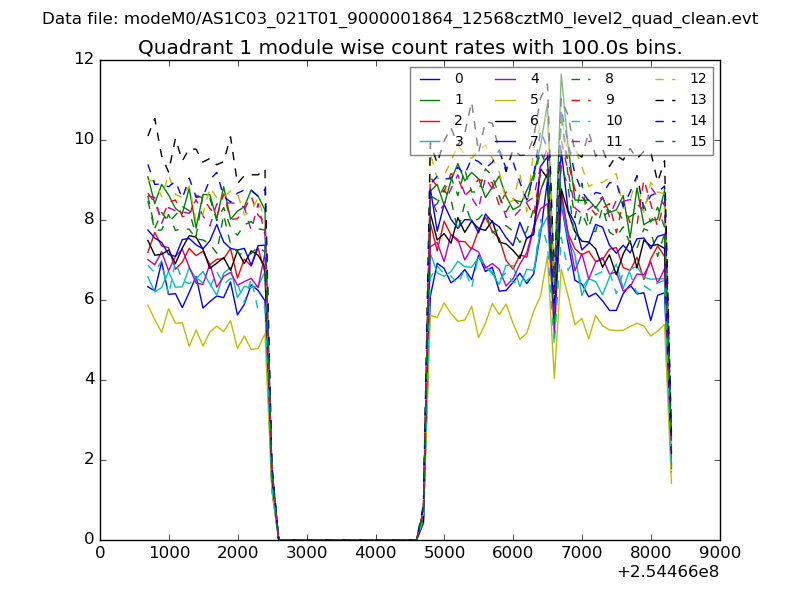
| Module-wise count rates for Quadrant A Data is divided into 100 sec bins |
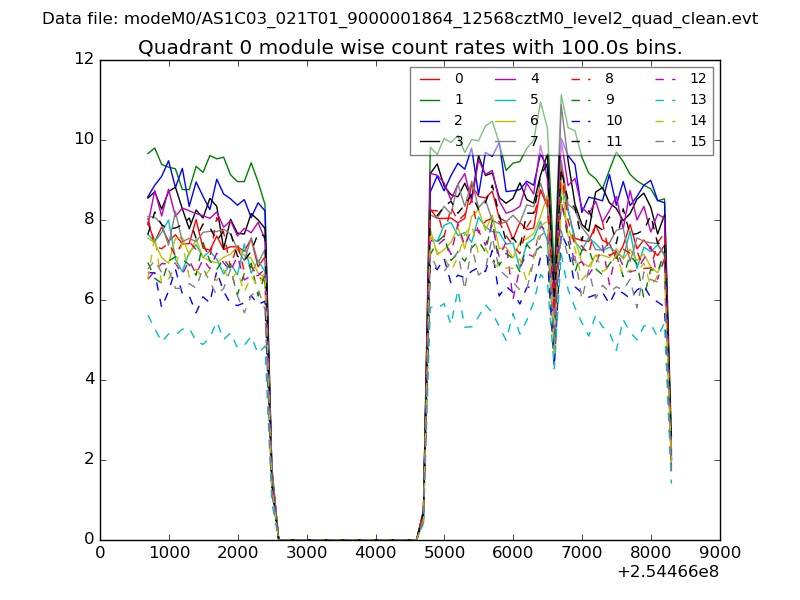 |
 |
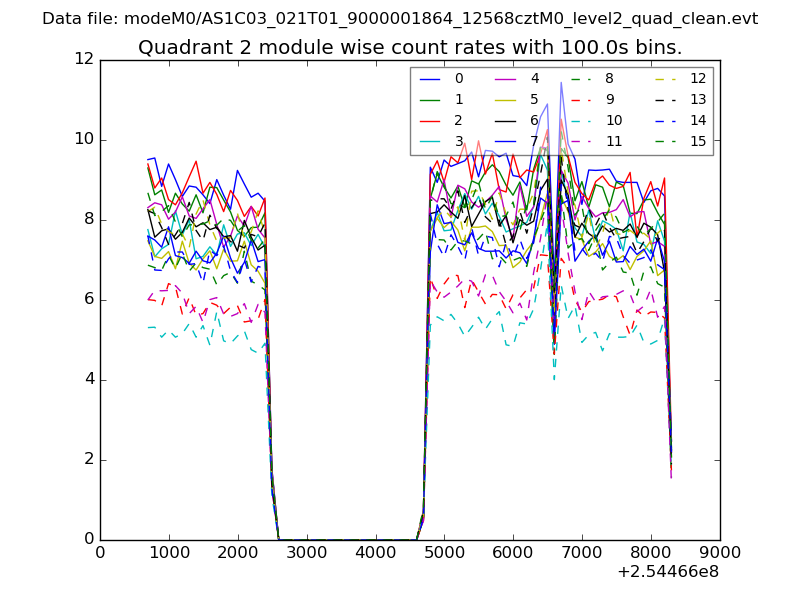
| Module-wise count rates for Quadrant B Data is divided into 100 sec bins |
 |
 |
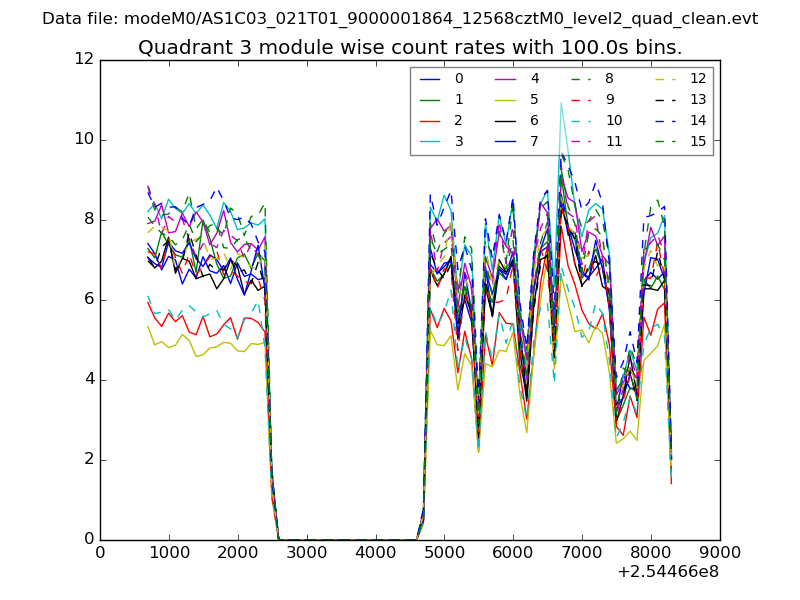
| Module-wise count rates for Quadrant C Data is divided into 100 sec bins |
 |
 |
| Module-wise count rates for Quadrant D Data is divided into 100 sec bins |
 |
 |
| Parameter | Plot |
|---|---|
| CZT HV Monitor | 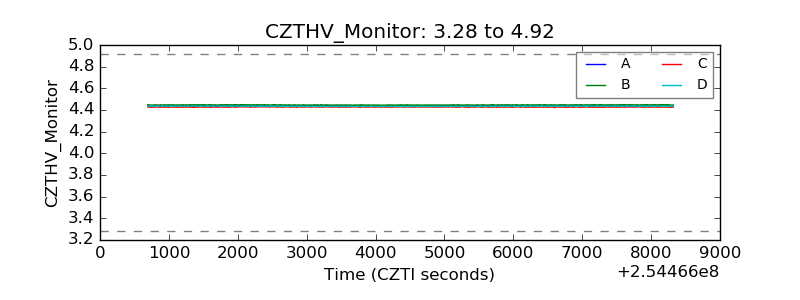 |
| D_VDD | 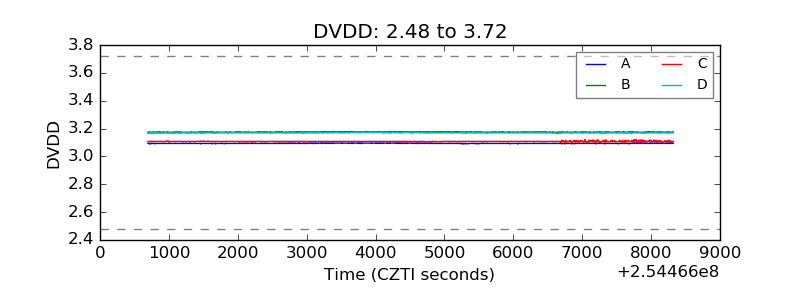 |
| Temperature 1 | 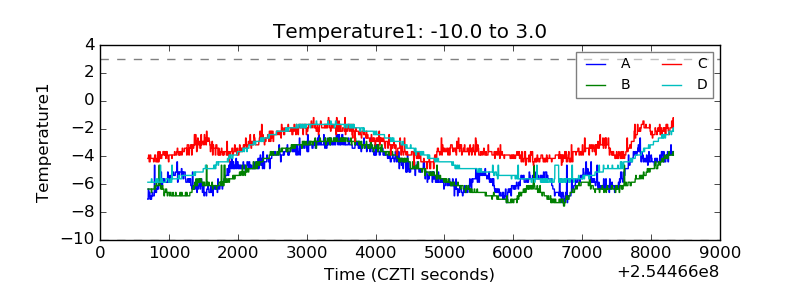 |
| Veto HV Monitor | 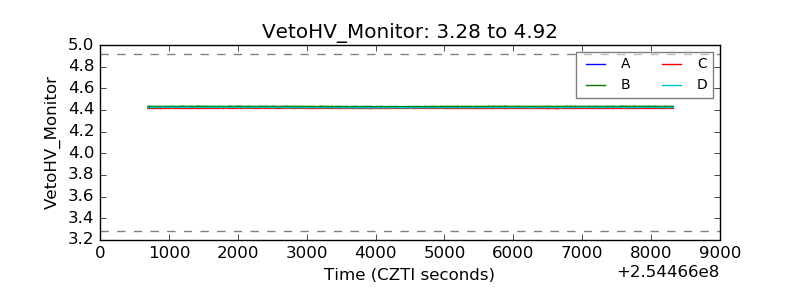 |
| Veto LLD | 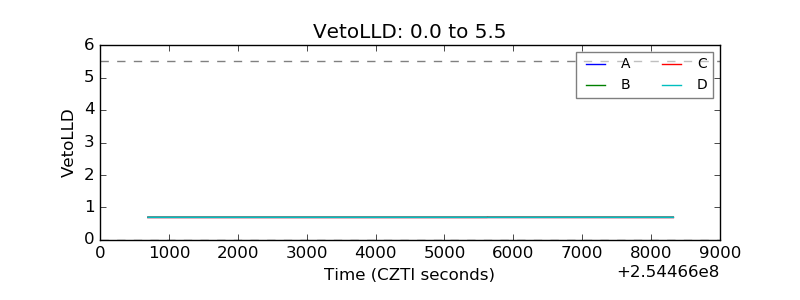 |
| Alpha Counter | 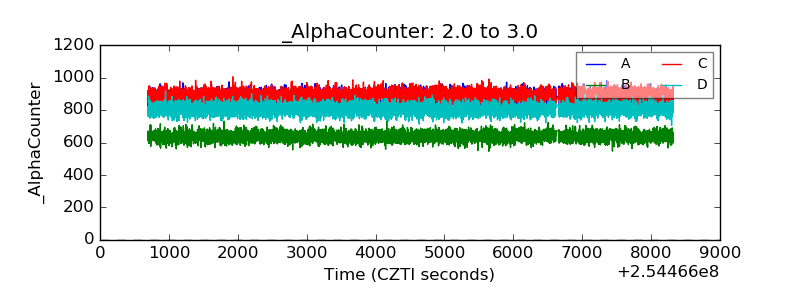 |
| _CPM_Rate | 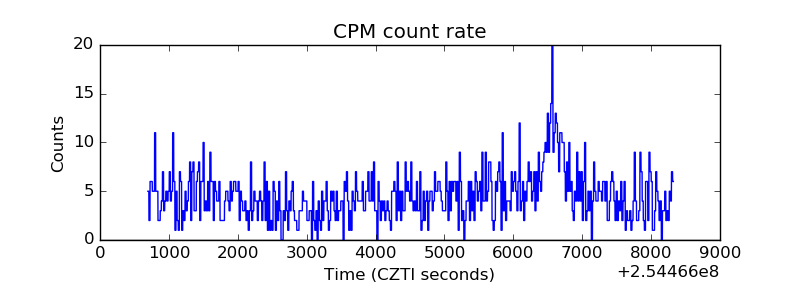 |
| CZT Counter | 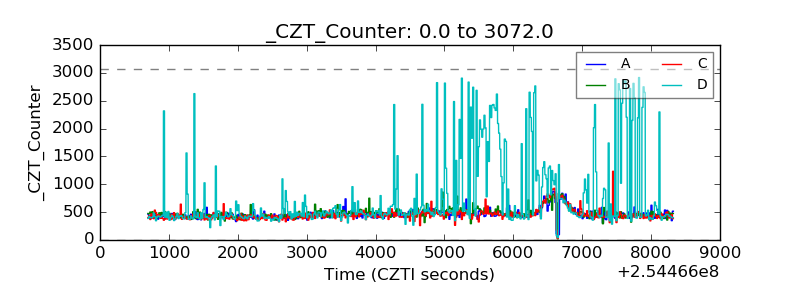 |
| +2.5 Volts monitor |  |
| +5 Volts monitor |  |
| _ROLL_ROT | 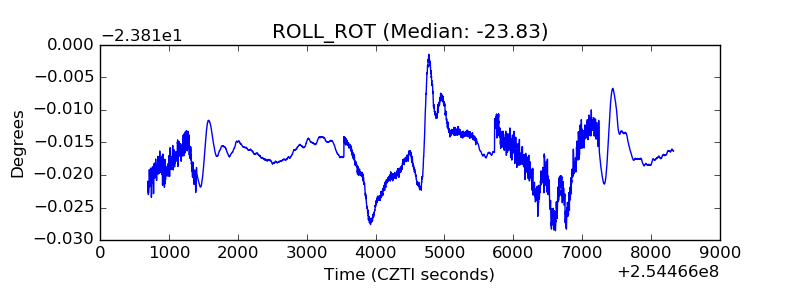 |
| _Roll_DEC | 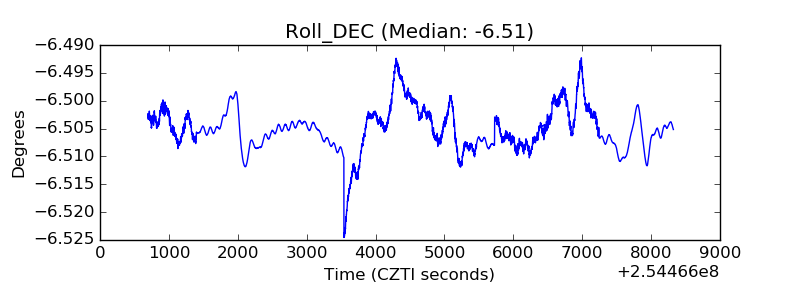 |
| _Roll_RA | 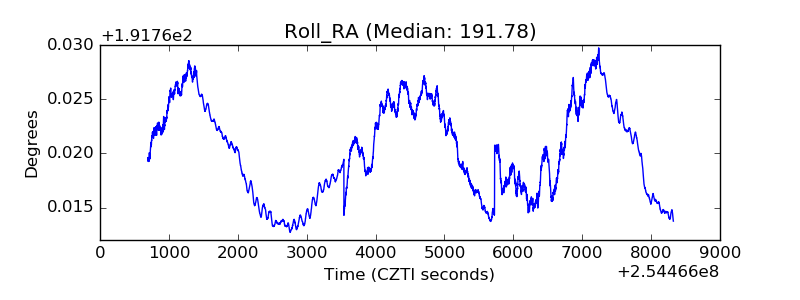 |
| Veto Counter | 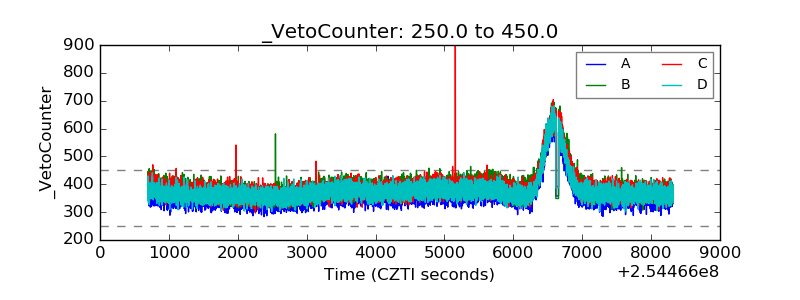 |