| Param | Original file | Final file |
|---|---|---|
| Filename | modeM0/AS1A02_058T03_9000001870_12576cztM0_level2.evt | modeM0/AS1A02_058T03_9000001870_12576cztM0_level2_quad_clean.evt |
| Size (bytes) | 218,790,720 | 38,914,560 |
| Size | 208.7 MB | 37.1 MB |
| Events in quadrant A | 1,504,404 | 244,402 |
| Events in quadrant B | 1,766,565 | 247,854 |
| Events in quadrant C | 1,486,053 | 246,058 |
| Events in quadrant D | 1,666,156 | 228,591 |
| Mode M0 | |||
|---|---|---|---|
| Quadrant | BADHDUFLAG | Total packets | Discarded packets |
| A | 0 | 6281 | 2 |
| B | 0 | 7111 | 1 |
| C | 0 | 6199 | 1 |
| D | 0 | 6822 | 1 |
| Mode SS | |||
|---|---|---|---|
| Quadrant | BADHDUFLAG | Total packets | Discarded packets |
| A | 0 | 60 | 0 |
| B | 0 | 60 | 0 |
| C | 0 | 60 | 0 |
| D | 0 | 60 | 0 |
| Mode M9 | |||
|---|---|---|---|
| Quadrant | BADHDUFLAG | Total packets | Discarded packets |
| A | 0 | 13 | 0 |
| B | 0 | 13 | 0 |
| C | 0 | 13 | 0 |
| D | 0 | 13 | 0 |
| Quadrant | Total seconds | Saturated seconds | Saturation percentage |
|---|---|---|---|
| A | 2964 | 30 | 1.012146% |
| B | 2964 | 81 | 2.732794% |
| C | 2964 | 16 | 0.539811% |
| D | 2964 | 46 | 1.551957% |
Noise dominated data is calculated using 1-second bins in cleaned event files. If a bin has >2000 counts, and if more than 50% of those come from <1% of pixels, then it is considered to be noise-dominated and hence unusable.
| Quadrant | # 1 sec bins | Bins with >0 counts | Bins with >2000 counts | High rate bins dominated by noise | Noise dominated (total time) | Noise dominated (detector-on time) | Marked lightcurve |
|---|---|---|---|---|---|---|---|
| A | 4215 | 2965 | 1 | 1 | 0.02% | 0.03% | 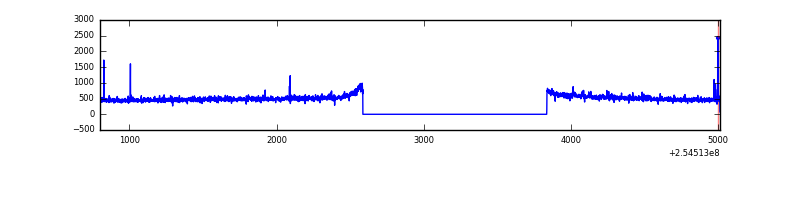 |
| B | 4215 | 2965 | 34 | 34 | 0.81% | 1.15% | 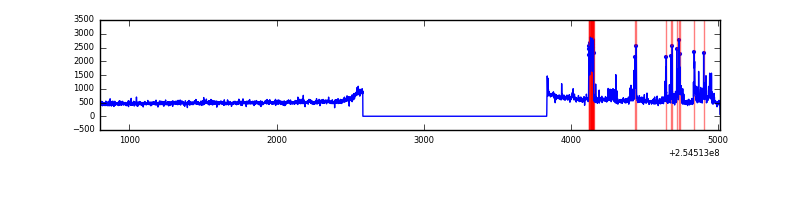 |
| C | 4215 | 2965 | 0 | 0 | 0.00% | 0.00% | 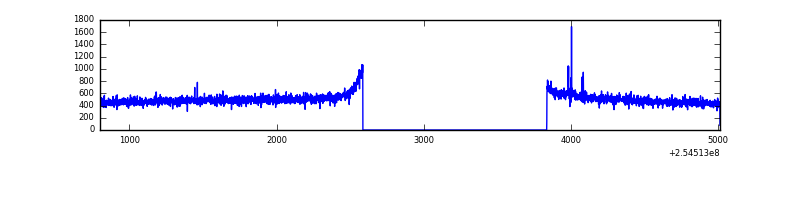 |
| D | 4215 | 2966 | 30 | 30 | 0.71% | 1.01% | 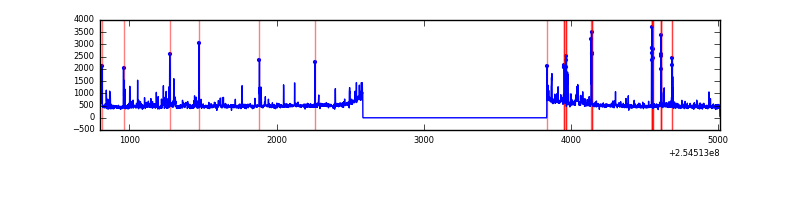 |
Top three noisy pixels from each quadrant. If the there are fewer than three noisy pixels in the level2.evt file, extra rows are filled as -1
| Pixel properties | Quadrant properties | ||||||
|---|---|---|---|---|---|---|---|
| Quadrant | DetID | PixID | Counts | Sigma | Mean | Median | Sigma |
| A | 12 | 96 | 14552 | 178.54 | 385 | 377 | 79.4 |
| A | 12 | 189 | 4214 | 48.33 | 385 | 377 | 79.4 |
| A | 0 | 226 | 3459 | 38.82 | 385 | 377 | 79.4 |
| B | 4 | 239 | 198375 | 2666.04 | 387 | 378 | 74.3 |
| B | 0 | 197 | 17902 | 235.96 | 387 | 378 | 74.3 |
| B | 0 | 229 | 11199 | 145.71 | 387 | 378 | 74.3 |
| C | 14 | 234 | 7252 | 78.08 | 379 | 381 | 88.0 |
| C | 13 | 61 | 2766 | 27.1 | 379 | 381 | 88.0 |
| C | 8 | 222 | 1486 | 12.56 | 379 | 381 | 88.0 |
| D | 1 | 52 | 193006 | 2142.42 | 371 | 359 | 89.9 |
| D | 13 | 249 | 23925 | 262.08 | 371 | 359 | 89.9 |
| D | 10 | 157 | 19469 | 212.52 | 371 | 359 | 89.9 |
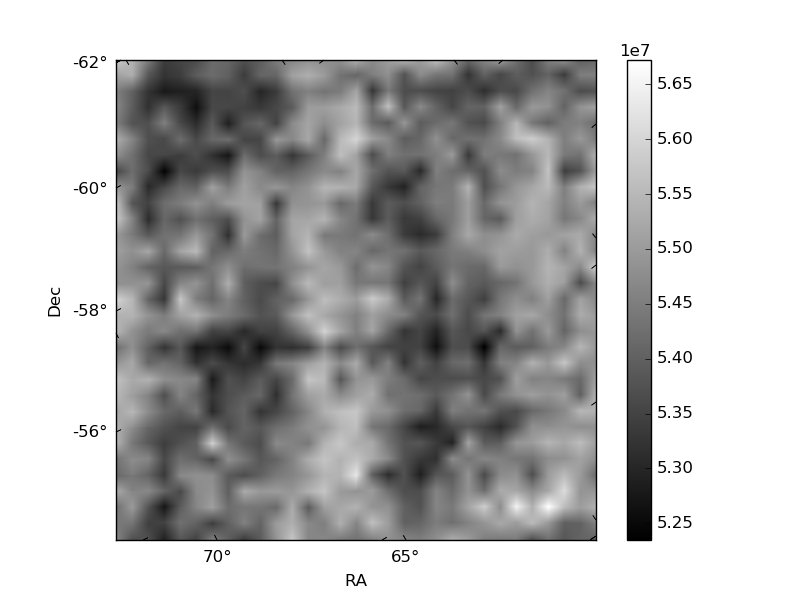
Histogram calculated using DETX and DETY for each event in the final _common_clean file
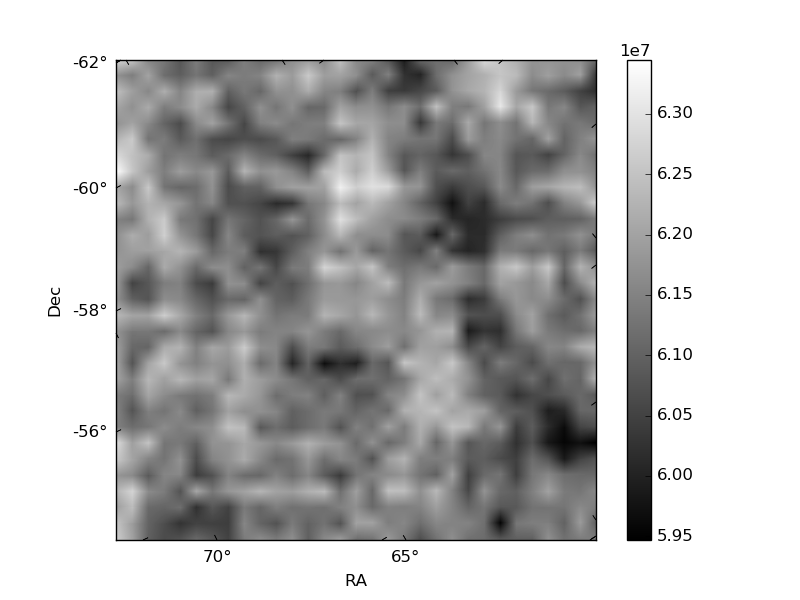
| Quadrant A | 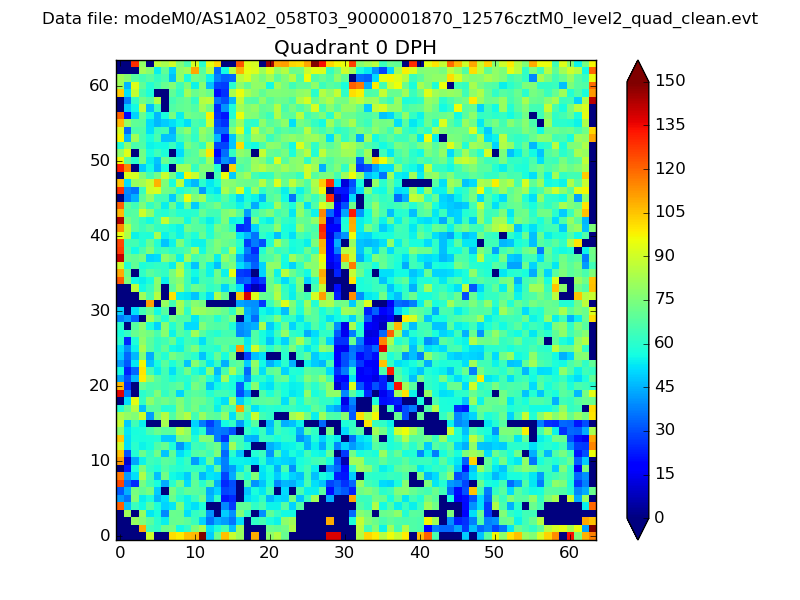 |
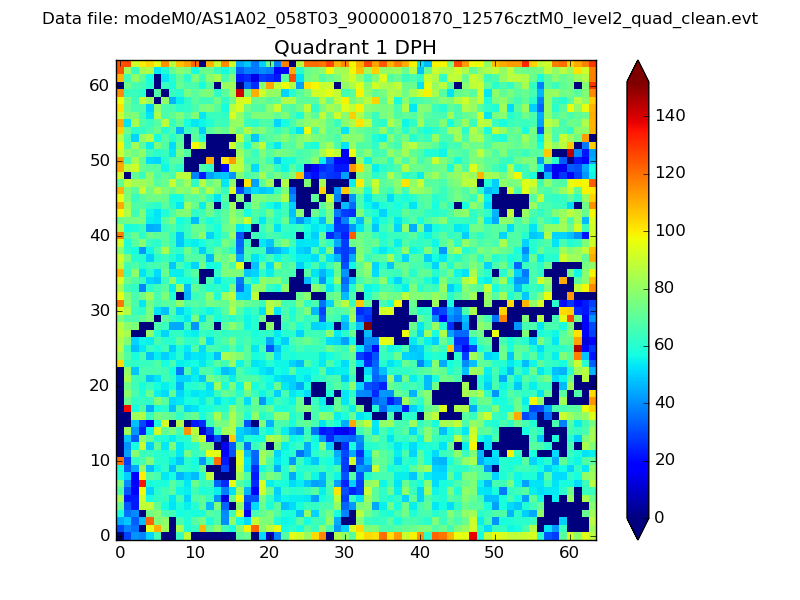 |
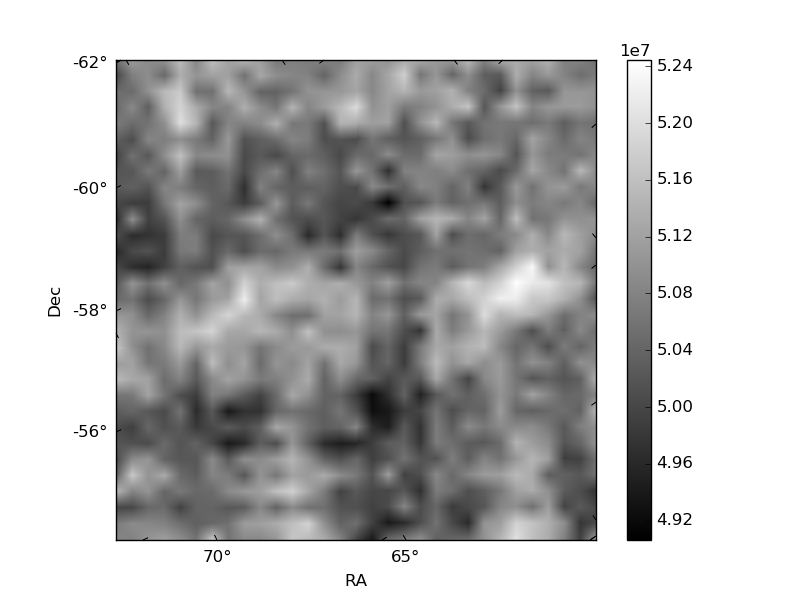
Quadrant B |
|---|---|---|---|
| Quadrant D | 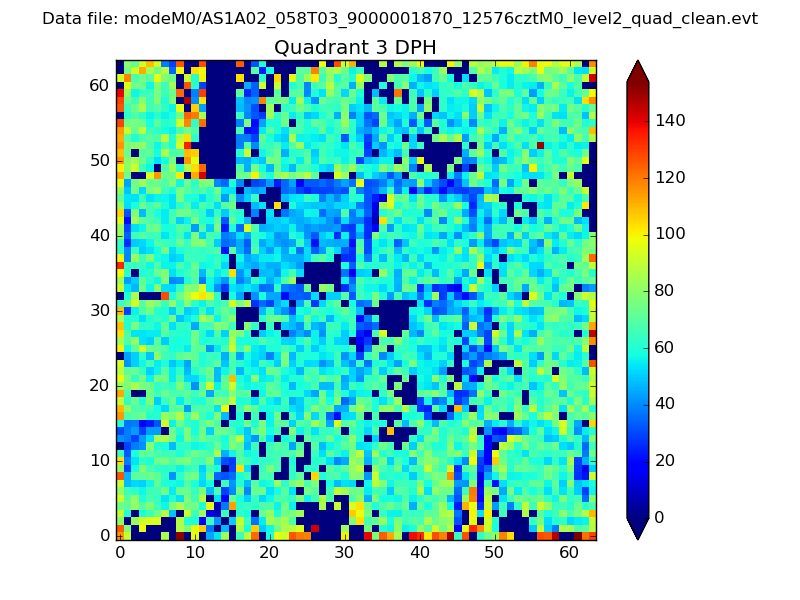 |
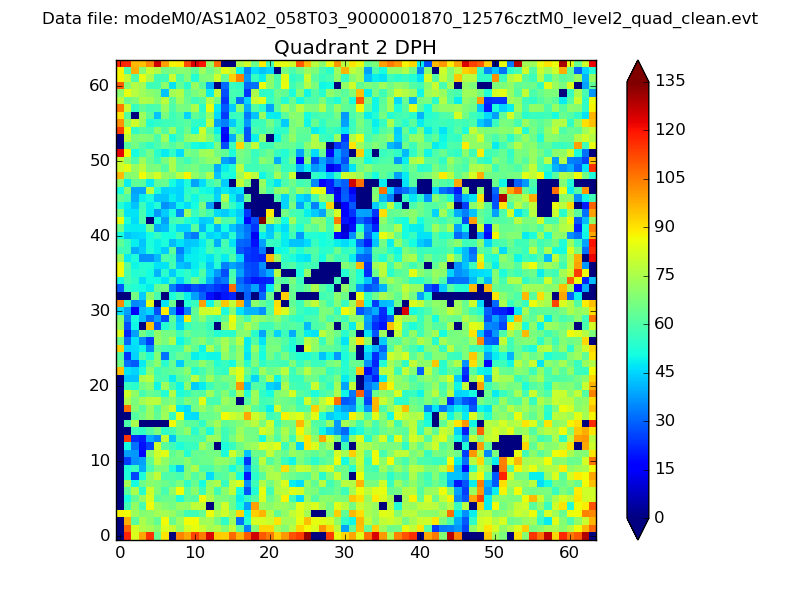 |
Quadrant C |
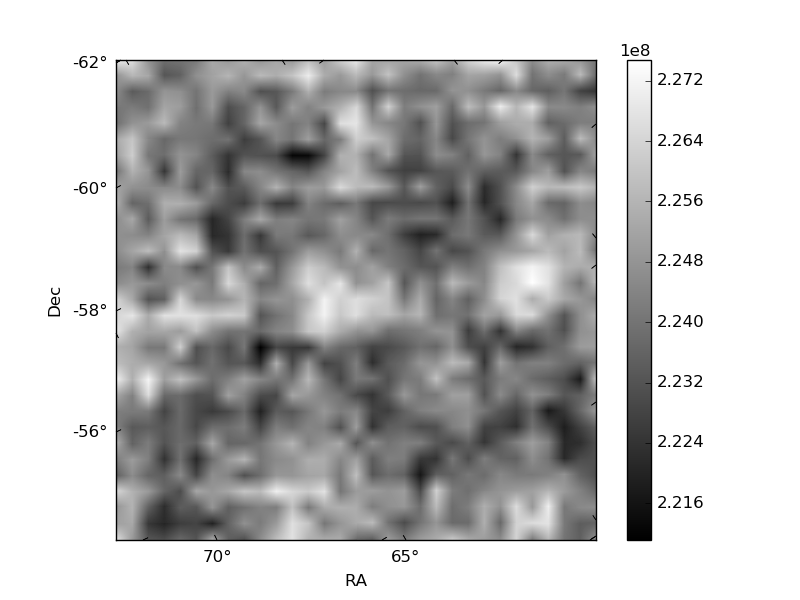
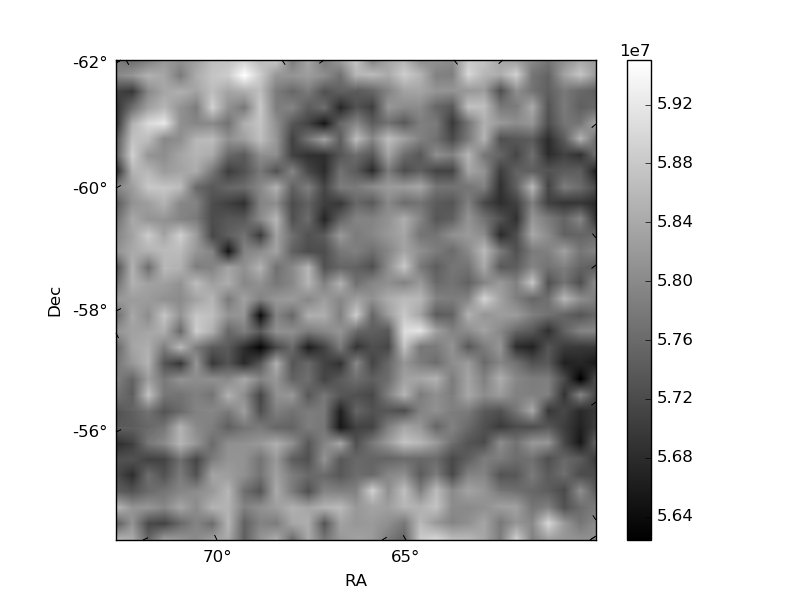
| Plot type | Count rate plots | Images |
|---|---|---|
| Comparison with Poisson distribution Blue bars denote a histogram of data divided into 1 sec bins. Red curve is a Poisson curve with rate = median count rate of data. |
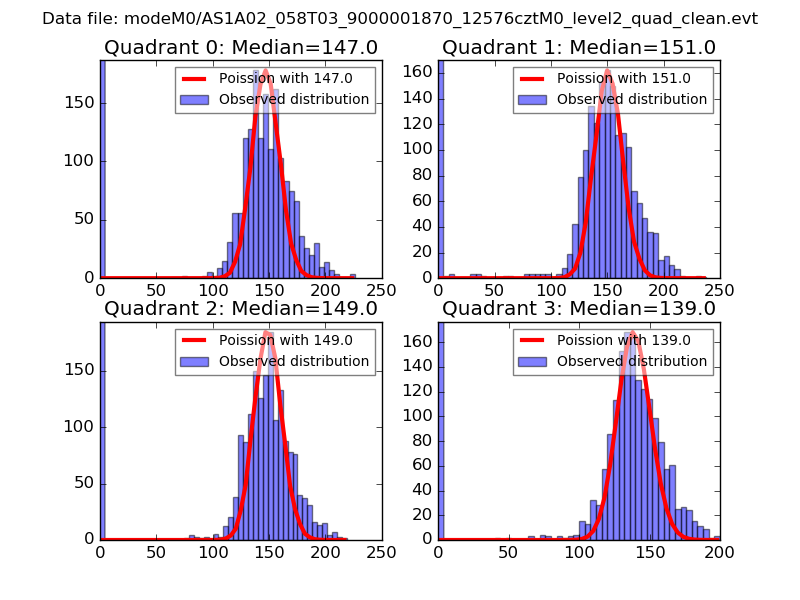 |
 |
| Quadrant-wise count rates Data is divided into 100 sec bins |
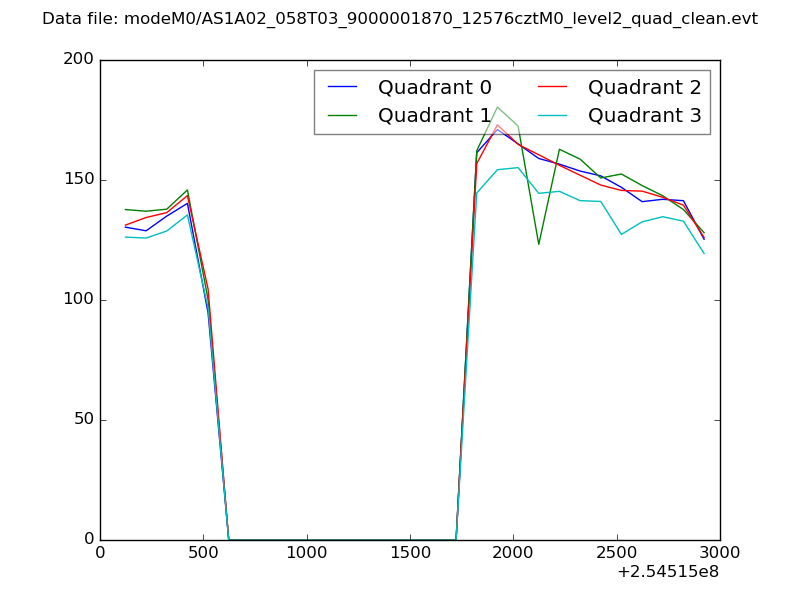 |
|
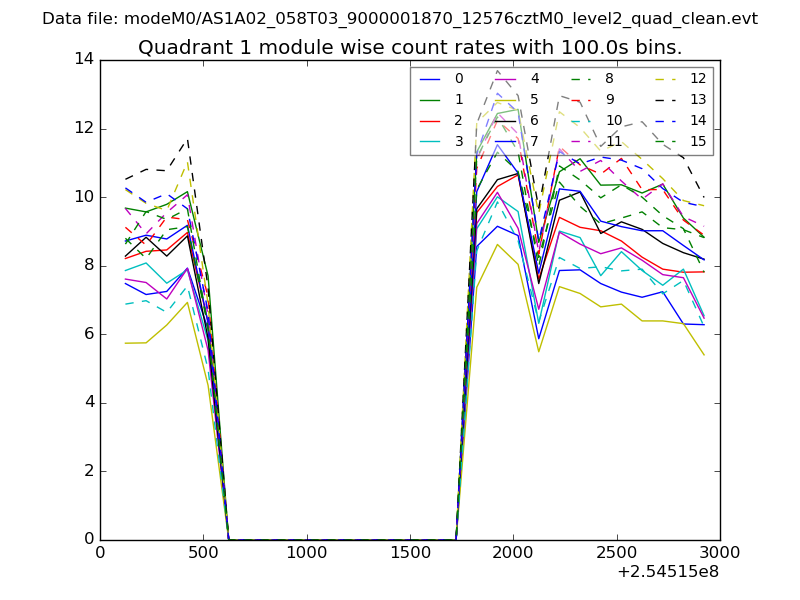
| Module-wise count rates for Quadrant A Data is divided into 100 sec bins |
 |
 |
| Module-wise count rates for Quadrant B Data is divided into 100 sec bins |
 |
 |
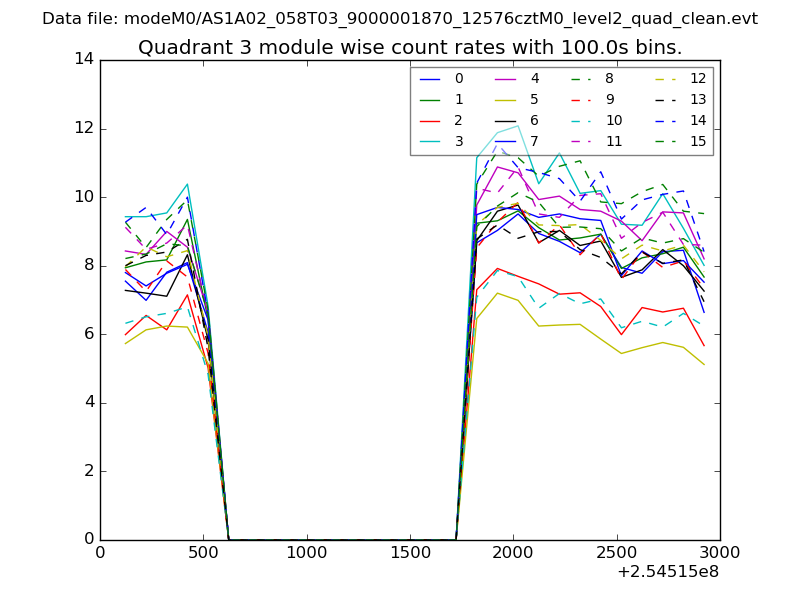
| Module-wise count rates for Quadrant C Data is divided into 100 sec bins |
 |
 |
| Module-wise count rates for Quadrant D Data is divided into 100 sec bins |
 |
 |
| Parameter | Plot |
|---|---|
| CZT HV Monitor | 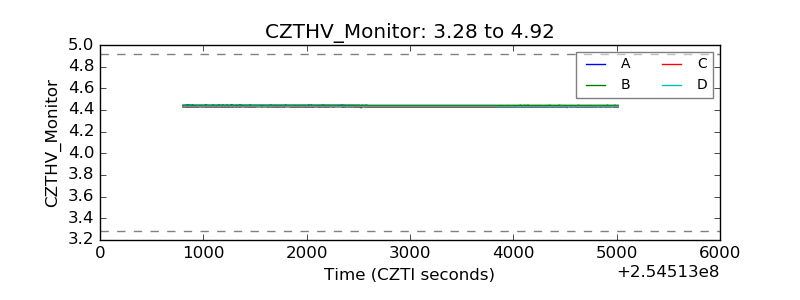 |
| D_VDD | 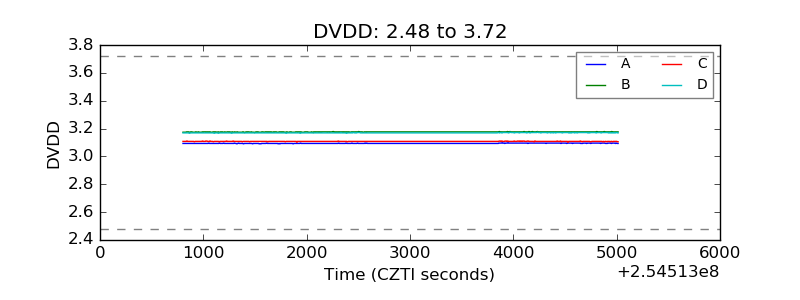 |
| Temperature 1 | 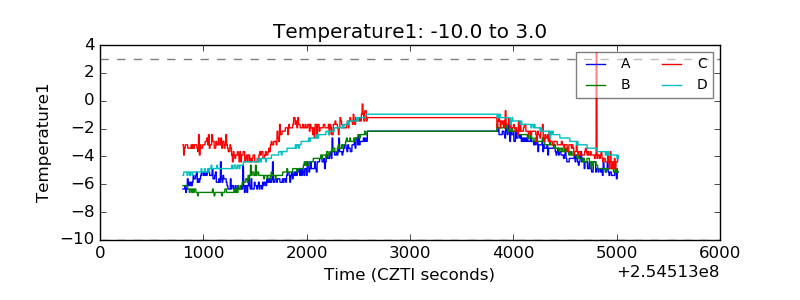 |
| Veto HV Monitor | 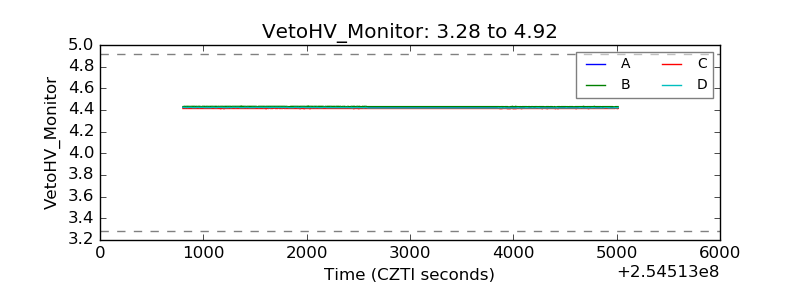 |
| Veto LLD |  |
| Alpha Counter | 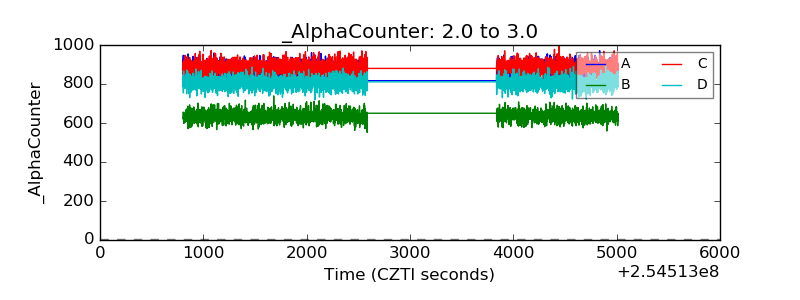 |
| _CPM_Rate |  |
| CZT Counter | 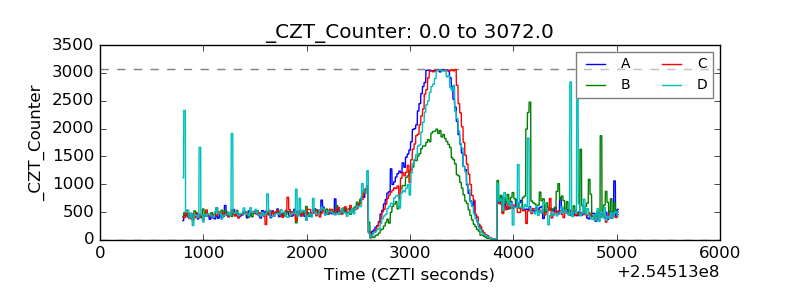 |
| +2.5 Volts monitor |  |
| +5 Volts monitor |  |
| _ROLL_ROT | 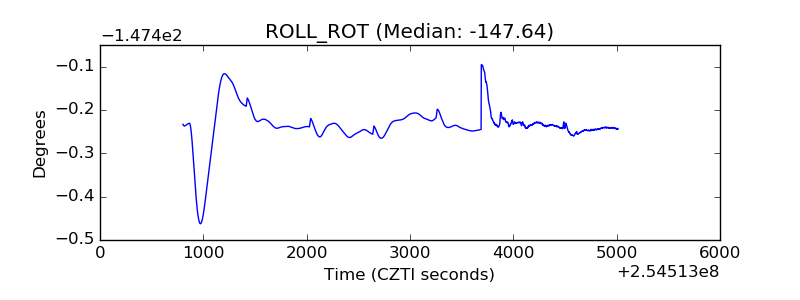 |
| _Roll_DEC | 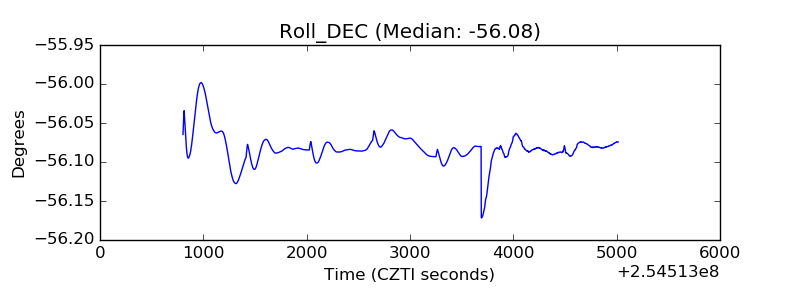 |
| _Roll_RA | 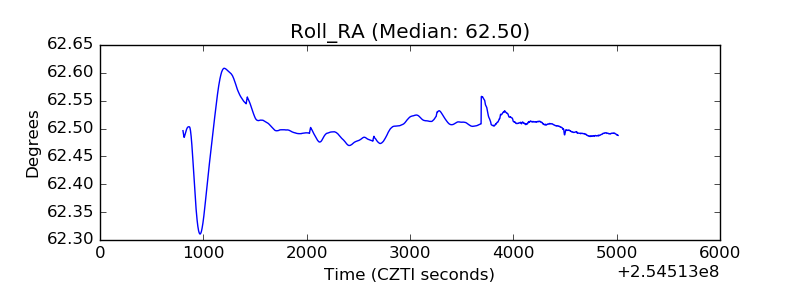 |
| Veto Counter | 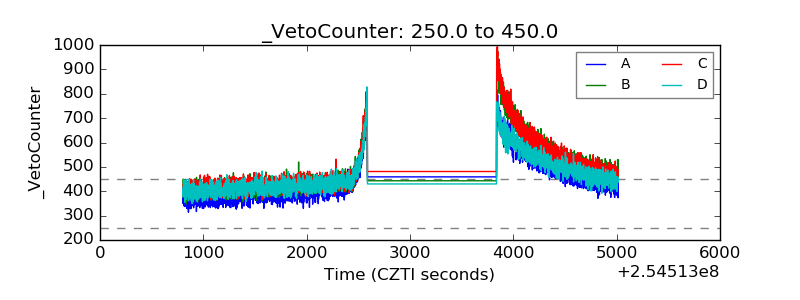 |