| Param | Original file | Final file |
|---|---|---|
| Filename | modeM0/AS1A04_085T01_9000001868_12572cztM0_level2.evt | modeM0/AS1A04_085T01_9000001868_12572cztM0_level2_quad_clean.evt |
| Size (bytes) | 243,901,440 | 44,354,880 |
| Size | 232.6 MB | 42.3 MB |
| Events in quadrant A | 1,713,520 | 273,107 |
| Events in quadrant B | 1,860,539 | 277,277 |
| Events in quadrant C | 1,711,666 | 274,062 |
| Events in quadrant D | 1,854,829 | 263,874 |
| Mode SS | |||
|---|---|---|---|
| Quadrant | BADHDUFLAG | Total packets | Discarded packets |
| A | 0 | 72 | 0 |
| B | 0 | 72 | 0 |
| C | 0 | 72 | 0 |
| D | 0 | 72 | 0 |
| Mode M0 | |||
|---|---|---|---|
| Quadrant | BADHDUFLAG | Total packets | Discarded packets |
| A | 0 | 7414 | 2 |
| B | 0 | 7774 | 1 |
| C | 0 | 7462 | 1 |
| D | 0 | 7994 | 1 |
| Mode M9 | |||
|---|---|---|---|
| Quadrant | BADHDUFLAG | Total packets | Discarded packets |
| A | 0 | 9 | 0 |
| B | 0 | 9 | 0 |
| C | 0 | 9 | 0 |
| D | 0 | 9 | 0 |
| Quadrant | Total seconds | Saturated seconds | Saturation percentage |
|---|---|---|---|
| A | 3599 | 62 | 1.722701% |
| B | 3599 | 103 | 2.861906% |
| C | 3599 | 49 | 1.361489% |
| D | 3599 | 91 | 2.528480% |
Noise dominated data is calculated using 1-second bins in cleaned event files. If a bin has >2000 counts, and if more than 50% of those come from <1% of pixels, then it is considered to be noise-dominated and hence unusable.
| Quadrant | # 1 sec bins | Bins with >0 counts | Bins with >2000 counts | High rate bins dominated by noise | Noise dominated (total time) | Noise dominated (detector-on time) | Marked lightcurve |
|---|---|---|---|---|---|---|---|
| A | 4440 | 3600 | 0 | 0 | 0.00% | 0.00% | 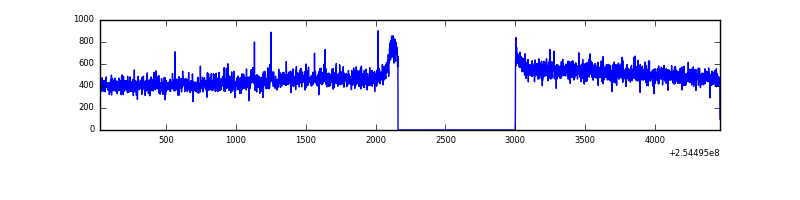 |
| B | 4440 | 3600 | 34 | 34 | 0.77% | 0.94% | 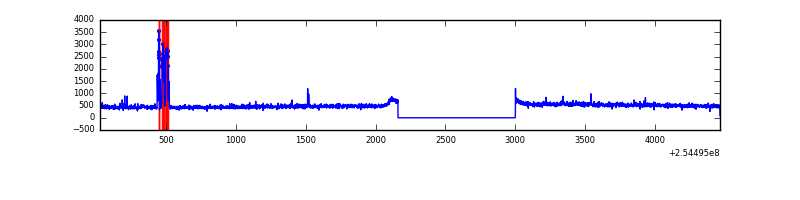 |
| C | 4440 | 3600 | 2 | 2 | 0.05% | 0.06% | 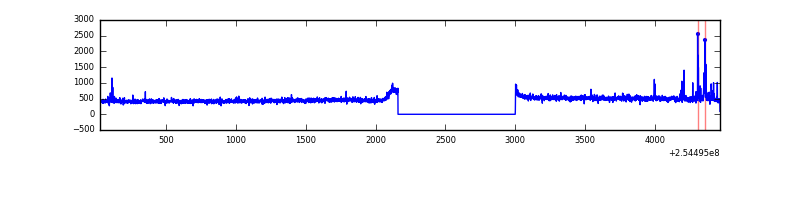 |
| D | 4440 | 3600 | 44 | 44 | 0.99% | 1.22% | 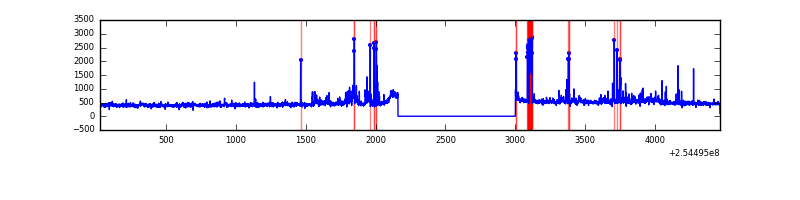 |
Top three noisy pixels from each quadrant. If the there are fewer than three noisy pixels in the level2.evt file, extra rows are filled as -1
| Pixel properties | Quadrant properties | ||||||
|---|---|---|---|---|---|---|---|
| Quadrant | DetID | PixID | Counts | Sigma | Mean | Median | Sigma |
| A | 12 | 189 | 4701 | 46.4 | 441 | 431 | 92.0 |
| A | 1 | 162 | 4534 | 44.58 | 441 | 431 | 92.0 |
| A | 0 | 226 | 3892 | 37.61 | 441 | 431 | 92.0 |
| B | 3 | 64 | 120111 | 1380.16 | 440 | 429 | 86.7 |
| B | 0 | 214 | 10395 | 114.93 | 440 | 429 | 86.7 |
| B | 12 | 111 | 9856 | 108.71 | 440 | 429 | 86.7 |
| C | 15 | 208 | 42890 | 424.28 | 426 | 427 | 100.1 |
| C | 14 | 67 | 3076 | 26.47 | 426 | 427 | 100.1 |
| C | 13 | 61 | 3074 | 26.45 | 426 | 427 | 100.1 |
| D | 1 | 52 | 216365 | 2091.23 | 423 | 409 | 103.3 |
| D | 13 | 249 | 20797 | 197.43 | 423 | 409 | 103.3 |
| D | 2 | 234 | 13571 | 127.46 | 423 | 409 | 103.3 |
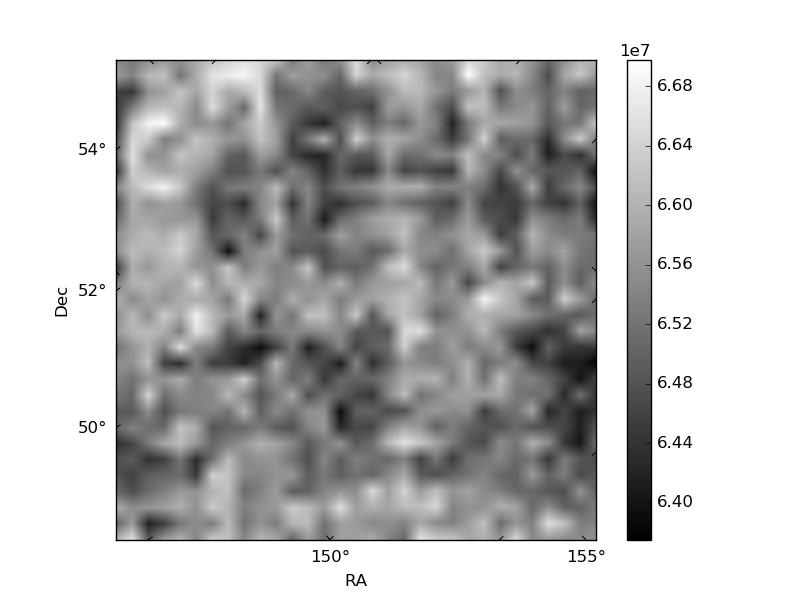
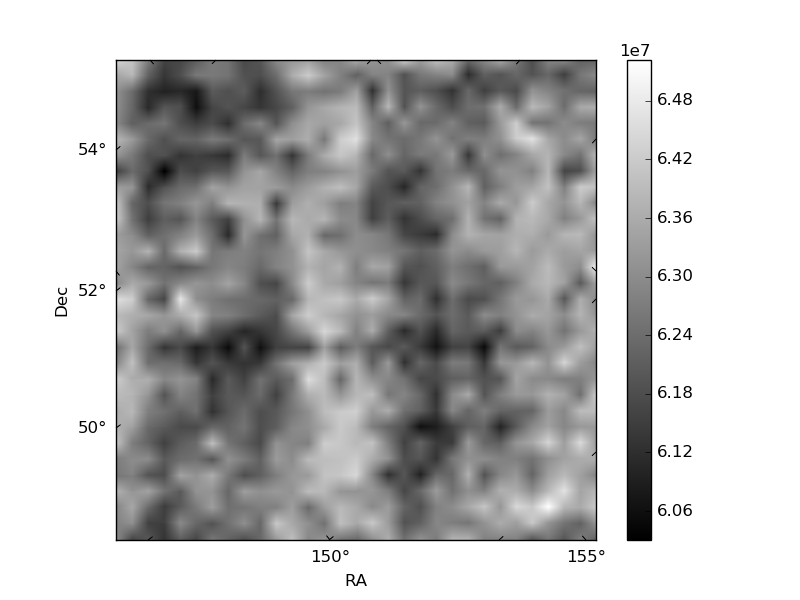
Histogram calculated using DETX and DETY for each event in the final _common_clean file
| Quadrant A |  |
 |
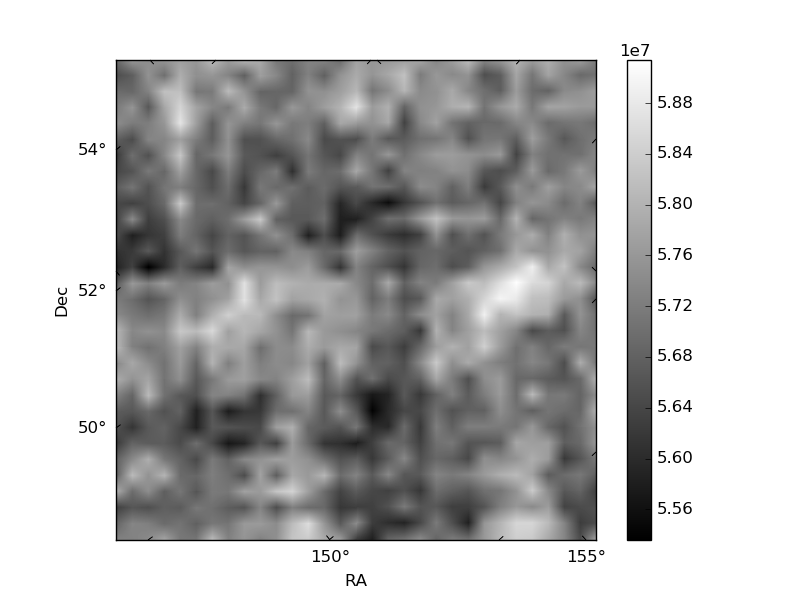
Quadrant B |
|---|---|---|---|
| Quadrant D |  |
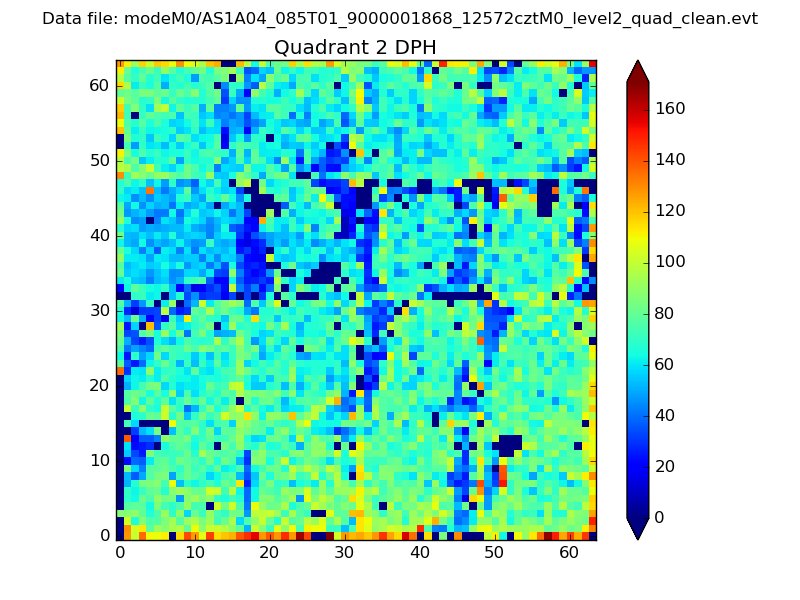 |
Quadrant C |
| Plot type | Count rate plots | Images |
|---|---|---|
| Comparison with Poisson distribution Blue bars denote a histogram of data divided into 1 sec bins. Red curve is a Poisson curve with rate = median count rate of data. |
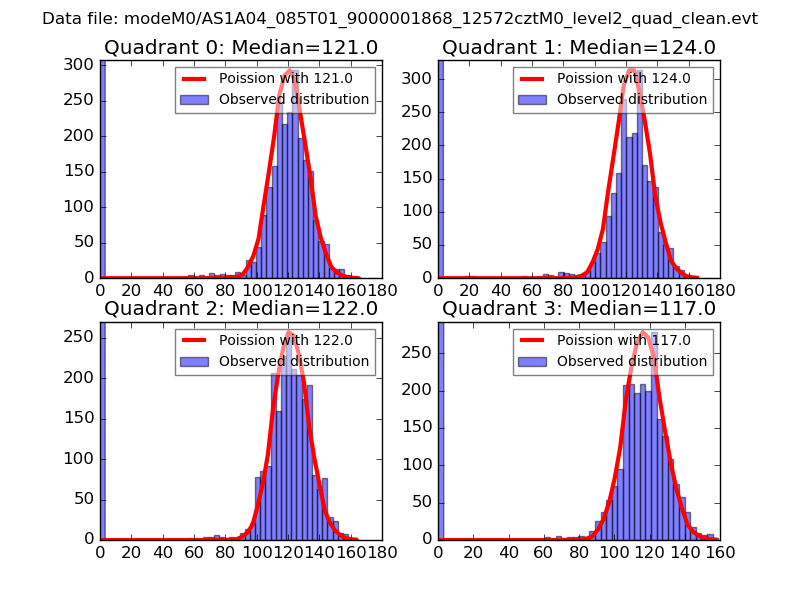 |
 |
| Quadrant-wise count rates Data is divided into 100 sec bins |
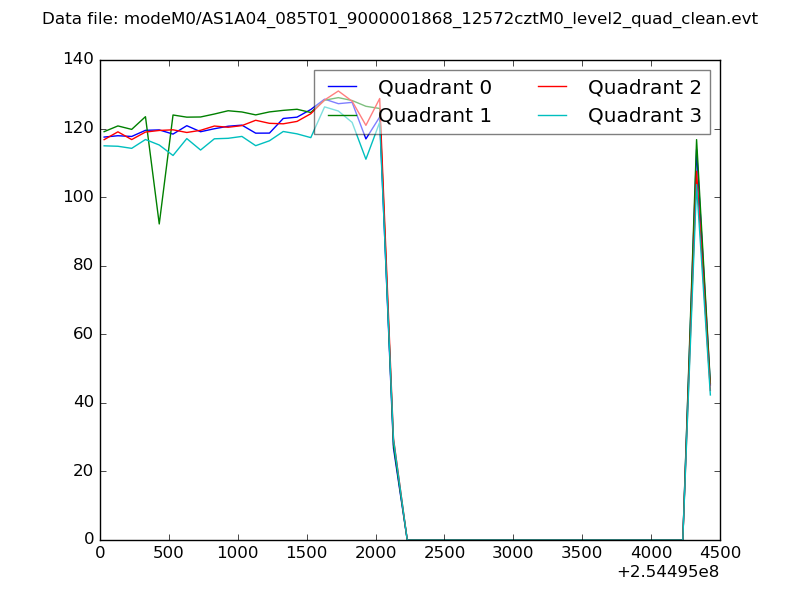 |
|
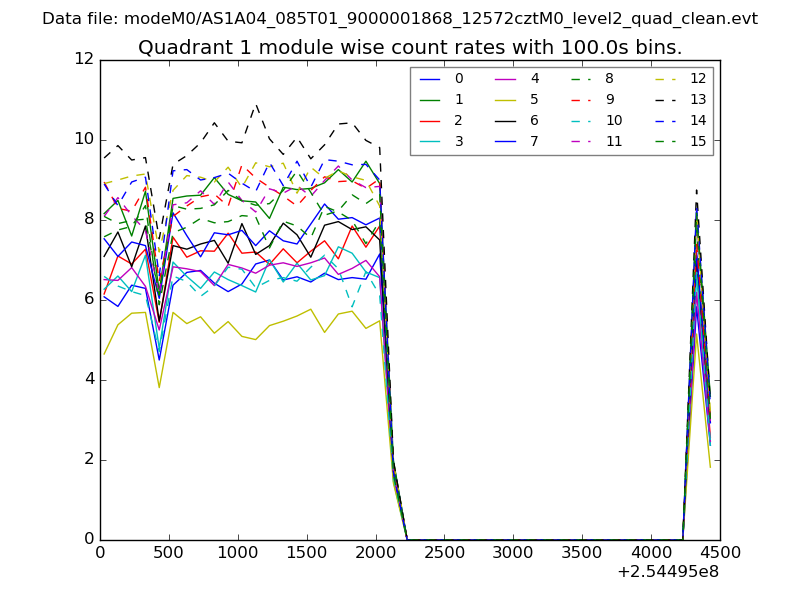
| Module-wise count rates for Quadrant A Data is divided into 100 sec bins |
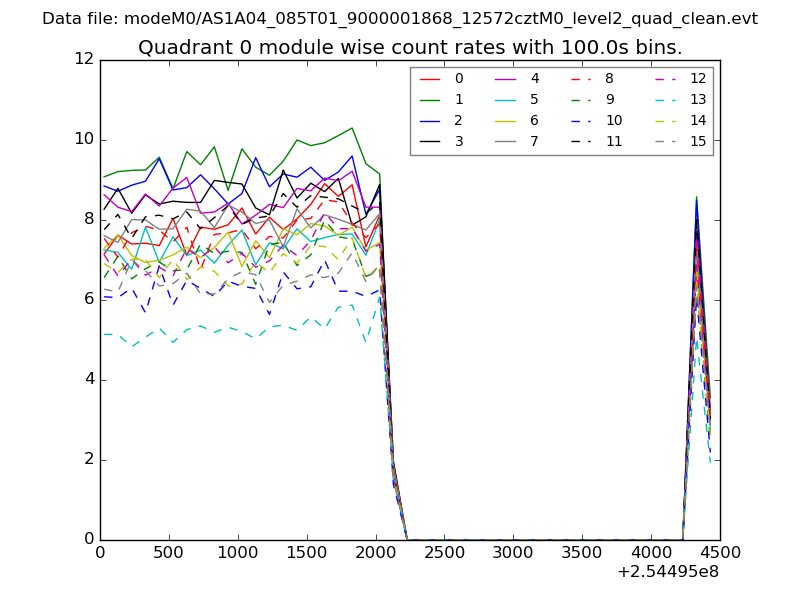 |
 |
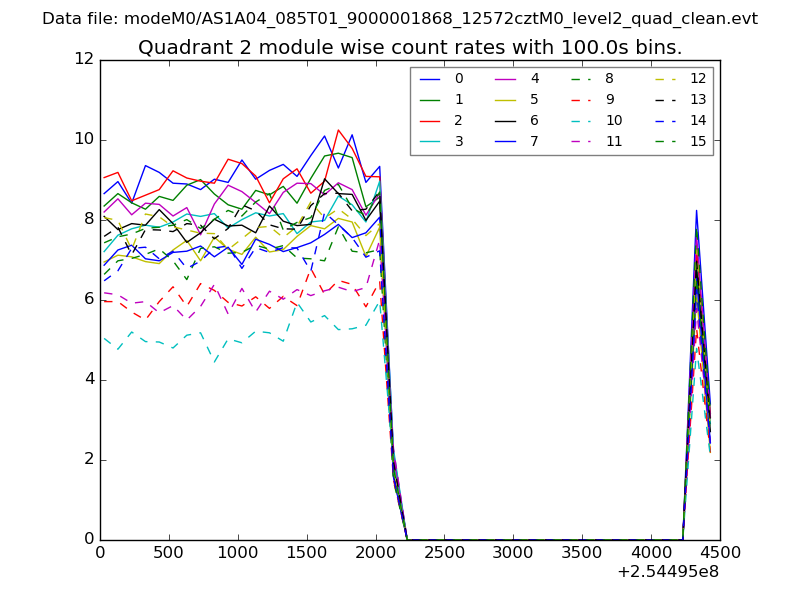
| Module-wise count rates for Quadrant B Data is divided into 100 sec bins |
 |
 |
| Module-wise count rates for Quadrant C Data is divided into 100 sec bins |
 |
 |
| Module-wise count rates for Quadrant D Data is divided into 100 sec bins |
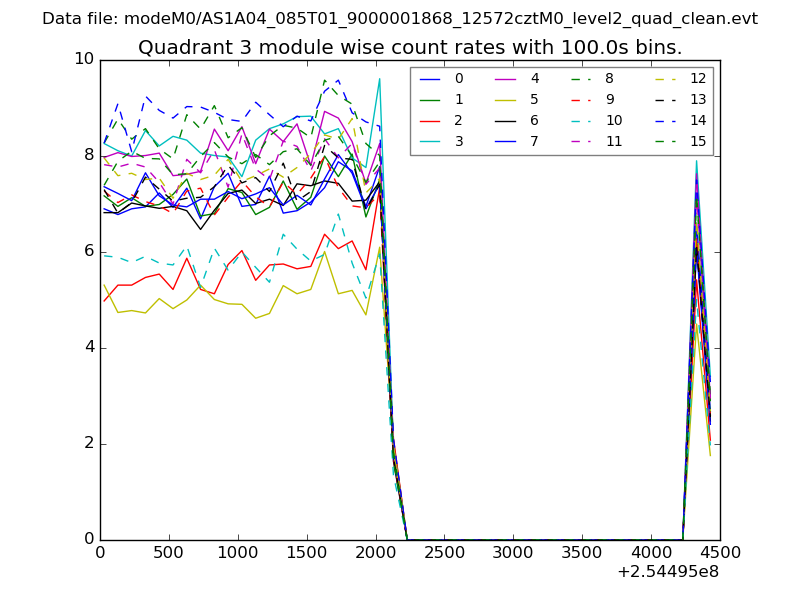 |
 |
| Parameter | Plot |
|---|---|
| CZT HV Monitor | 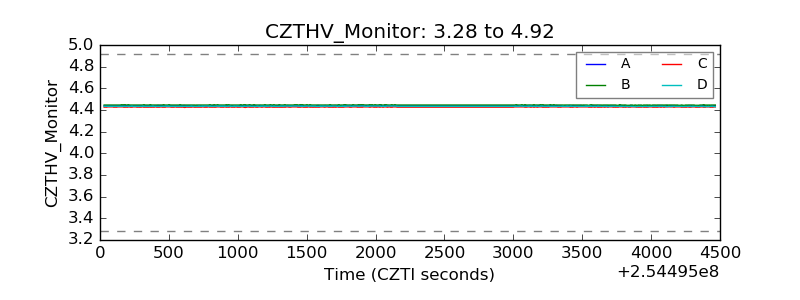 |
| D_VDD | 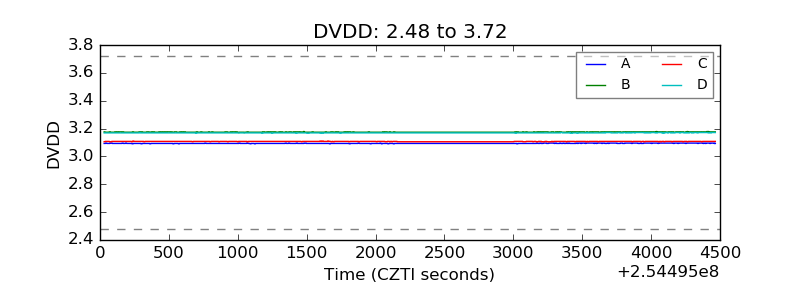 |
| Temperature 1 | 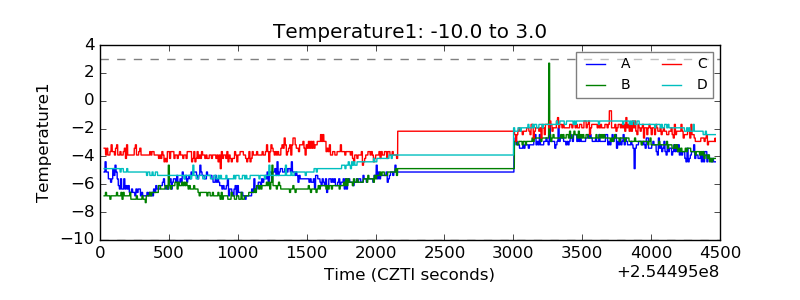 |
| Veto HV Monitor |  |
| Veto LLD | 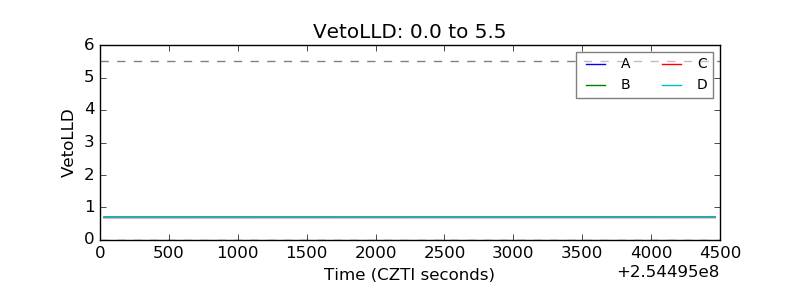 |
| Alpha Counter | 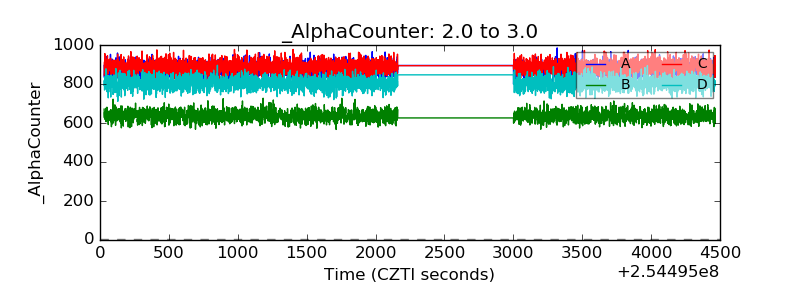 |
| _CPM_Rate | 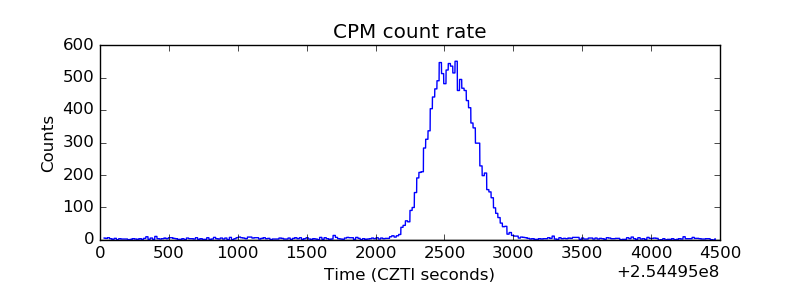 |
| CZT Counter | 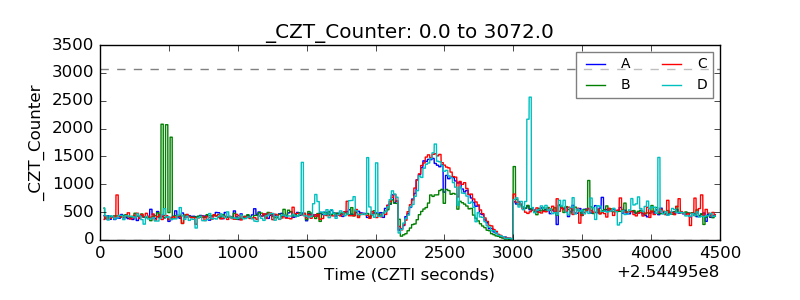 |
| +2.5 Volts monitor |  |
| +5 Volts monitor |  |
| _ROLL_ROT | 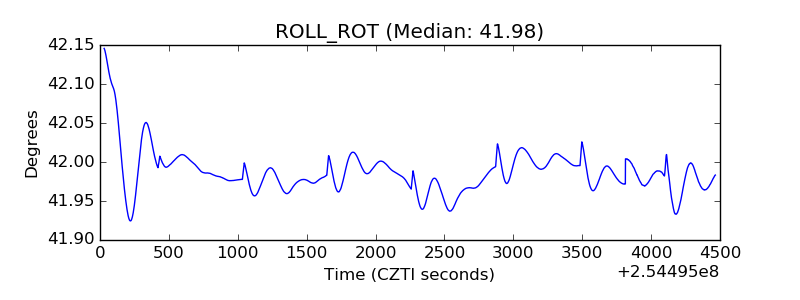 |
| _Roll_DEC | 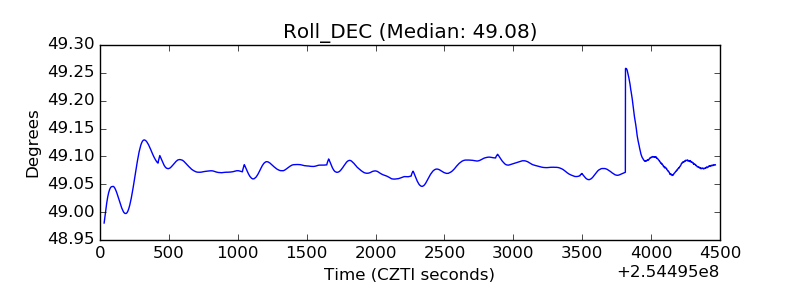 |
| _Roll_RA |  |
| Veto Counter | 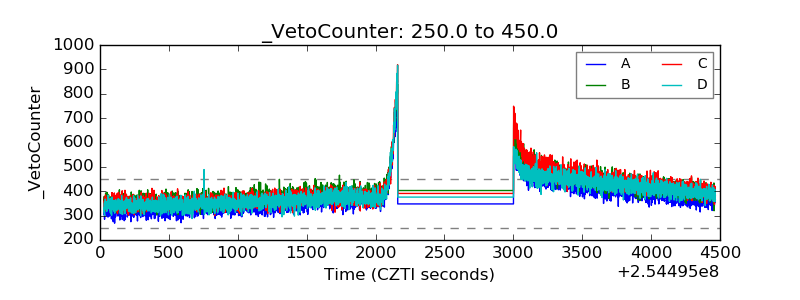 |