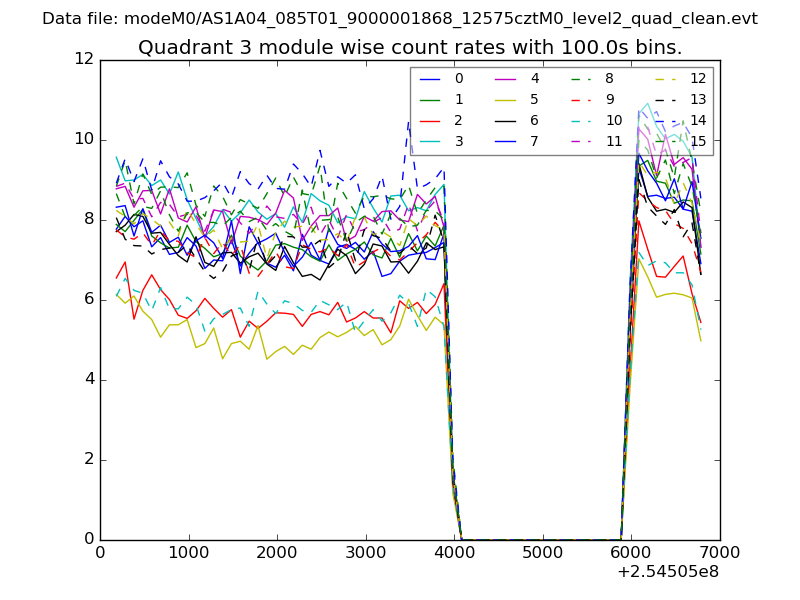
| Param | Original file | Final file |
|---|---|---|
| Filename | modeM0/AS1A04_085T01_9000001868_12575cztM0_level2.evt | modeM0/AS1A04_085T01_9000001868_12575cztM0_level2_quad_clean.evt |
| Size (bytes) | 440,922,240 | 93,188,160 |
| Size | 420.5 MB | 88.9 MB |
| Events in quadrant A | 3,094,454 | 593,044 |
| Events in quadrant B | 3,254,058 | 614,527 |
| Events in quadrant C | 3,197,854 | 595,339 |
| Events in quadrant D | 3,370,076 | 570,915 |
| Mode SS | |||
|---|---|---|---|
| Quadrant | BADHDUFLAG | Total packets | Discarded packets |
| A | 0 | 132 | 0 |
| B | 0 | 132 | 0 |
| C | 0 | 132 | 0 |
| D | 0 | 132 | 0 |
| Mode M0 | |||
|---|---|---|---|
| Quadrant | BADHDUFLAG | Total packets | Discarded packets |
| A | 0 | 13596 | 3 |
| B | 0 | 14019 | 2 |
| C | 0 | 13908 | 2 |
| D | 0 | 14341 | 2 |
| Mode M9 | |||
|---|---|---|---|
| Quadrant | BADHDUFLAG | Total packets | Discarded packets |
| A | 0 | 15 | 0 |
| B | 0 | 15 | 0 |
| C | 0 | 15 | 0 |
| D | 0 | 16 | 0 |
| Quadrant | Total seconds | Saturated seconds | Saturation percentage |
|---|---|---|---|
| A | 6421 | 41 | 0.638530% |
| B | 6421 | 66 | 1.027877% |
| C | 6421 | 55 | 0.856564% |
| D | 6421 | 65 | 1.012303% |
Noise dominated data is calculated using 1-second bins in cleaned event files. If a bin has >2000 counts, and if more than 50% of those come from <1% of pixels, then it is considered to be noise-dominated and hence unusable.
| Quadrant | # 1 sec bins | Bins with >0 counts | Bins with >2000 counts | High rate bins dominated by noise | Noise dominated (total time) | Noise dominated (detector-on time) | Marked lightcurve |
|---|---|---|---|---|---|---|---|
| A | 7577 | 6422 | 0 | 0 | 0.00% | 0.00% | 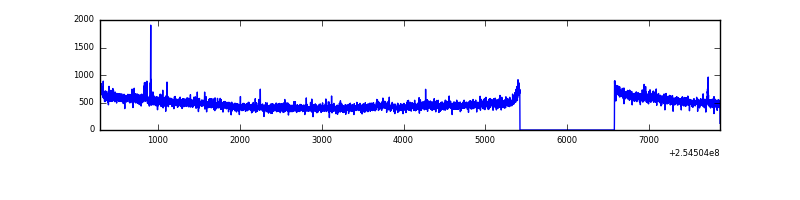 |
| B | 7577 | 6422 | 3 | 3 | 0.04% | 0.05% | 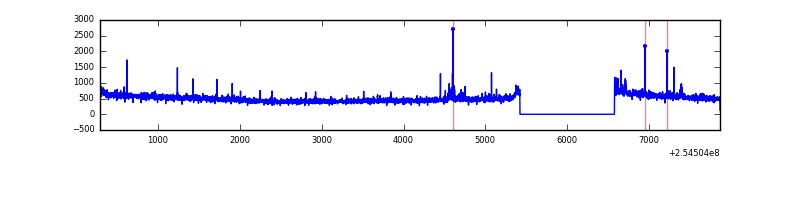 |
| C | 7577 | 6422 | 20 | 20 | 0.26% | 0.31% | 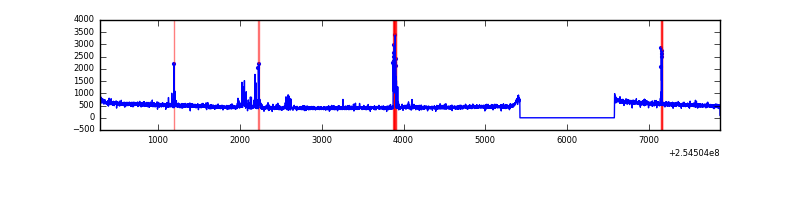 |
| D | 7577 | 6422 | 25 | 25 | 0.33% | 0.39% | 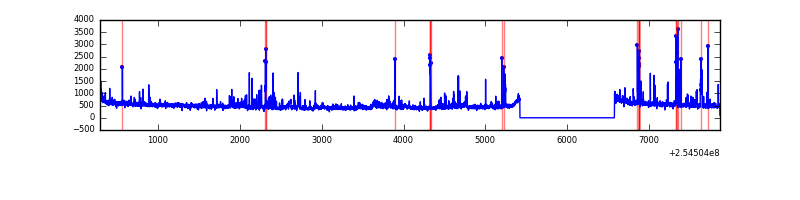 |
Top three noisy pixels from each quadrant. If the there are fewer than three noisy pixels in the level2.evt file, extra rows are filled as -1
| Pixel properties | Quadrant properties | ||||||
|---|---|---|---|---|---|---|---|
| Quadrant | DetID | PixID | Counts | Sigma | Mean | Median | Sigma |
| A | 12 | 189 | 19637 | 117.52 | 793 | 778 | 160.5 |
| A | 12 | 96 | 12521 | 73.18 | 793 | 778 | 160.5 |
| A | 0 | 226 | 6992 | 38.72 | 793 | 778 | 160.5 |
| B | 3 | 64 | 47627 | 308.84 | 805 | 785 | 151.7 |
| B | 3 | 209 | 36562 | 235.89 | 805 | 785 | 151.7 |
| B | 12 | 111 | 16937 | 106.49 | 805 | 785 | 151.7 |
| C | 15 | 208 | 115634 | 636.07 | 782 | 787 | 180.6 |
| C | 14 | 234 | 28193 | 151.78 | 782 | 787 | 180.6 |
| C | 13 | 61 | 5851 | 28.05 | 782 | 787 | 180.6 |
| D | 1 | 52 | 265440 | 1434.2 | 777 | 753 | 184.6 |
| D | 10 | 157 | 49392 | 263.55 | 777 | 753 | 184.6 |
| D | 13 | 249 | 32746 | 173.35 | 777 | 753 | 184.6 |
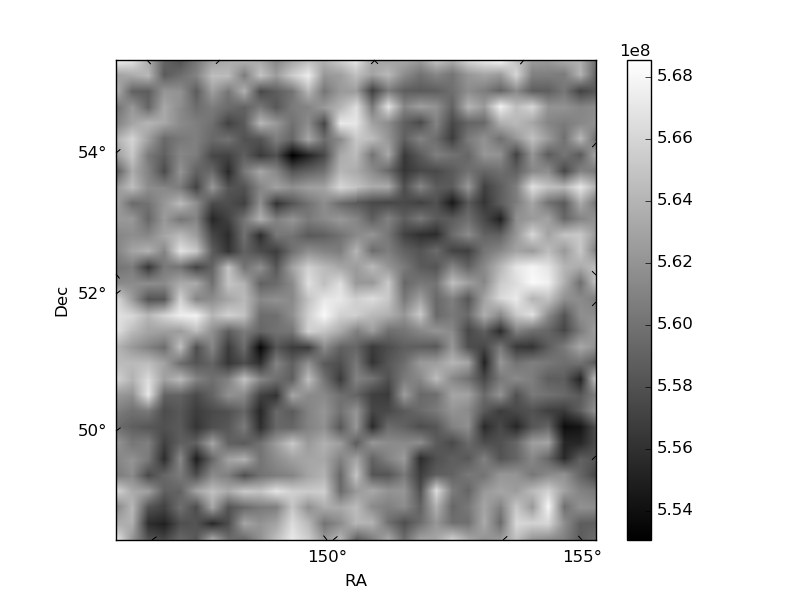
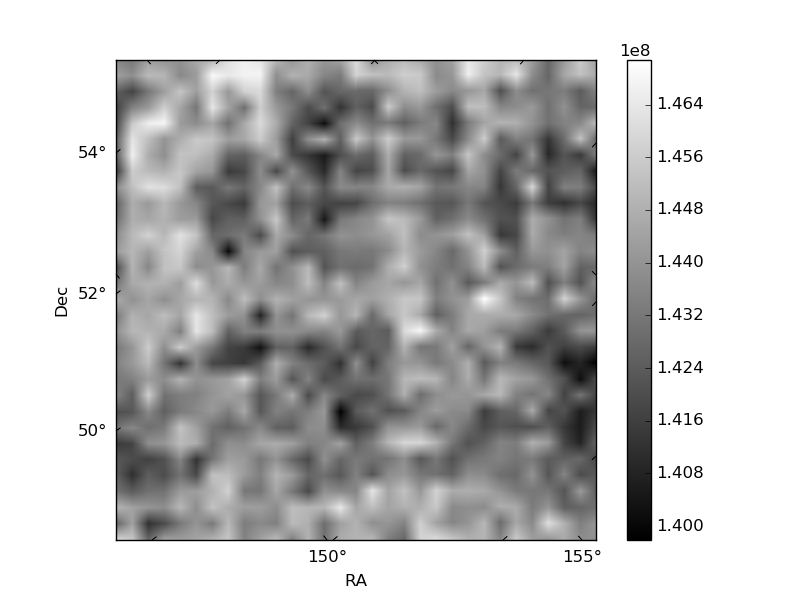
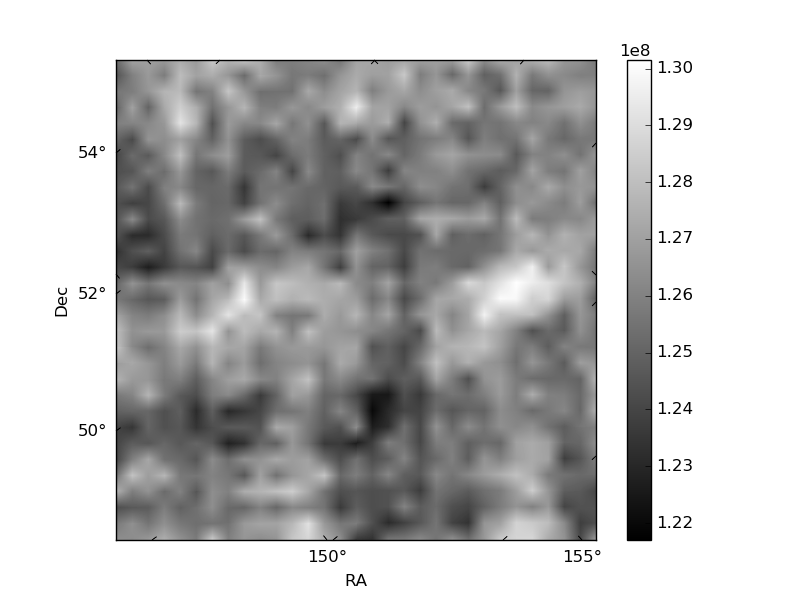
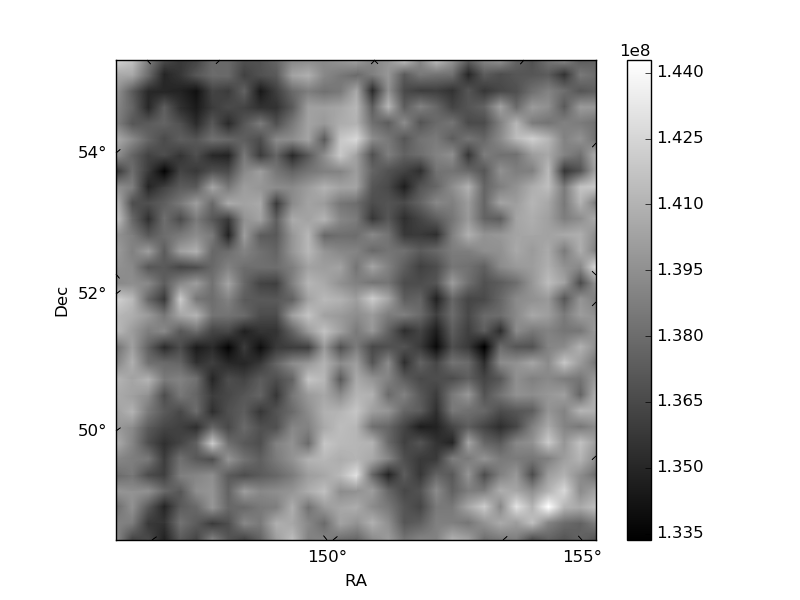
Histogram calculated using DETX and DETY for each event in the final _common_clean file
| Quadrant A | 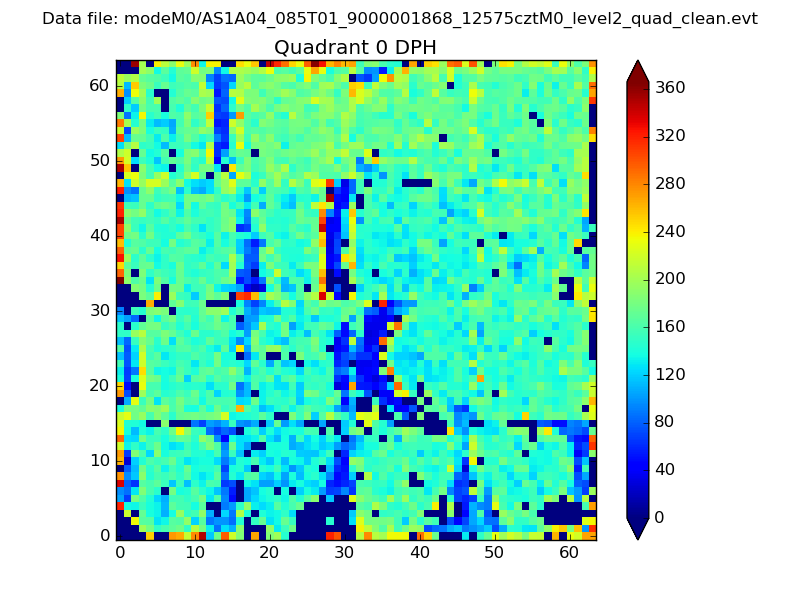 |
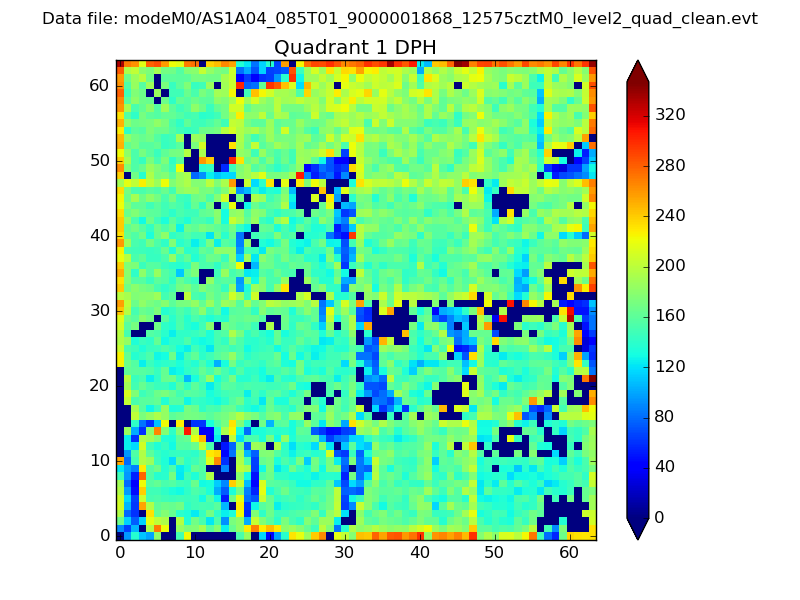 |
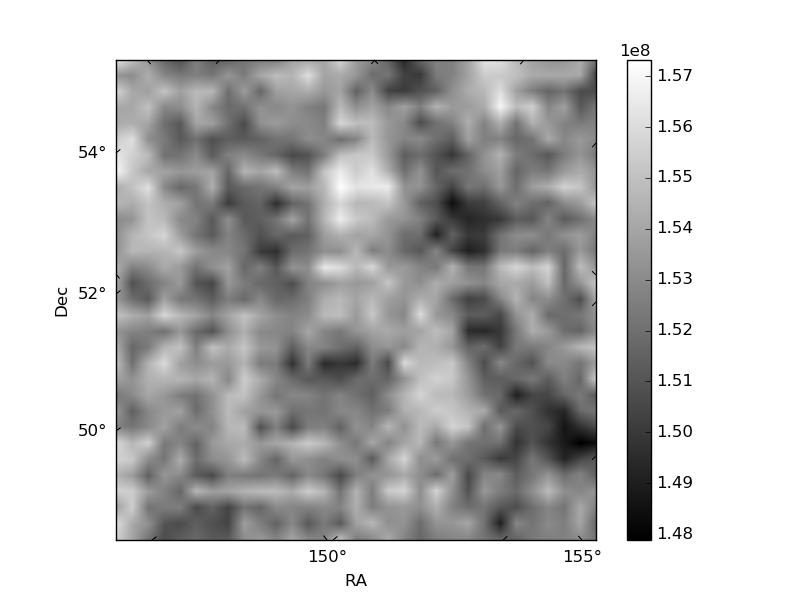
Quadrant B |
|---|---|---|---|
| Quadrant D | 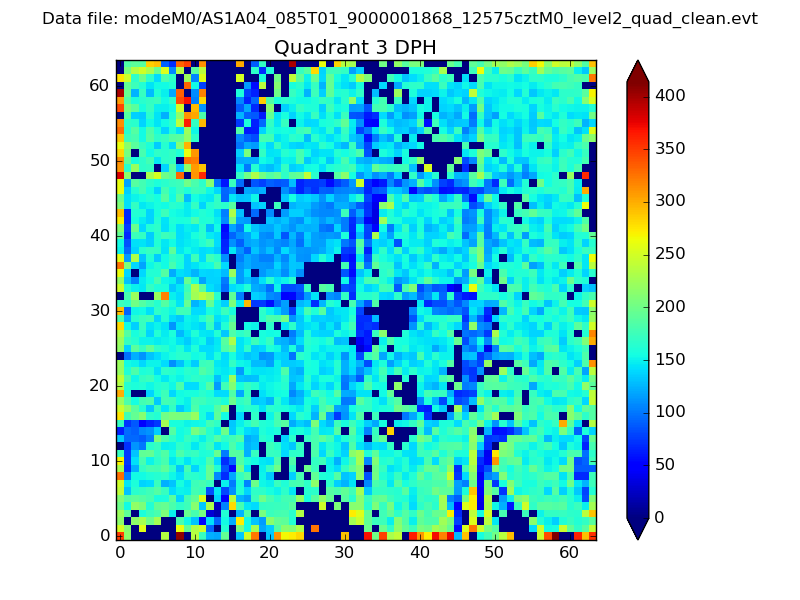 |
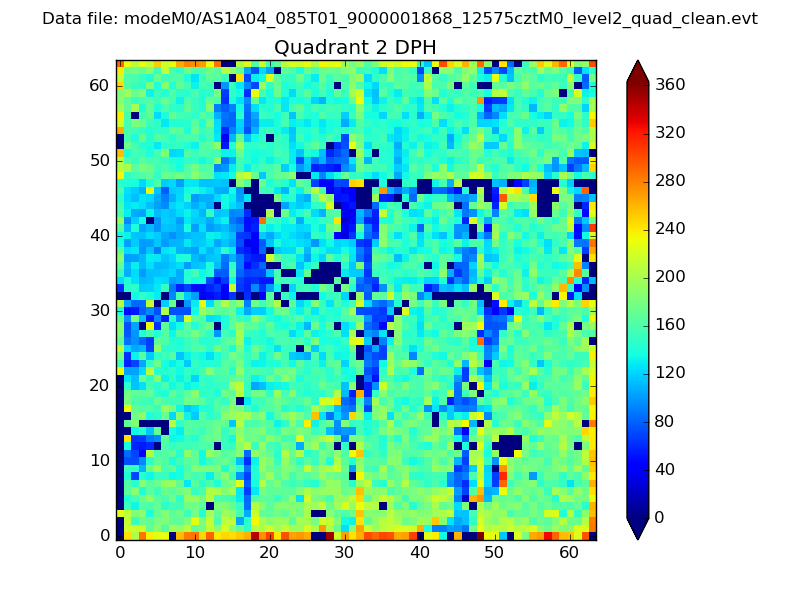 |
Quadrant C |
| Plot type | Count rate plots | Images |
|---|---|---|
| Comparison with Poisson distribution Blue bars denote a histogram of data divided into 1 sec bins. Red curve is a Poisson curve with rate = median count rate of data. |
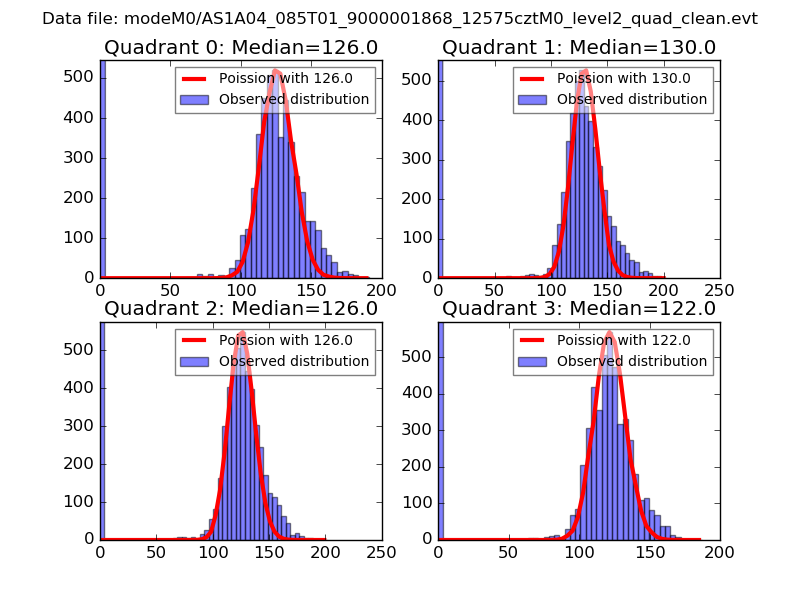 |
 |
| Quadrant-wise count rates Data is divided into 100 sec bins |
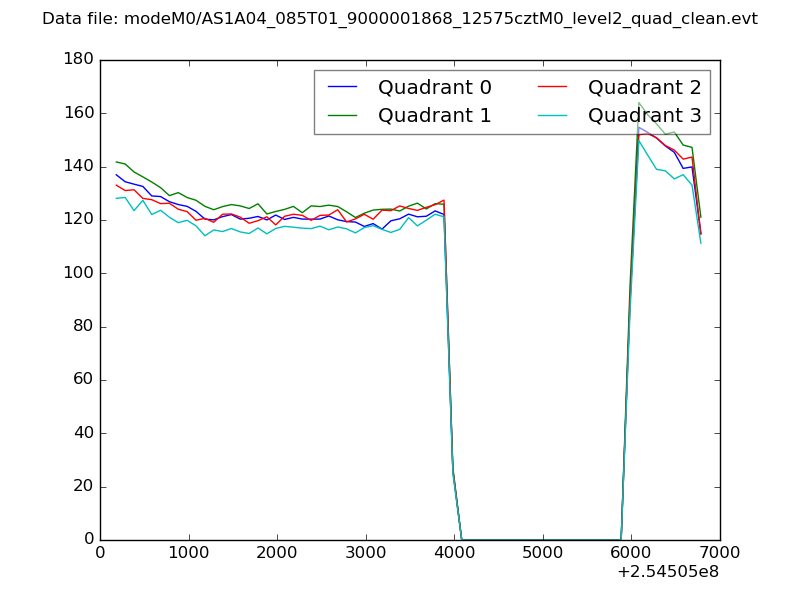 |
|
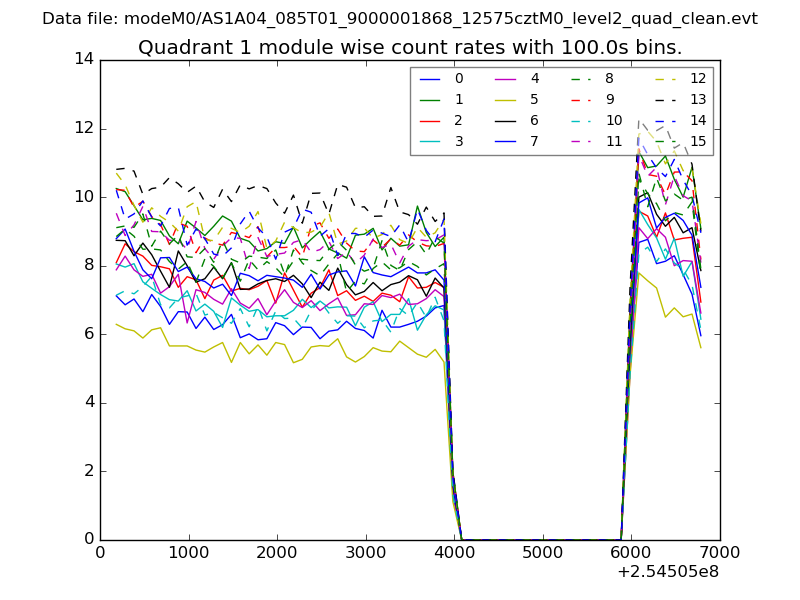
| Module-wise count rates for Quadrant A Data is divided into 100 sec bins |
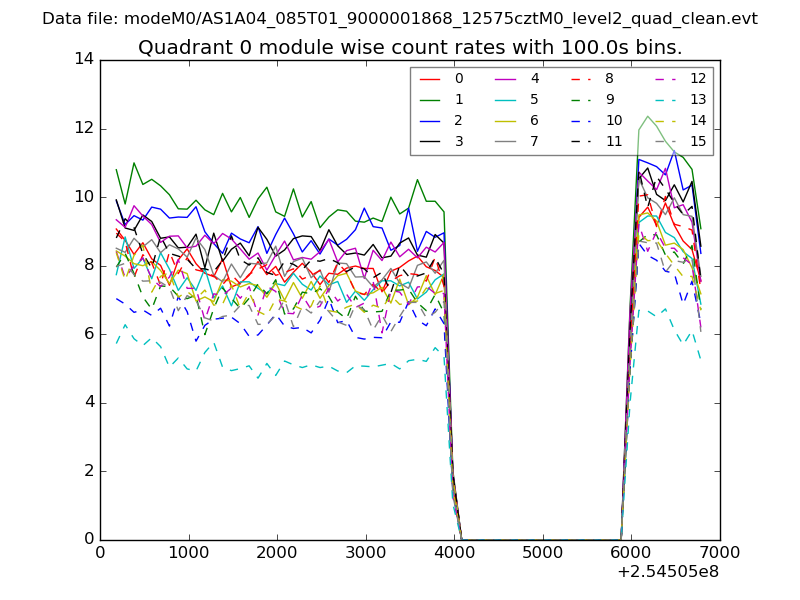 |
 |
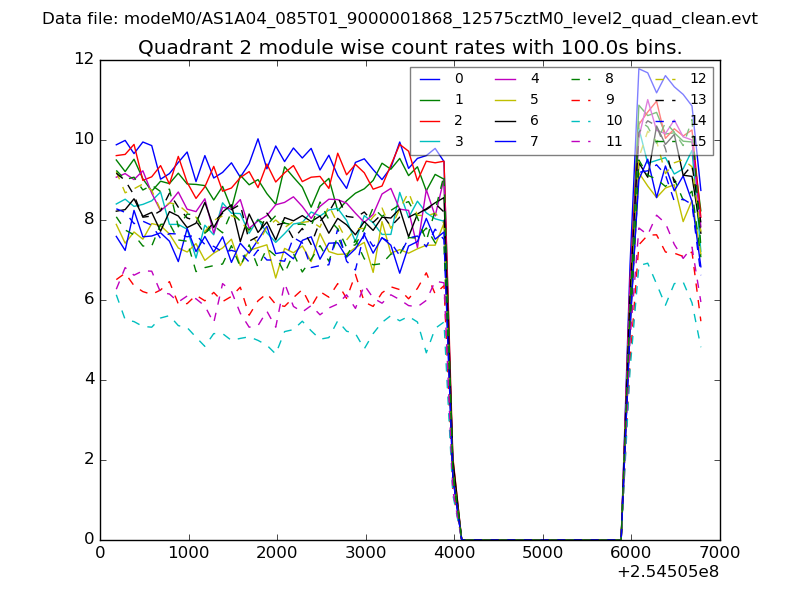
| Module-wise count rates for Quadrant B Data is divided into 100 sec bins |
 |
 |
| Module-wise count rates for Quadrant C Data is divided into 100 sec bins |
 |
 |
| Module-wise count rates for Quadrant D Data is divided into 100 sec bins |
 |
 |
| Parameter | Plot |
|---|---|
| CZT HV Monitor | 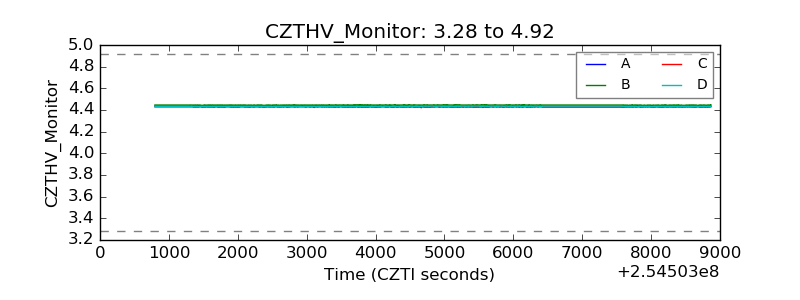 |
| D_VDD | 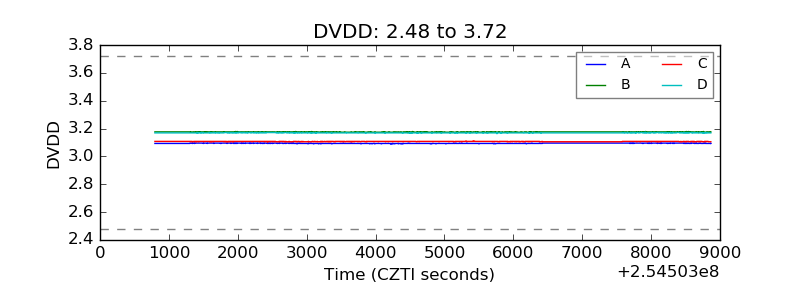 |
| Temperature 1 | 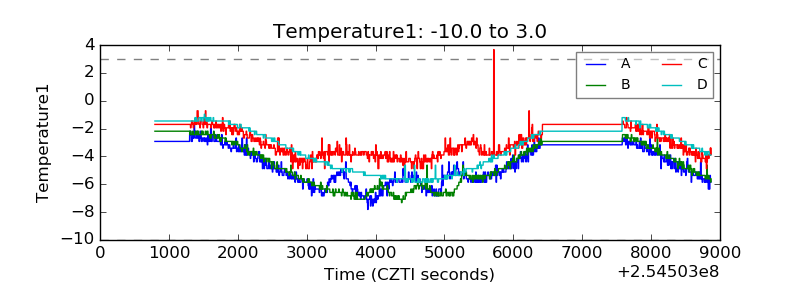 |
| Veto HV Monitor |  |
| Veto LLD | 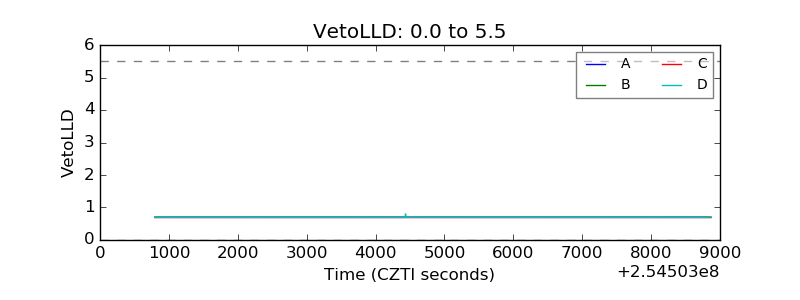 |
| Alpha Counter | 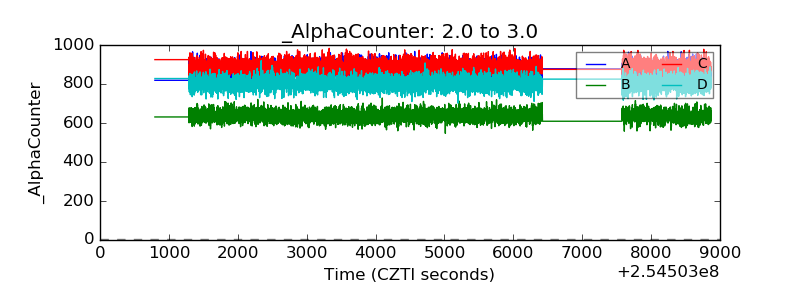 |
| _CPM_Rate | 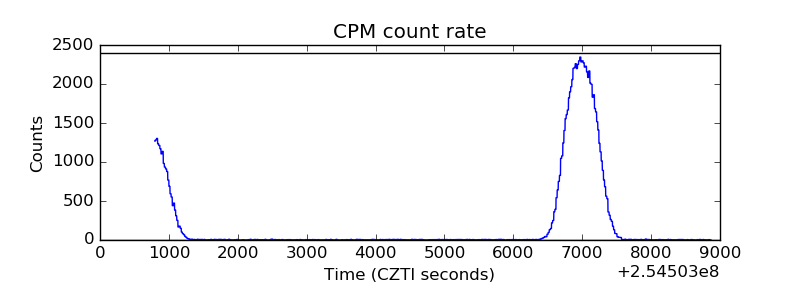 |
| CZT Counter | 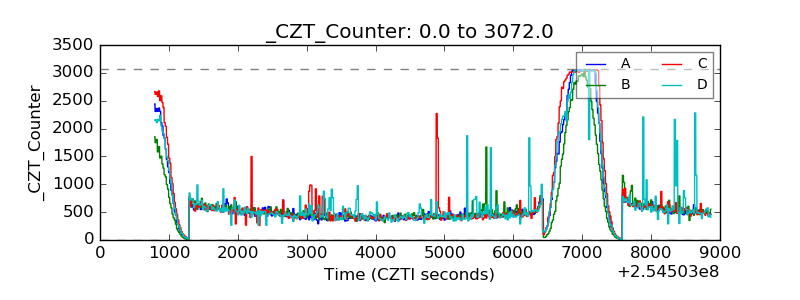 |
| +2.5 Volts monitor |  |
| +5 Volts monitor |  |
| _ROLL_ROT | 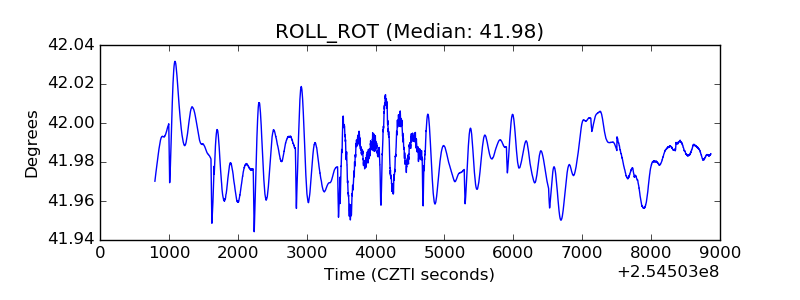 |
| _Roll_DEC | 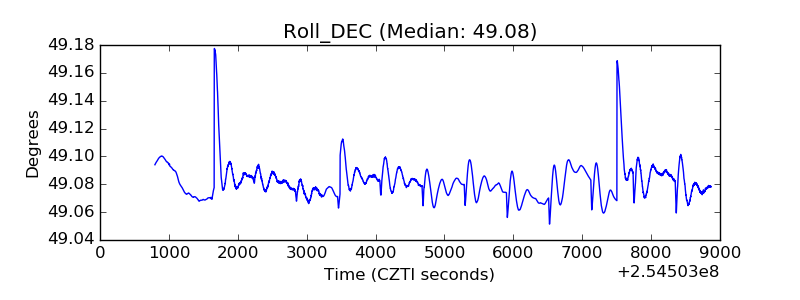 |
| _Roll_RA | 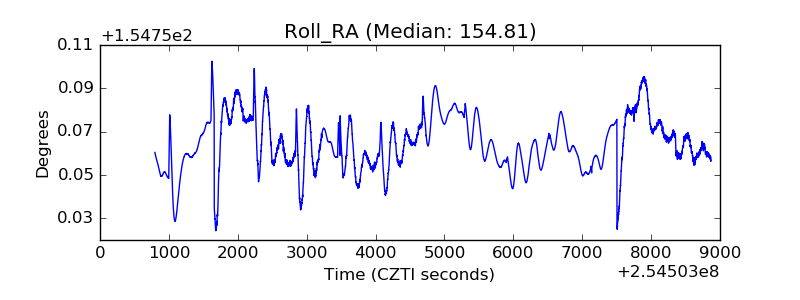 |
| Veto Counter | 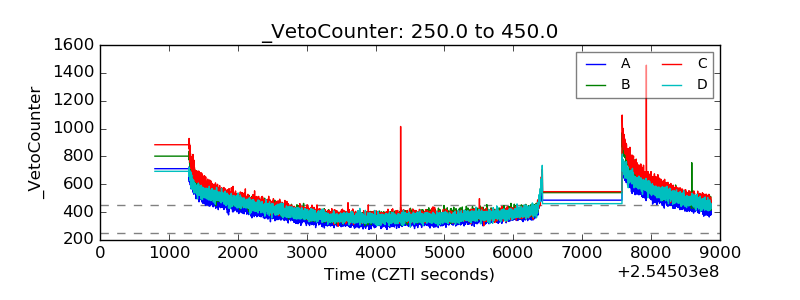 |