| Param | Original file | Final file |
|---|---|---|
| Filename | modeM0/AS1A04_130T04_9000001872_12579cztM0_level2.evt | modeM0/AS1A04_130T04_9000001872_12579cztM0_level2_quad_clean.evt |
| Size (bytes) | 266,898,240 | 43,804,800 |
| Size | 254.5 MB | 41.8 MB |
| Events in quadrant A | 1,850,376 | 263,500 |
| Events in quadrant B | 2,125,506 | 271,822 |
| Events in quadrant C | 1,910,305 | 269,088 |
| Events in quadrant D | 1,936,847 | 252,885 |
| Mode M0 | |||
|---|---|---|---|
| Quadrant | BADHDUFLAG | Total packets | Discarded packets |
| A | 0 | 7979 | 2 |
| B | 0 | 8773 | 1 |
| C | 0 | 8220 | 1 |
| D | 0 | 8366 | 1 |
| Mode SS | |||
|---|---|---|---|
| Quadrant | BADHDUFLAG | Total packets | Discarded packets |
| A | 0 | 78 | 0 |
| B | 0 | 78 | 0 |
| C | 0 | 78 | 0 |
| D | 0 | 78 | 0 |
| Mode M9 | |||
|---|---|---|---|
| Quadrant | BADHDUFLAG | Total packets | Discarded packets |
| A | 0 | 13 | 0 |
| B | 0 | 13 | 0 |
| C | 0 | 13 | 0 |
| D | 0 | 13 | 0 |
| Quadrant | Total seconds | Saturated seconds | Saturation percentage |
|---|---|---|---|
| A | 3802 | 43 | 1.130984% |
| B | 3802 | 120 | 3.156234% |
| C | 3802 | 43 | 1.130984% |
| D | 3802 | 53 | 1.394003% |
Noise dominated data is calculated using 1-second bins in cleaned event files. If a bin has >2000 counts, and if more than 50% of those come from <1% of pixels, then it is considered to be noise-dominated and hence unusable.
| Quadrant | # 1 sec bins | Bins with >0 counts | Bins with >2000 counts | High rate bins dominated by noise | Noise dominated (total time) | Noise dominated (detector-on time) | Marked lightcurve |
|---|---|---|---|---|---|---|---|
| A | 5082 | 3804 | 0 | 0 | 0.00% | 0.00% | 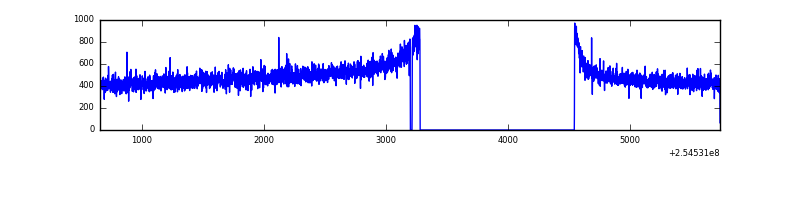 |
| B | 5082 | 3803 | 33 | 33 | 0.65% | 0.87% | 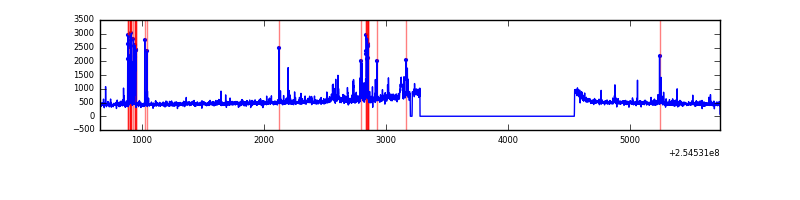 |
| C | 5082 | 3804 | 7 | 7 | 0.14% | 0.18% | 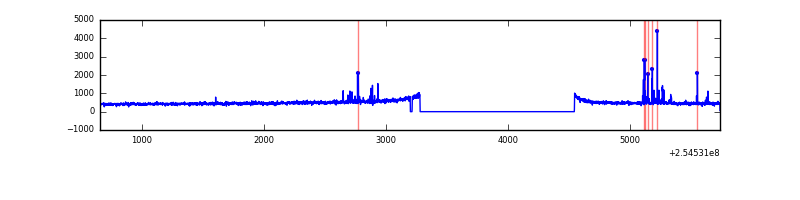 |
| D | 5082 | 3804 | 26 | 26 | 0.51% | 0.68% | 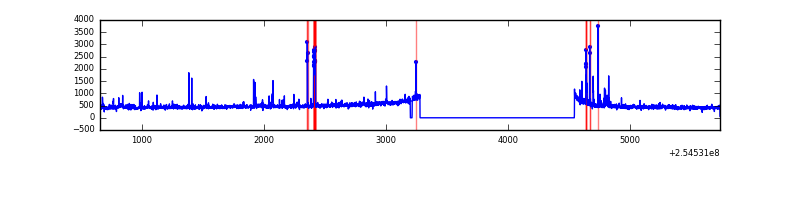 |
Top three noisy pixels from each quadrant. If the there are fewer than three noisy pixels in the level2.evt file, extra rows are filled as -1
| Pixel properties | Quadrant properties | ||||||
|---|---|---|---|---|---|---|---|
| Quadrant | DetID | PixID | Counts | Sigma | Mean | Median | Sigma |
| A | 12 | 189 | 7052 | 67.34 | 479 | 470 | 97.7 |
| A | 0 | 226 | 4256 | 38.74 | 479 | 470 | 97.7 |
| A | 12 | 194 | 3668 | 32.72 | 479 | 470 | 97.7 |
| B | 4 | 239 | 106524 | 1132.36 | 481 | 469 | 93.7 |
| B | 3 | 64 | 92422 | 981.79 | 481 | 469 | 93.7 |
| B | 11 | 51 | 23196 | 242.66 | 481 | 469 | 93.7 |
| C | 15 | 208 | 87912 | 801.67 | 466 | 468 | 109.1 |
| C | 13 | 61 | 3455 | 27.38 | 466 | 468 | 109.1 |
| C | 1 | 5 | 1987 | 13.93 | 466 | 468 | 109.1 |
| D | 1 | 52 | 65624 | 574.6 | 463 | 448 | 113.4 |
| D | 10 | 157 | 60570 | 530.04 | 463 | 448 | 113.4 |
| D | 13 | 249 | 37175 | 323.79 | 463 | 448 | 113.4 |
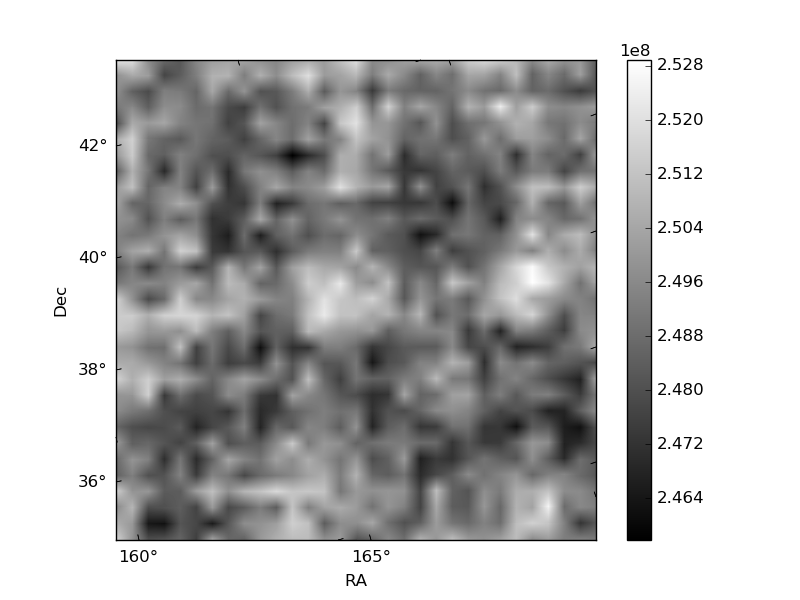
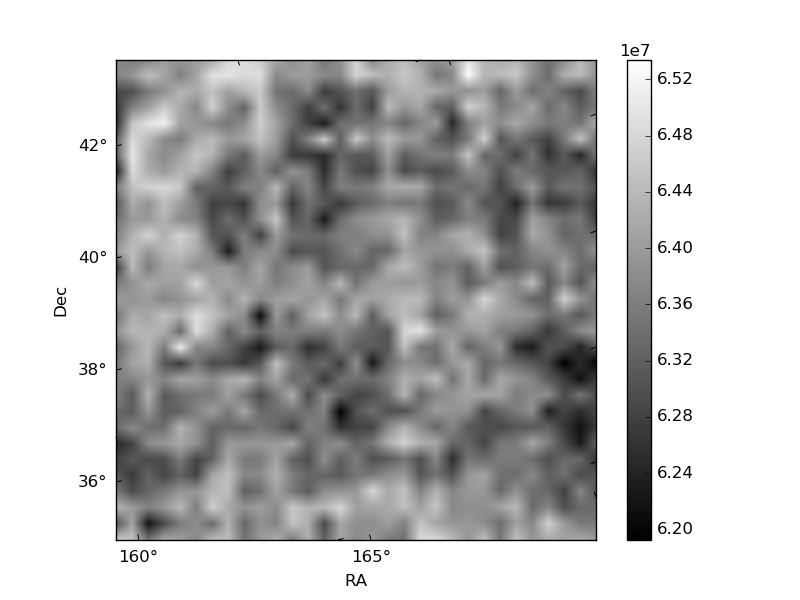
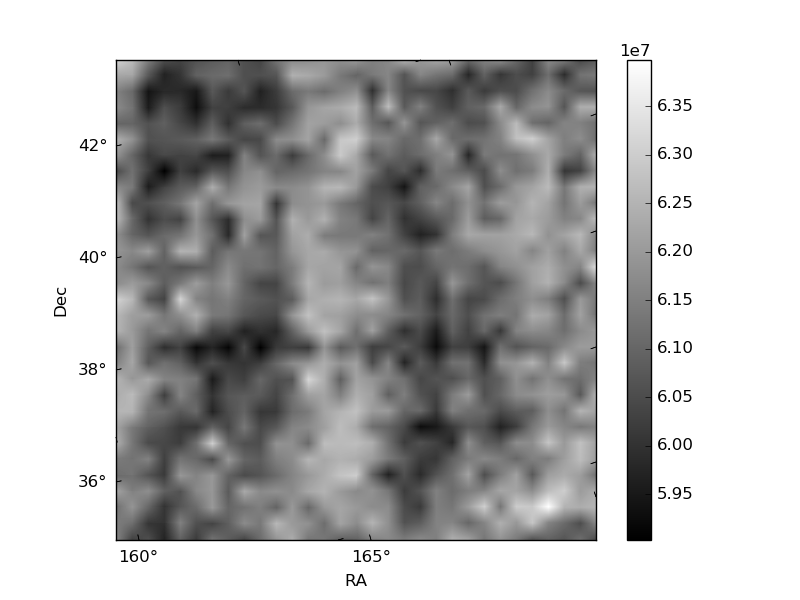
Histogram calculated using DETX and DETY for each event in the final _common_clean file
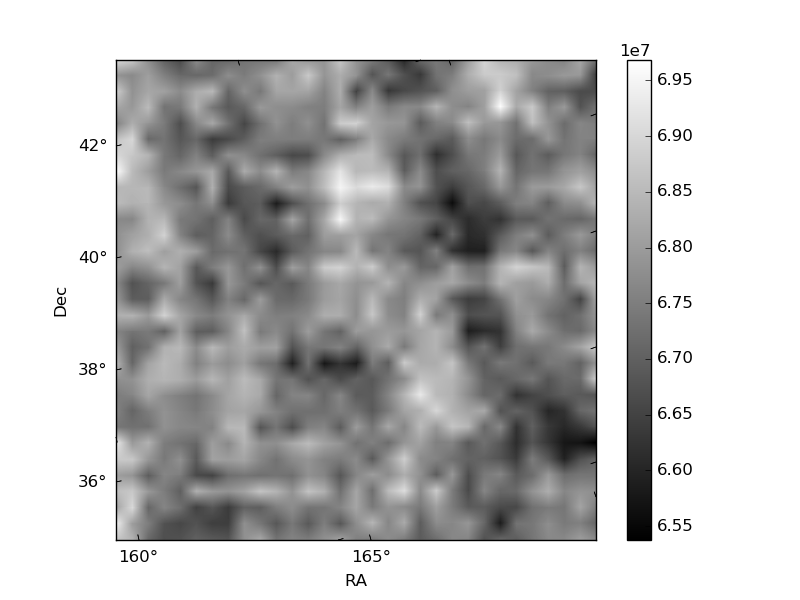
| Quadrant A | 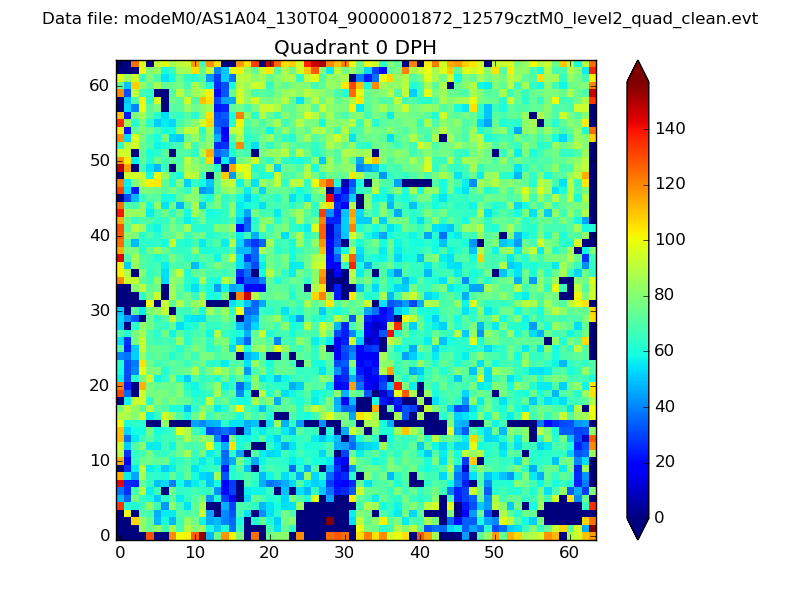 |
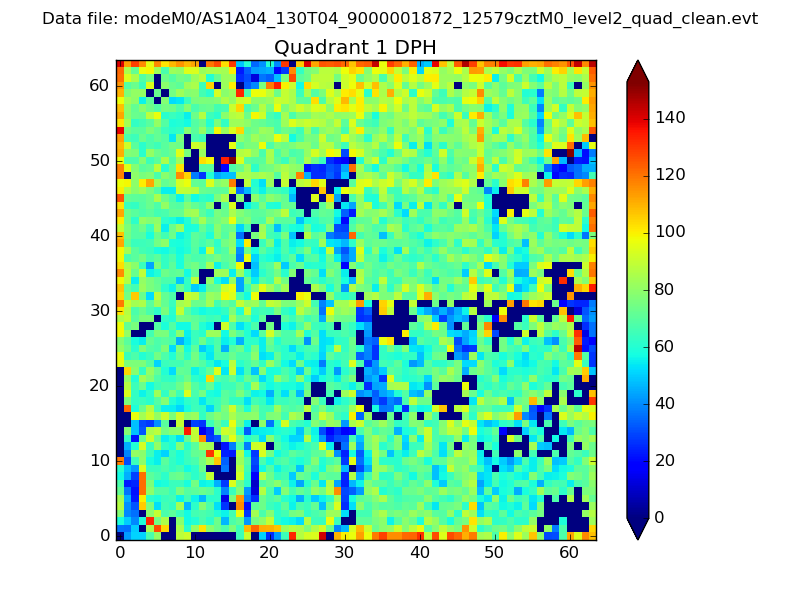 |
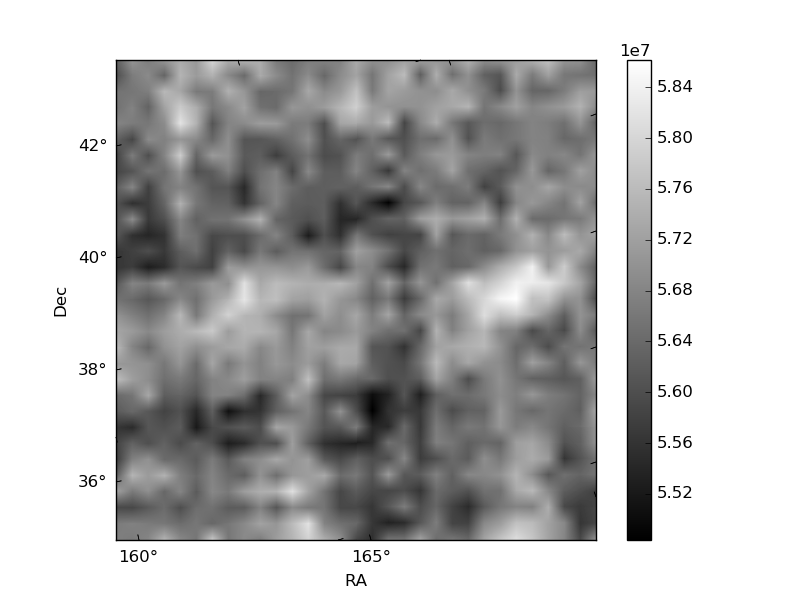
Quadrant B |
|---|---|---|---|
| Quadrant D | 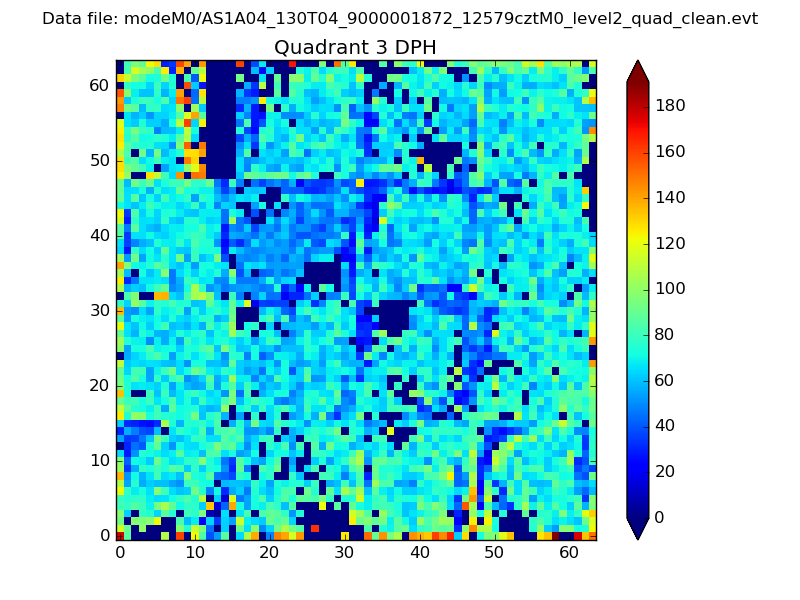 |
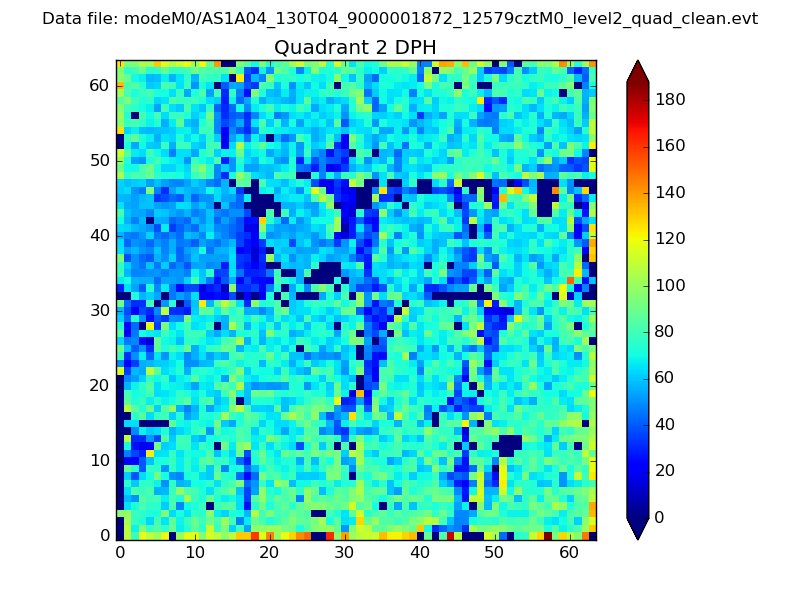 |
Quadrant C |
| Plot type | Count rate plots | Images |
|---|---|---|
| Comparison with Poisson distribution Blue bars denote a histogram of data divided into 1 sec bins. Red curve is a Poisson curve with rate = median count rate of data. |
 |
 |
| Quadrant-wise count rates Data is divided into 100 sec bins |
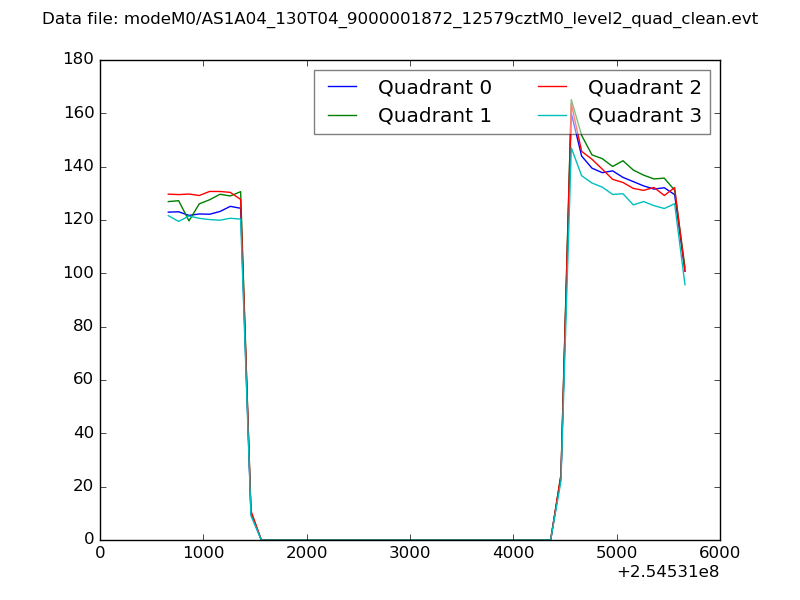 |
|
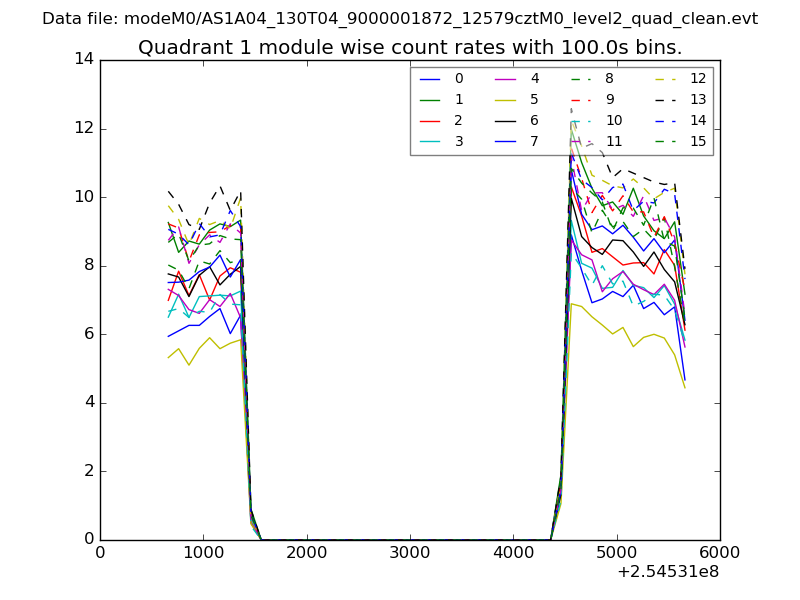
| Module-wise count rates for Quadrant A Data is divided into 100 sec bins |
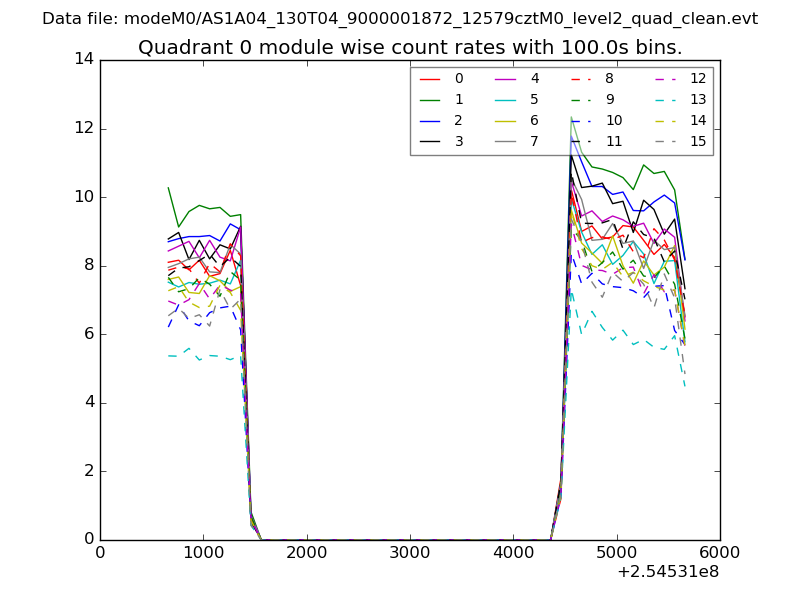 |
 |
| Module-wise count rates for Quadrant B Data is divided into 100 sec bins |
 |
 |
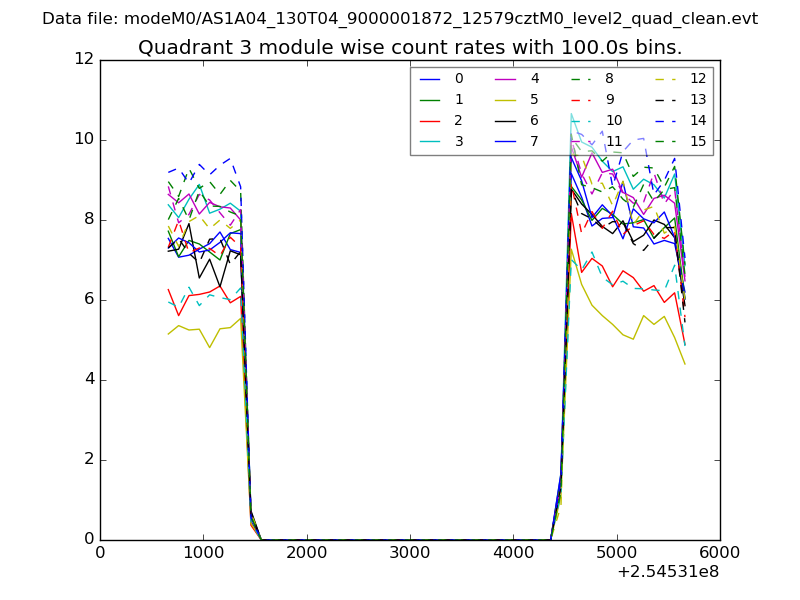
| Module-wise count rates for Quadrant C Data is divided into 100 sec bins |
 |
 |
| Module-wise count rates for Quadrant D Data is divided into 100 sec bins |
 |
 |
| Parameter | Plot |
|---|---|
| CZT HV Monitor |  |
| D_VDD | 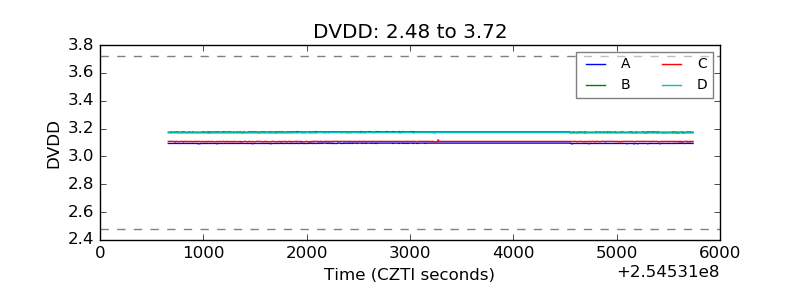 |
| Temperature 1 | 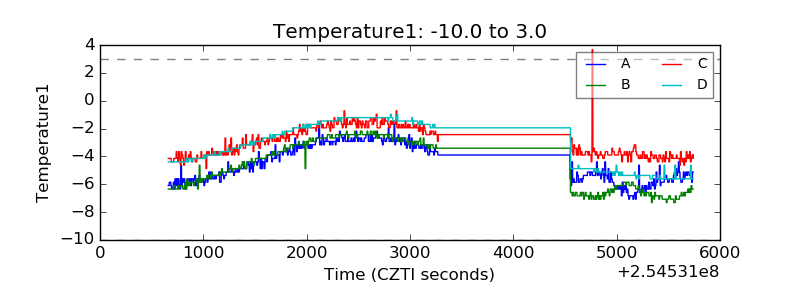 |
| Veto HV Monitor | 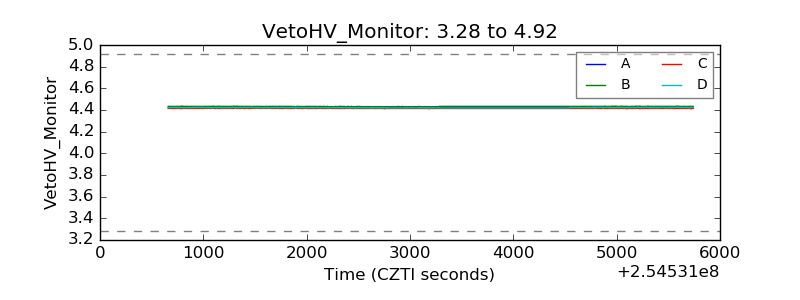 |
| Veto LLD | 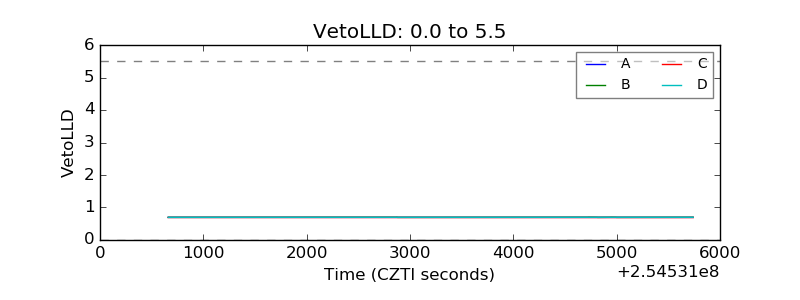 |
| Alpha Counter | 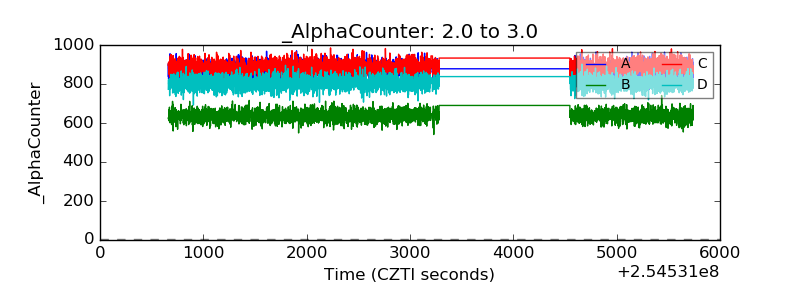 |
| _CPM_Rate | 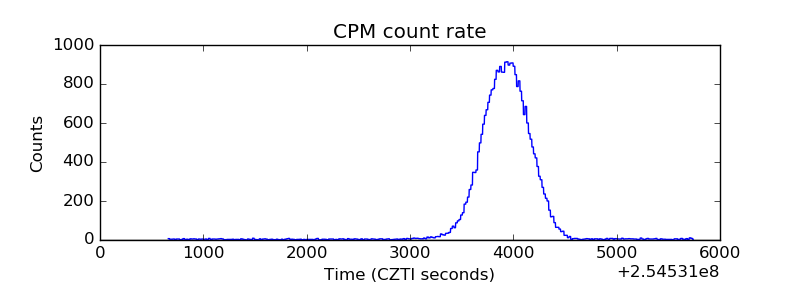 |
| CZT Counter | 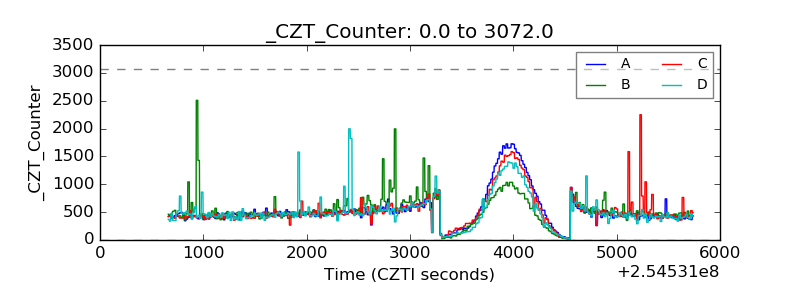 |
| +2.5 Volts monitor |  |
| +5 Volts monitor |  |
| _ROLL_ROT | 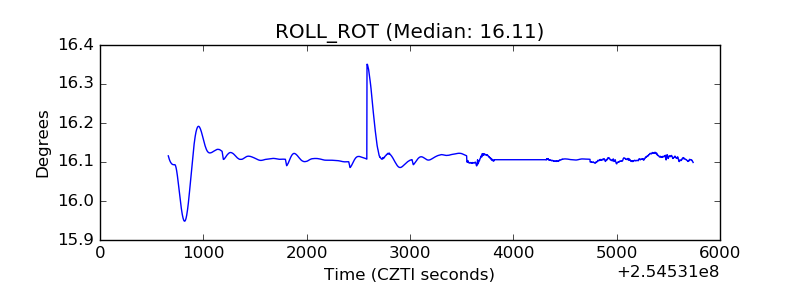 |
| _Roll_DEC | 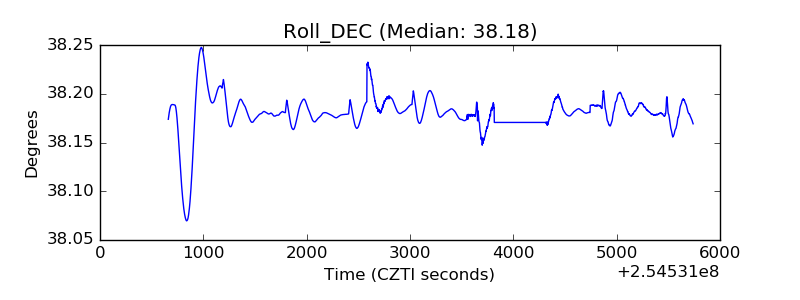 |
| _Roll_RA | 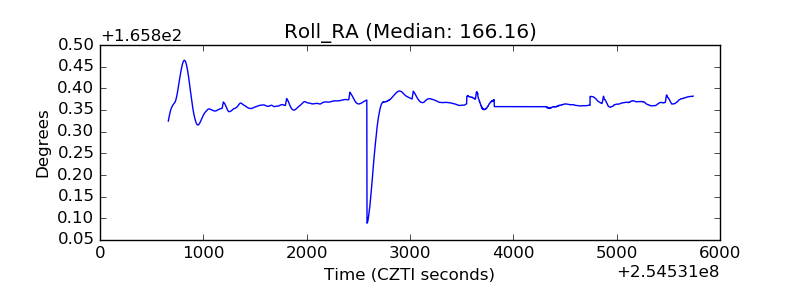 |
| Veto Counter | 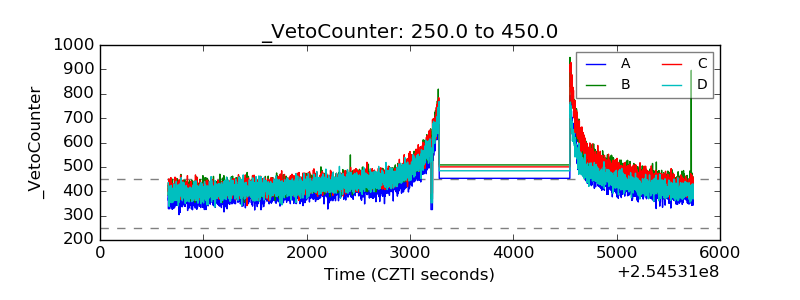 |