| Param | Original file | Final file |
|---|---|---|
| Filename | modeM0/AS1A04_130T04_9000001872_12580cztM0_level2.evt | modeM0/AS1A04_130T04_9000001872_12580cztM0_level2_quad_clean.evt |
| Size (bytes) | 354,746,880 | 75,703,680 |
| Size | 338.3 MB | 72.2 MB |
| Events in quadrant A | 2,420,103 | 487,687 |
| Events in quadrant B | 2,768,869 | 500,067 |
| Events in quadrant C | 2,488,563 | 490,035 |
| Events in quadrant D | 2,722,420 | 461,922 |
| Mode M0 | |||
|---|---|---|---|
| Quadrant | BADHDUFLAG | Total packets | Discarded packets |
| A | 0 | 15042 | 4288 |
| B | 0 | 17184 | 5482 |
| C | 0 | 15324 | 4415 |
| D | 0 | 16653 | 4988 |
| Mode SS | |||
|---|---|---|---|
| Quadrant | BADHDUFLAG | Total packets | Discarded packets |
| A | 0 | 144 | 46 |
| B | 0 | 145 | 33 |
| C | 0 | 145 | 43 |
| D | 0 | 146 | 46 |
| Mode M9 | |||
|---|---|---|---|
| Quadrant | BADHDUFLAG | Total packets | Discarded packets |
| A | 0 | 24 | 0 |
| B | 0 | 24 | 0 |
| C | 0 | 24 | 0 |
| D | 0 | 24 | 0 |
| Quadrant | Total seconds | Saturated seconds | Saturation percentage |
|---|---|---|---|
| A | 5070 | 49 | 0.966469% |
| B | 4990 | 181 | 3.627255% |
| C | 5027 | 56 | 1.113984% |
| D | 5044 | 91 | 1.804124% |
Noise dominated data is calculated using 1-second bins in cleaned event files. If a bin has >2000 counts, and if more than 50% of those come from <1% of pixels, then it is considered to be noise-dominated and hence unusable.
| Quadrant | # 1 sec bins | Bins with >0 counts | Bins with >2000 counts | High rate bins dominated by noise | Noise dominated (total time) | Noise dominated (detector-on time) | Marked lightcurve |
|---|---|---|---|---|---|---|---|
| A | 9543 | 5521 | 0 | 0 | 0.00% | 0.00% | 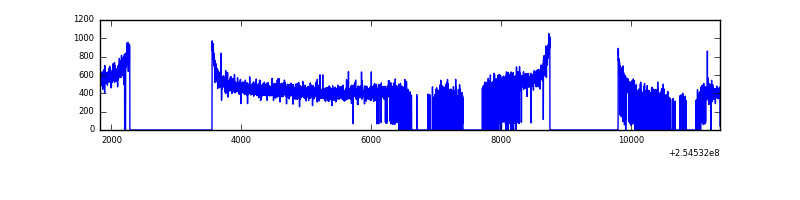 |
| B | 9543 | 5432 | 41 | 41 | 0.43% | 0.75% | 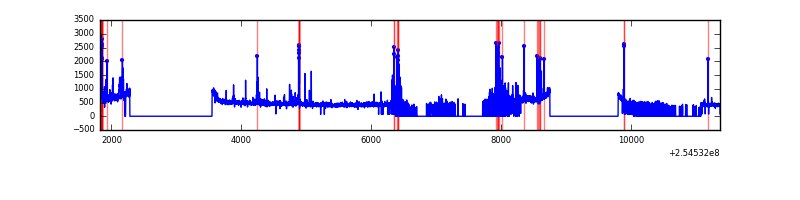 |
| C | 9543 | 5481 | 7 | 7 | 0.07% | 0.13% | 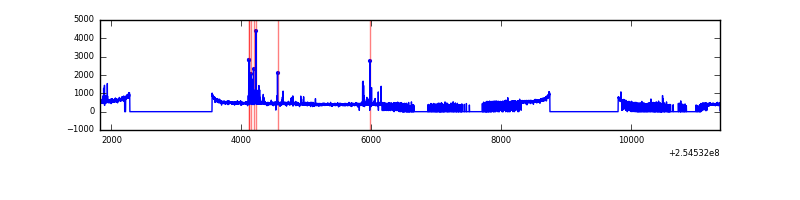 |
| D | 9543 | 5503 | 62 | 62 | 0.65% | 1.13% | 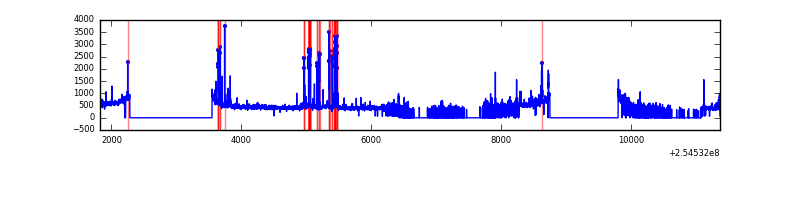 |
Top three noisy pixels from each quadrant. If the there are fewer than three noisy pixels in the level2.evt file, extra rows are filled as -1
| Pixel properties | Quadrant properties | ||||||
|---|---|---|---|---|---|---|---|
| Quadrant | DetID | PixID | Counts | Sigma | Mean | Median | Sigma |
| A | 0 | 226 | 5522 | 38.26 | 628 | 614 | 128.3 |
| A | 12 | 189 | 5369 | 37.06 | 628 | 614 | 128.3 |
| A | 12 | 194 | 4836 | 32.91 | 628 | 614 | 128.3 |
| B | 4 | 239 | 186747 | 1548.84 | 623 | 608 | 120.2 |
| B | 3 | 64 | 74066 | 611.23 | 623 | 608 | 120.2 |
| B | 11 | 51 | 34509 | 282.09 | 623 | 608 | 120.2 |
| C | 15 | 208 | 104121 | 731.13 | 610 | 611 | 141.6 |
| C | 13 | 61 | 4490 | 27.4 | 610 | 611 | 141.6 |
| C | 8 | 222 | 2089 | 10.44 | 610 | 611 | 141.6 |
| D | 1 | 52 | 372379 | 2565.47 | 600 | 582 | 144.9 |
| D | 13 | 249 | 42343 | 288.16 | 600 | 582 | 144.9 |
| D | 2 | 234 | 17797 | 118.79 | 600 | 582 | 144.9 |
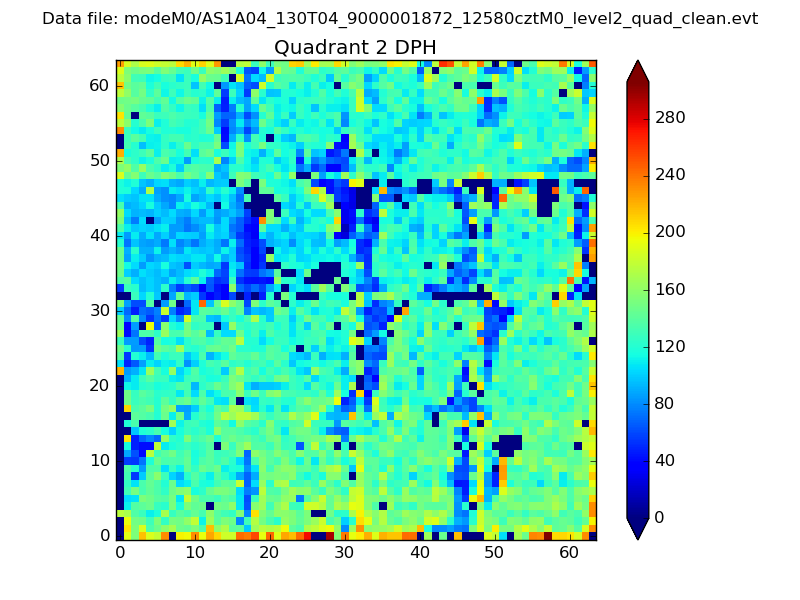
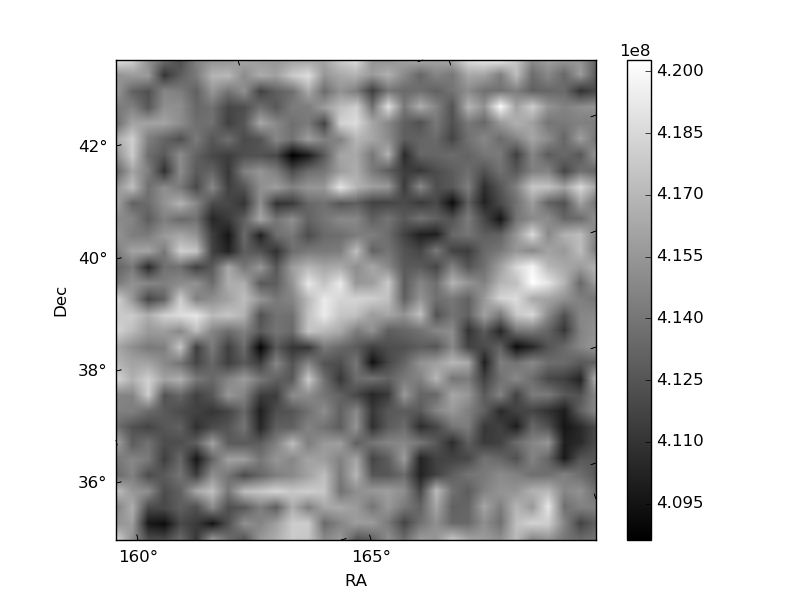
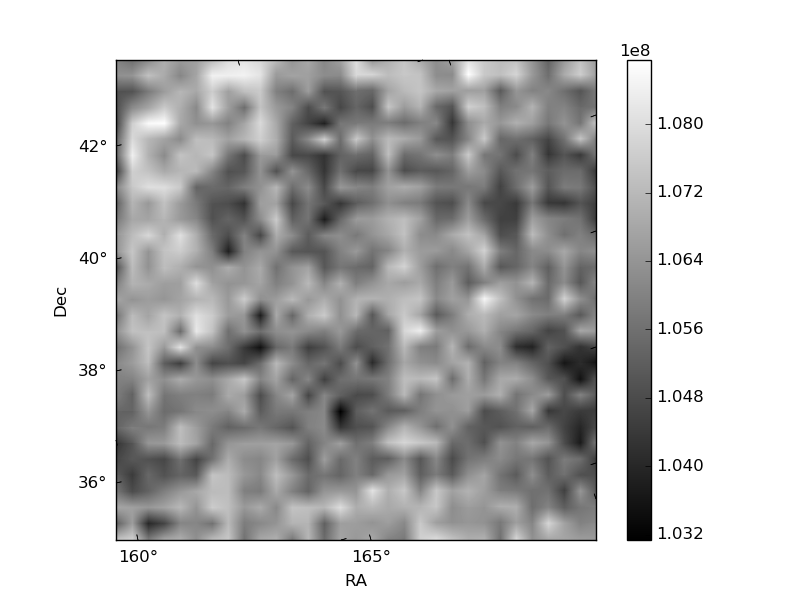
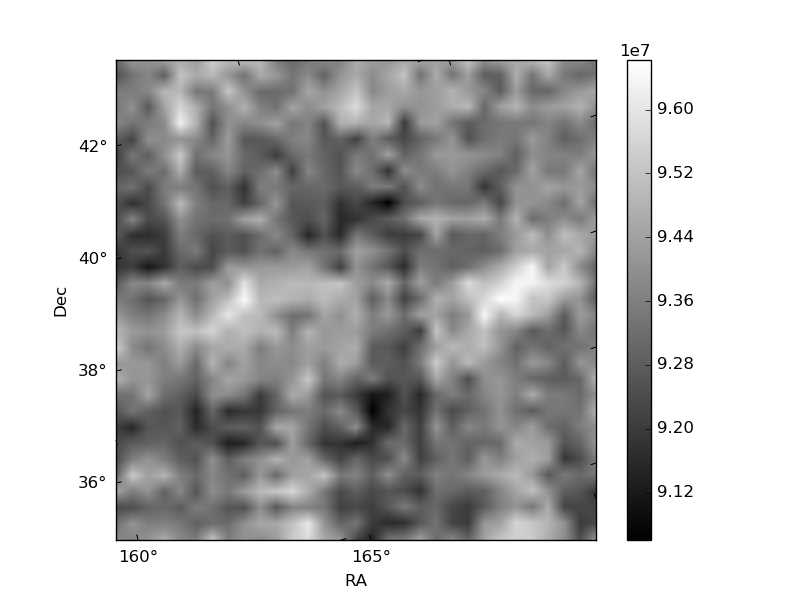
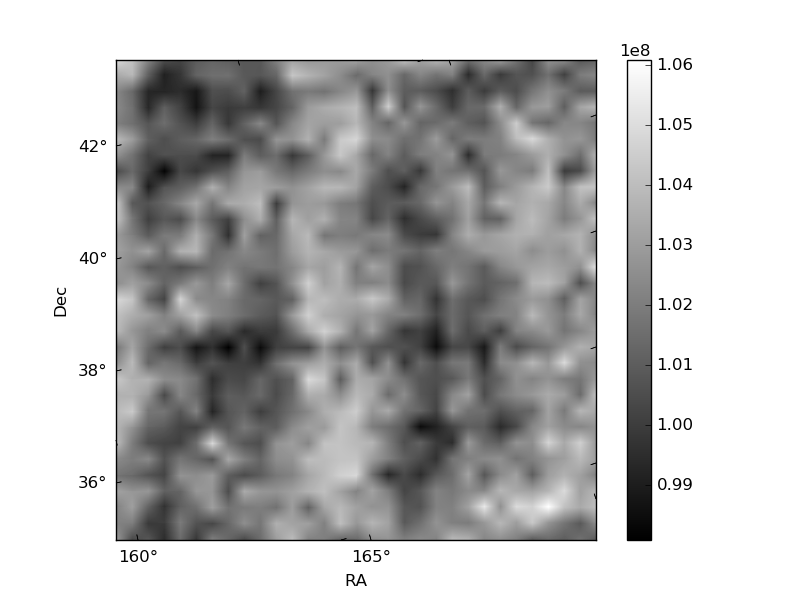
Histogram calculated using DETX and DETY for each event in the final _common_clean file
| Quadrant A | 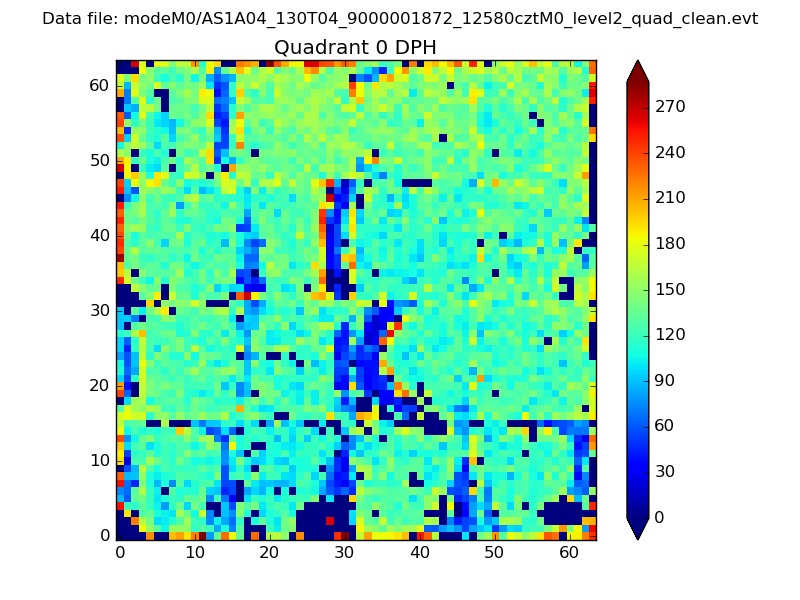 |
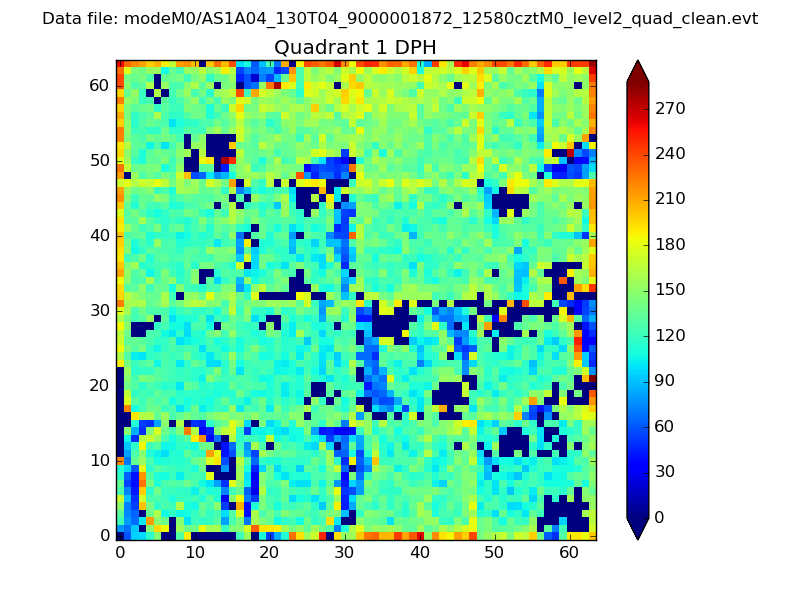 |
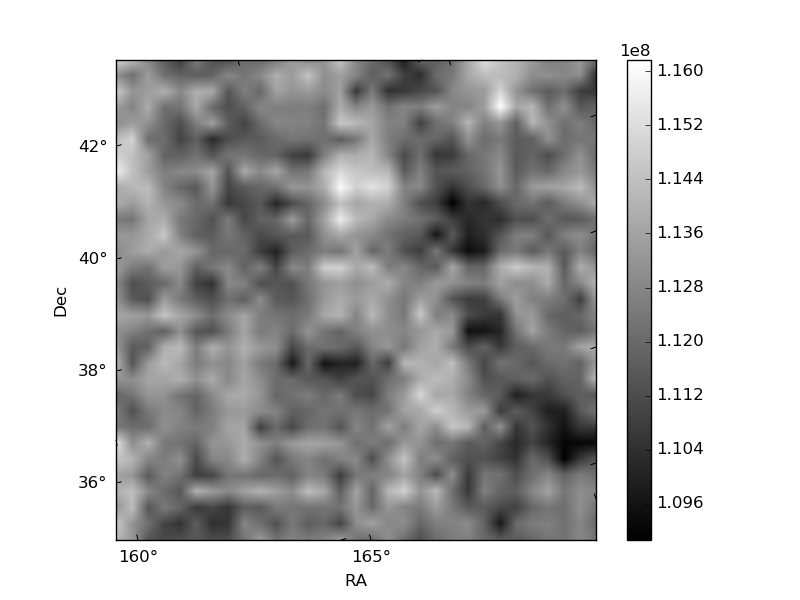
Quadrant B |
|---|---|---|---|
| Quadrant D | 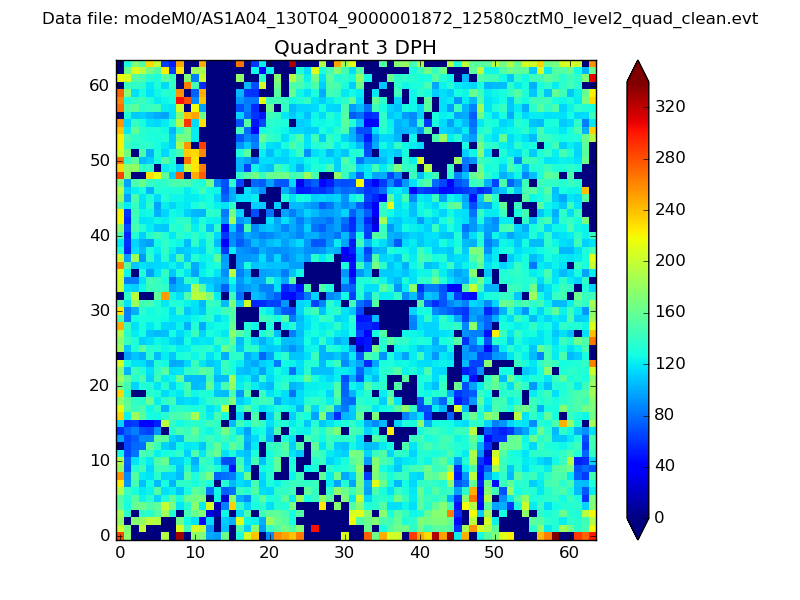 |
 |
Quadrant C |
| Plot type | Count rate plots | Images |
|---|---|---|
| Comparison with Poisson distribution Blue bars denote a histogram of data divided into 1 sec bins. Red curve is a Poisson curve with rate = median count rate of data. |
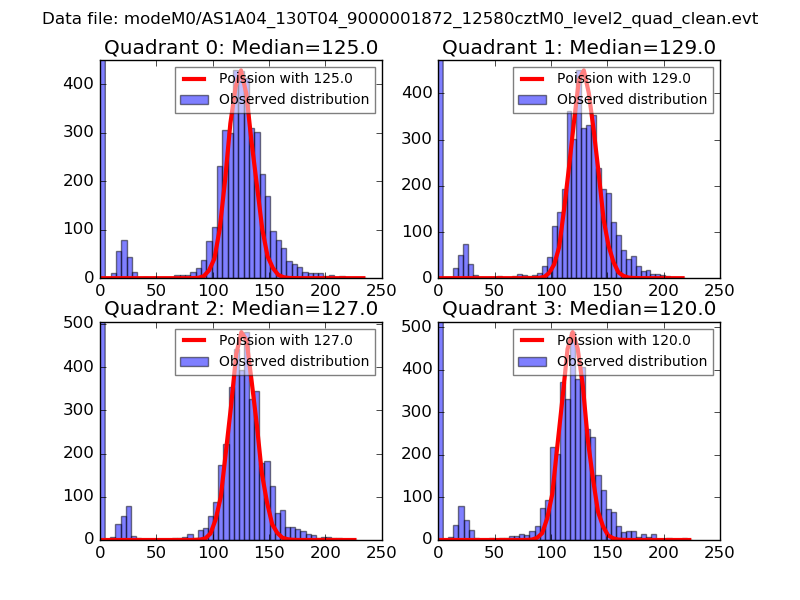 |
 |
| Quadrant-wise count rates Data is divided into 100 sec bins |
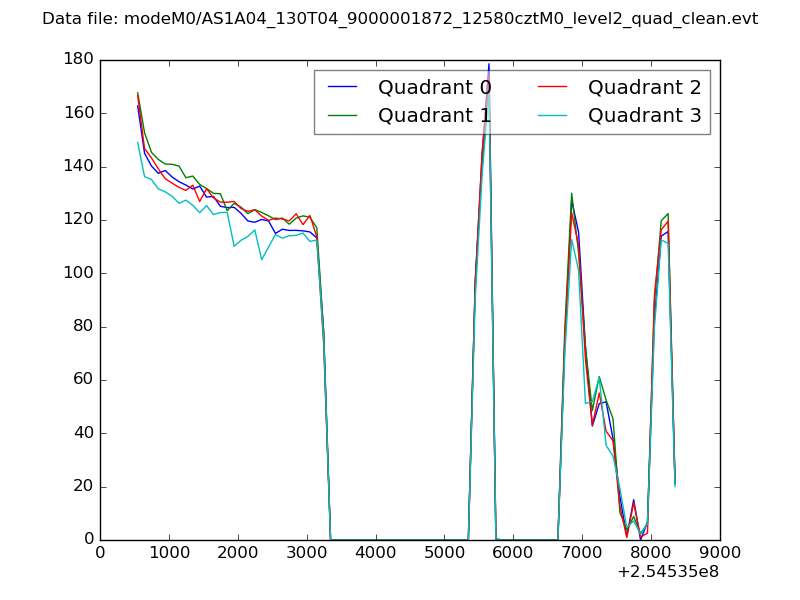 |
|
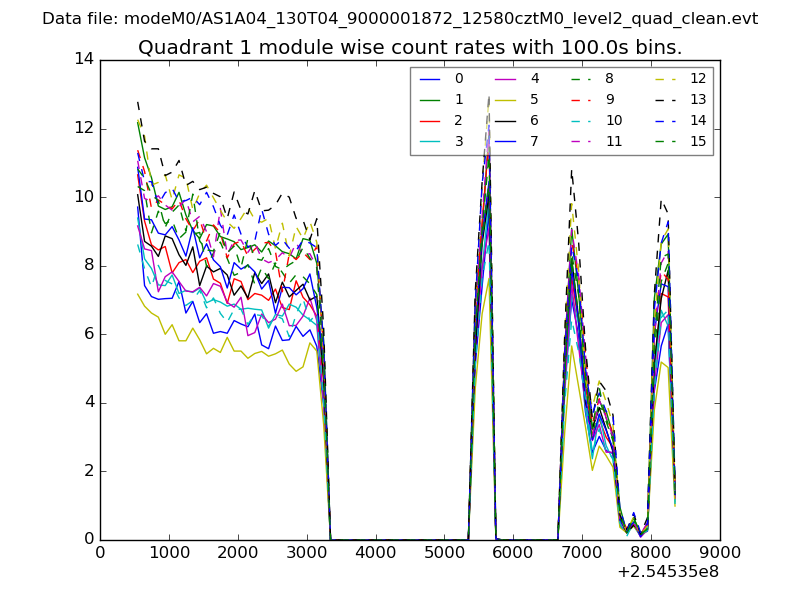
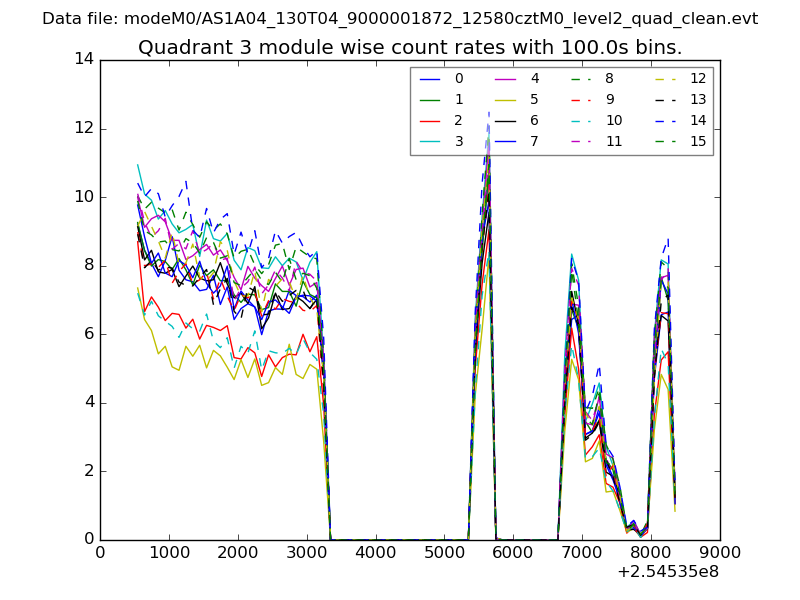
| Module-wise count rates for Quadrant A Data is divided into 100 sec bins |
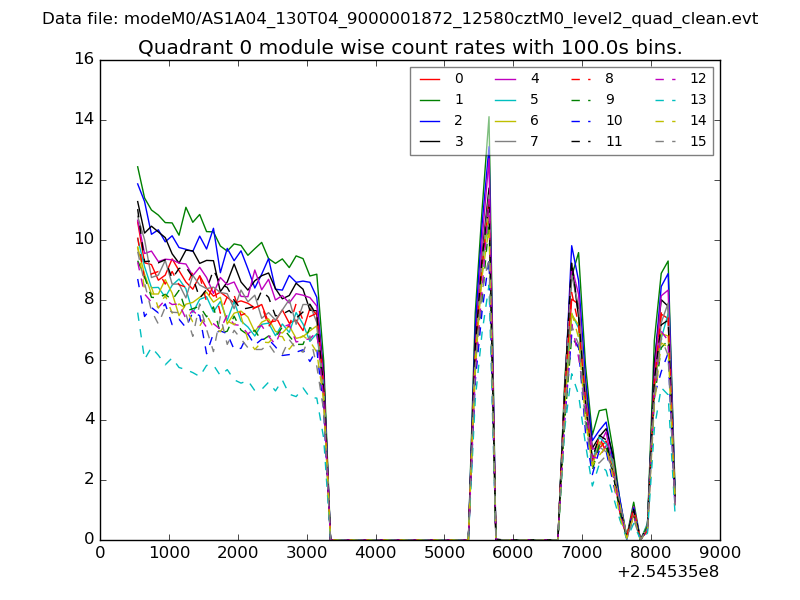 |
 |
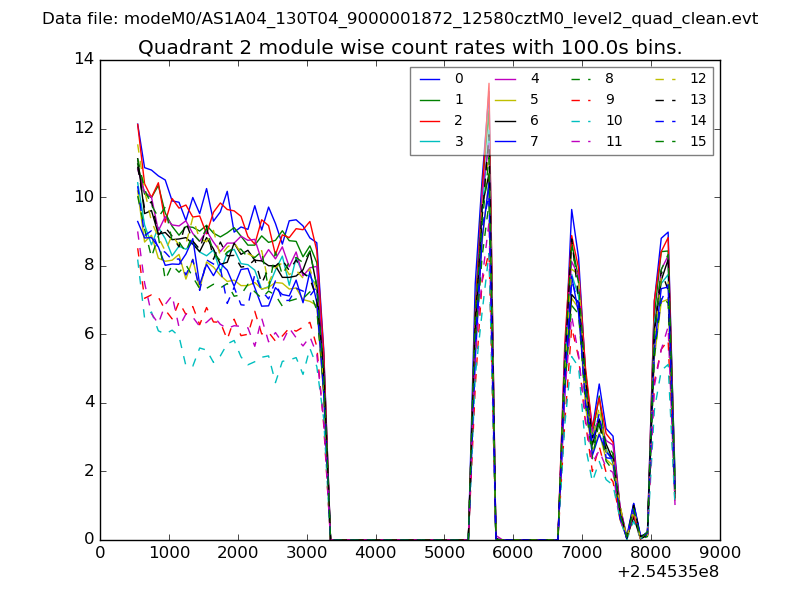
| Module-wise count rates for Quadrant B Data is divided into 100 sec bins |
 |
 |
| Module-wise count rates for Quadrant C Data is divided into 100 sec bins |
 |
 |
| Module-wise count rates for Quadrant D Data is divided into 100 sec bins |
 |
 |
| Parameter | Plot |
|---|---|
| CZT HV Monitor | 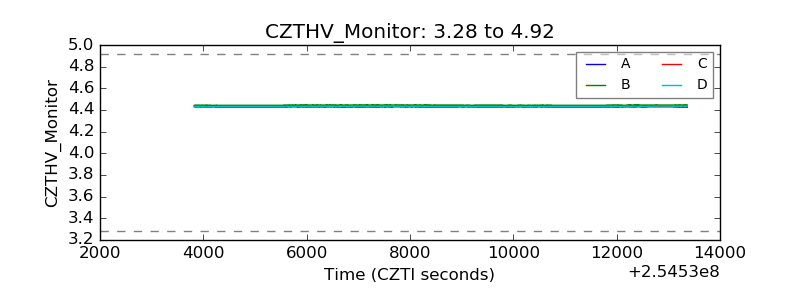 |
| D_VDD | 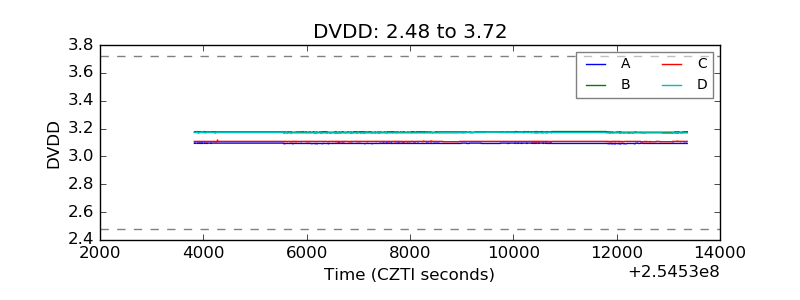 |
| Temperature 1 | 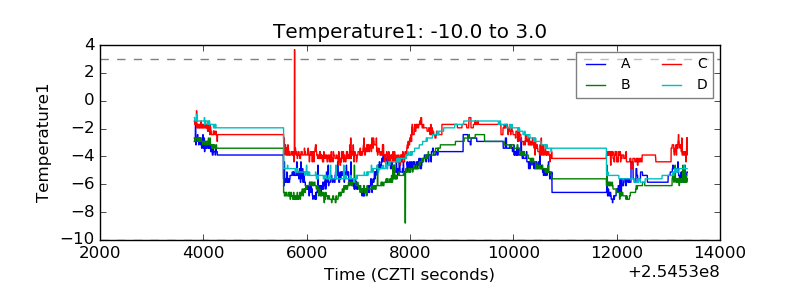 |
| Veto HV Monitor |  |
| Veto LLD | 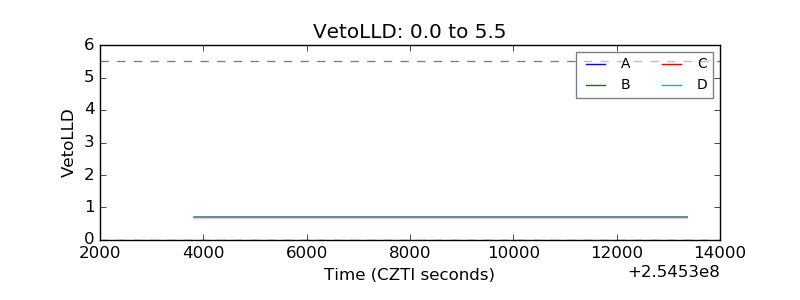 |
| Alpha Counter | 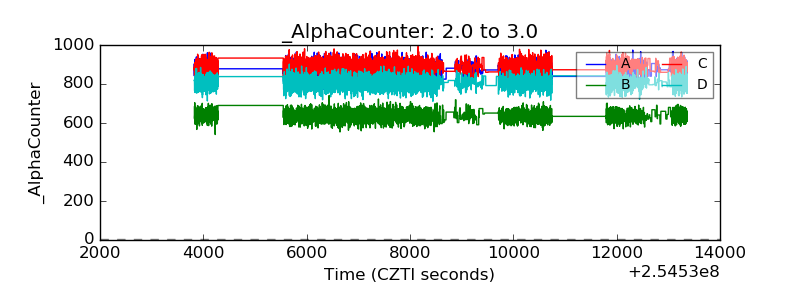 |
| _CPM_Rate | 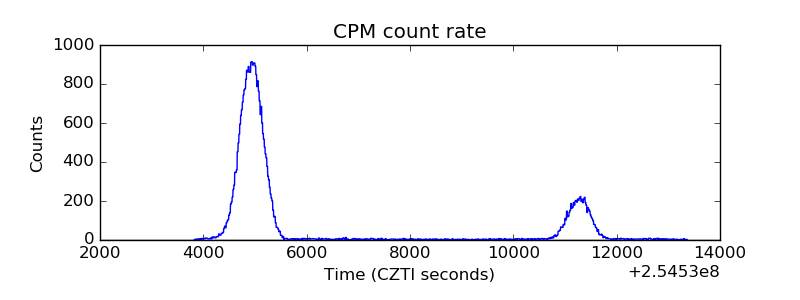 |
| CZT Counter | 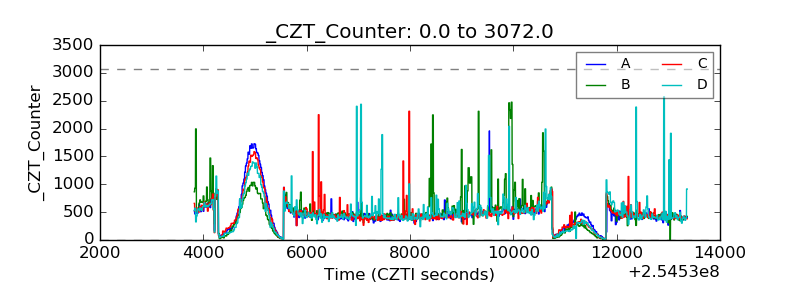 |
| +2.5 Volts monitor |  |
| +5 Volts monitor |  |
| _ROLL_ROT | 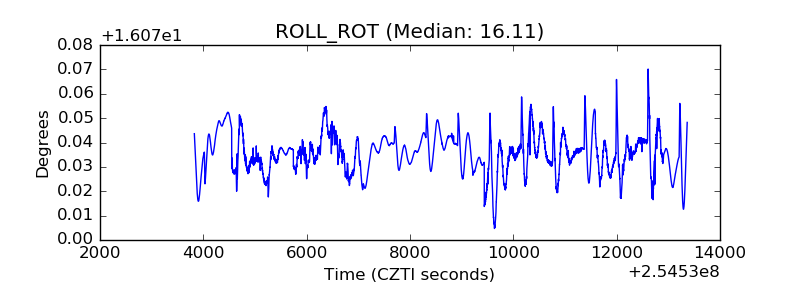 |
| _Roll_DEC | 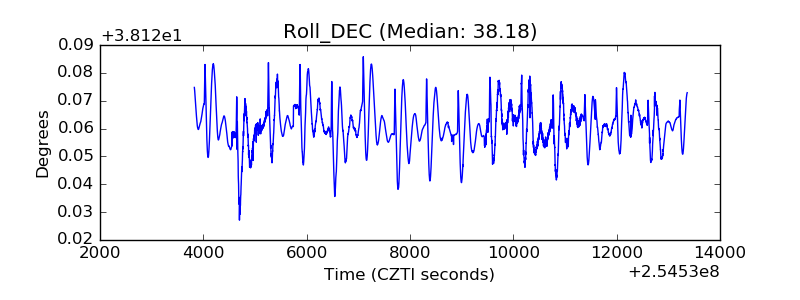 |
| _Roll_RA | 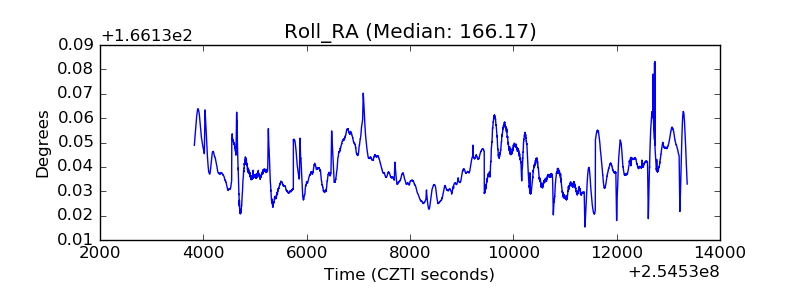 |
| Veto Counter | 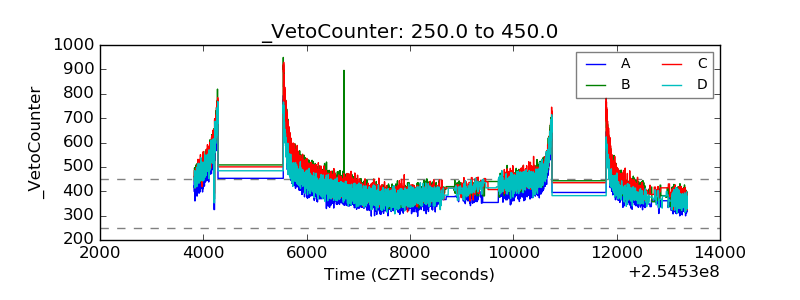 |