| Param | Original file | Final file |
|---|---|---|
| Filename | modeM0/AS1A04_130T04_9000001872_12581cztM0_level2.evt | modeM0/AS1A04_130T04_9000001872_12581cztM0_level2_quad_clean.evt |
| Size (bytes) | 866,983,680 | 165,084,480 |
| Size | 826.8 MB | 157.4 MB |
| Events in quadrant A | 5,806,008 | 1,036,686 |
| Events in quadrant B | 7,175,518 | 1,057,043 |
| Events in quadrant C | 5,872,831 | 1,045,587 |
| Events in quadrant D | 6,555,959 | 996,542 |
| Mode M0 | |||
|---|---|---|---|
| Quadrant | BADHDUFLAG | Total packets | Discarded packets |
| A | 0 | 25840 | 4 |
| B | 0 | 29811 | 3 |
| C | 0 | 26189 | 3 |
| D | 0 | 28255 | 3 |
| Mode SS | |||
|---|---|---|---|
| Quadrant | BADHDUFLAG | Total packets | Discarded packets |
| A | 0 | 254 | 0 |
| B | 0 | 254 | 0 |
| C | 0 | 254 | 0 |
| D | 0 | 254 | 0 |
| Mode M9 | |||
|---|---|---|---|
| Quadrant | BADHDUFLAG | Total packets | Discarded packets |
| A | 0 | 20 | 0 |
| B | 0 | 20 | 0 |
| C | 0 | 20 | 0 |
| D | 0 | 21 | 0 |
| Quadrant | Total seconds | Saturated seconds | Saturation percentage |
|---|---|---|---|
| A | 12506 | 108 | 0.863585% |
| B | 12506 | 395 | 3.158484% |
| C | 12506 | 92 | 0.735647% |
| D | 12506 | 181 | 1.447305% |
Noise dominated data is calculated using 1-second bins in cleaned event files. If a bin has >2000 counts, and if more than 50% of those come from <1% of pixels, then it is considered to be noise-dominated and hence unusable.
| Quadrant | # 1 sec bins | Bins with >0 counts | Bins with >2000 counts | High rate bins dominated by noise | Noise dominated (total time) | Noise dominated (detector-on time) | Marked lightcurve |
|---|---|---|---|---|---|---|---|
| A | 14117 | 12510 | 3 | 3 | 0.02% | 0.02% | 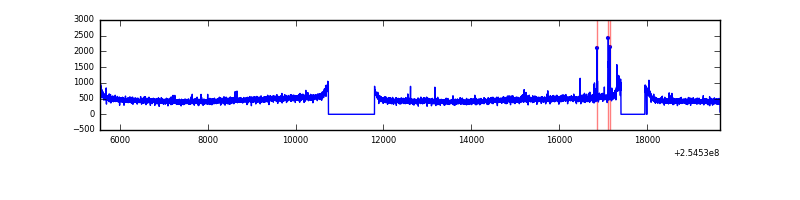 |
| B | 14117 | 12508 | 182 | 182 | 1.29% | 1.46% | 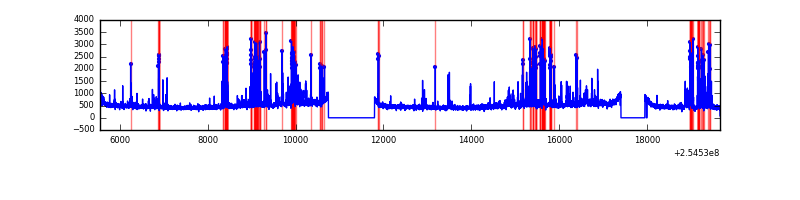 |
| C | 14117 | 12510 | 34 | 34 | 0.24% | 0.27% | 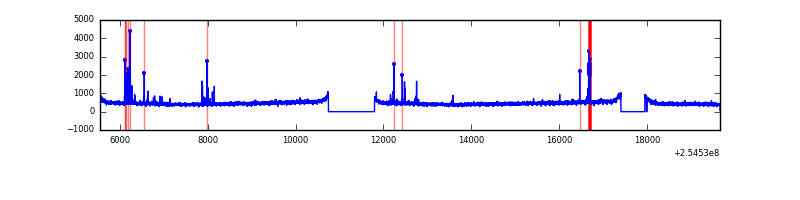 |
| D | 14117 | 12510 | 112 | 112 | 0.79% | 0.90% | 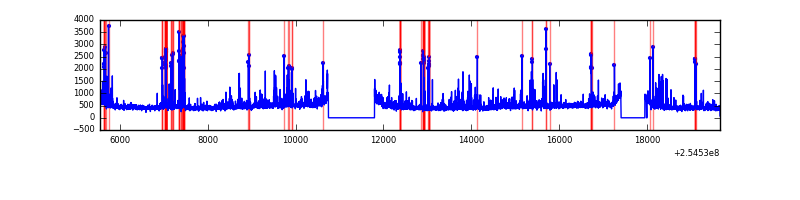 |
Top three noisy pixels from each quadrant. If the there are fewer than three noisy pixels in the level2.evt file, extra rows are filled as -1
| Pixel properties | Quadrant properties | ||||||
|---|---|---|---|---|---|---|---|
| Quadrant | DetID | PixID | Counts | Sigma | Mean | Median | Sigma |
| A | 12 | 96 | 34720 | 110.02 | 1494 | 1462 | 302.3 |
| A | 12 | 189 | 26824 | 83.9 | 1494 | 1462 | 302.3 |
| A | 0 | 226 | 13347 | 39.32 | 1494 | 1462 | 302.3 |
| B | 4 | 239 | 694926 | 2442.59 | 1492 | 1456 | 283.9 |
| B | 3 | 64 | 407765 | 1431.13 | 1492 | 1456 | 283.9 |
| B | 11 | 51 | 117681 | 409.38 | 1492 | 1456 | 283.9 |
| C | 15 | 208 | 205454 | 609.35 | 1452 | 1460 | 334.8 |
| C | 13 | 61 | 10542 | 27.13 | 1452 | 1460 | 334.8 |
| C | 8 | 222 | 4924 | 10.35 | 1452 | 1460 | 334.8 |
| D | 1 | 52 | 887953 | 2562.41 | 1436 | 1396 | 346.0 |
| D | 13 | 249 | 142124 | 406.75 | 1436 | 1396 | 346.0 |
| D | 2 | 234 | 43429 | 121.49 | 1436 | 1396 | 346.0 |
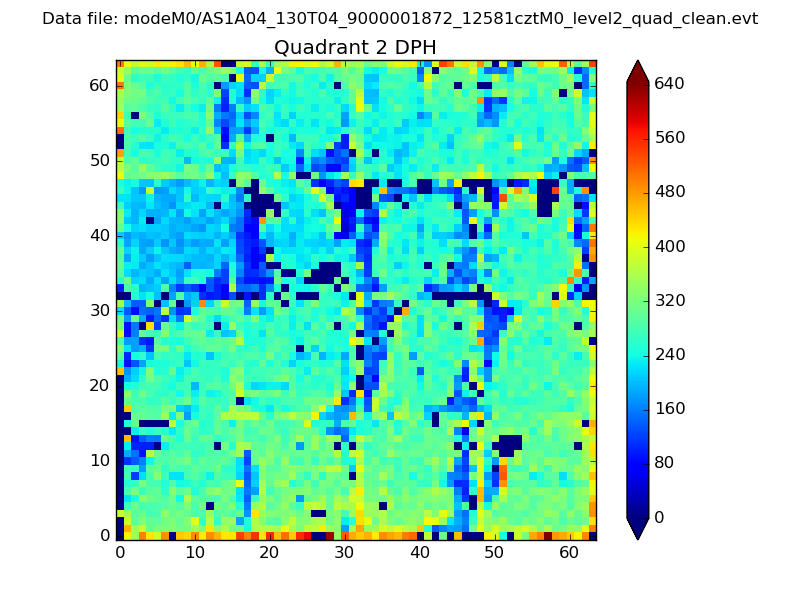
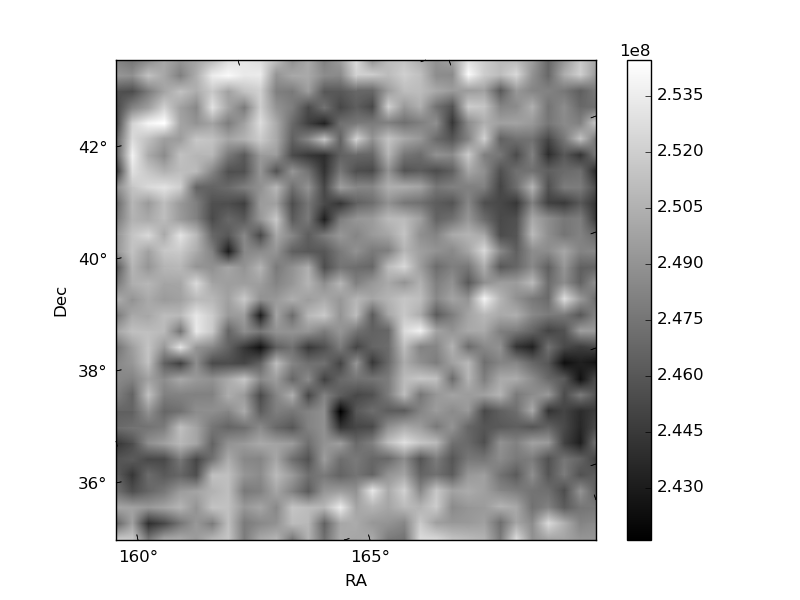
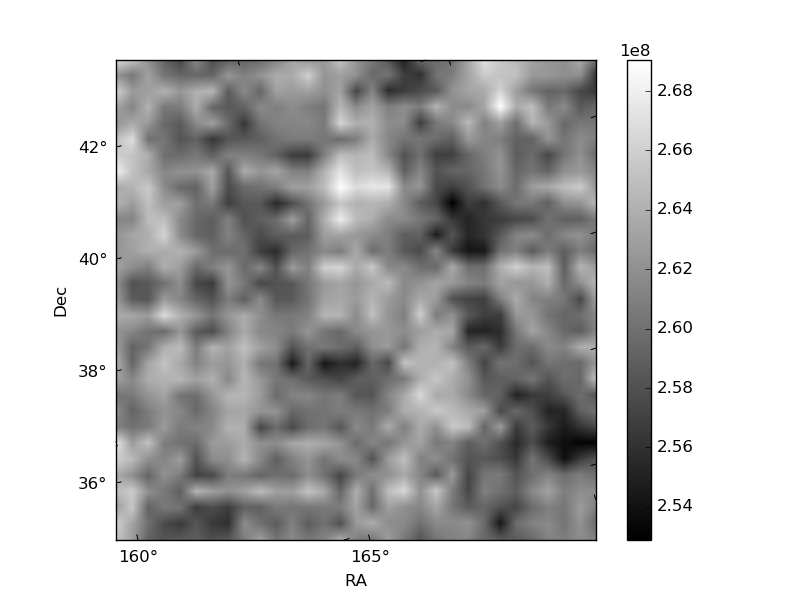
Histogram calculated using DETX and DETY for each event in the final _common_clean file
| Quadrant A | 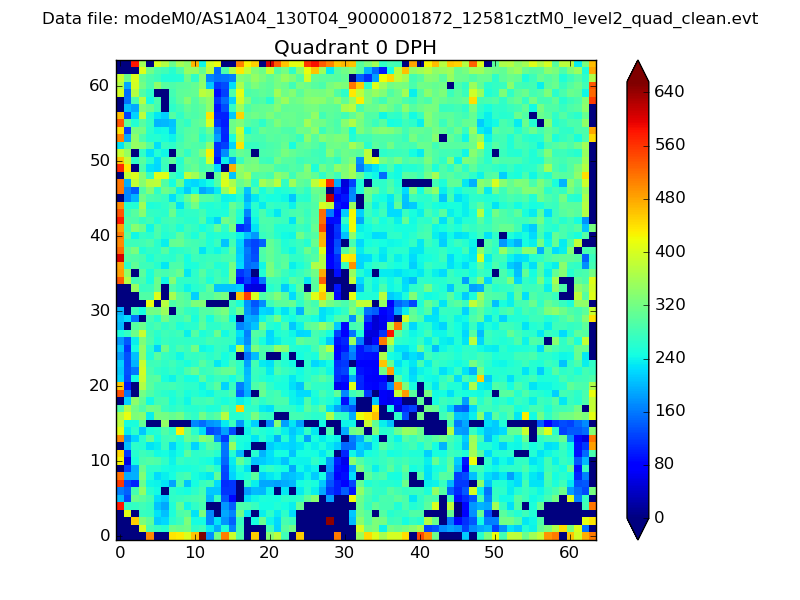 |
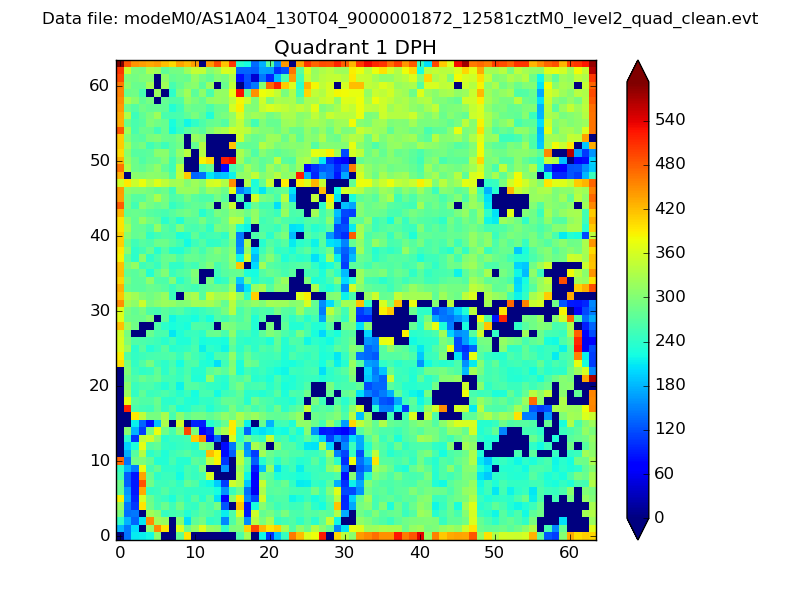 |
Quadrant B |
|---|---|---|---|
| Quadrant D | 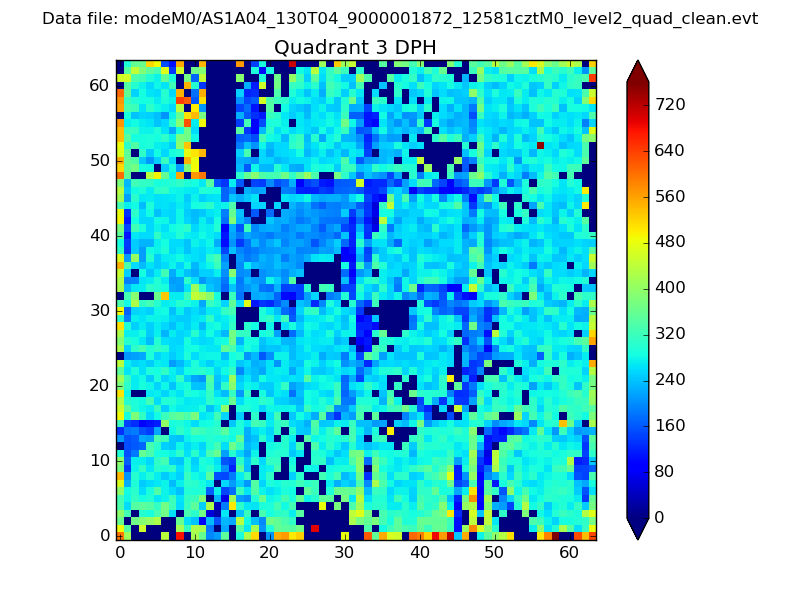 |
 |
Quadrant C |
| Plot type | Count rate plots | Images |
|---|---|---|
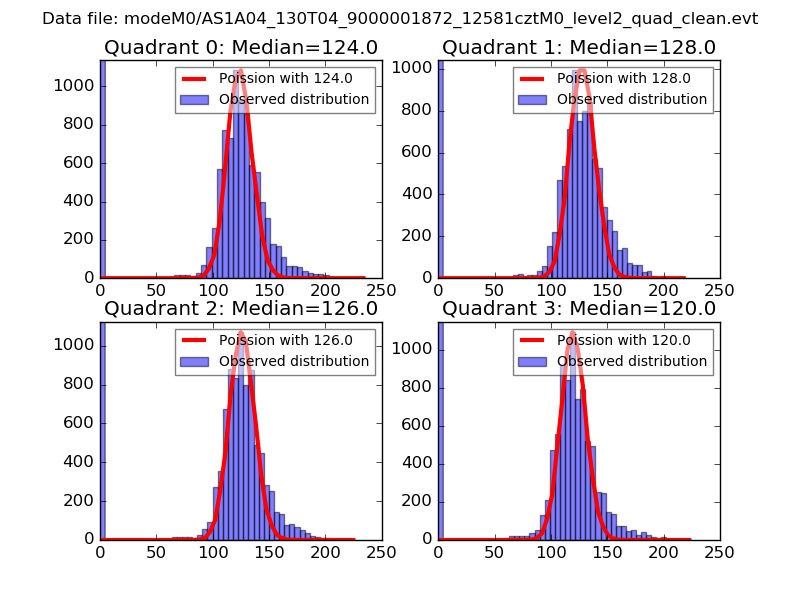
| Comparison with Poisson distribution Blue bars denote a histogram of data divided into 1 sec bins. Red curve is a Poisson curve with rate = median count rate of data. |
 |
 |
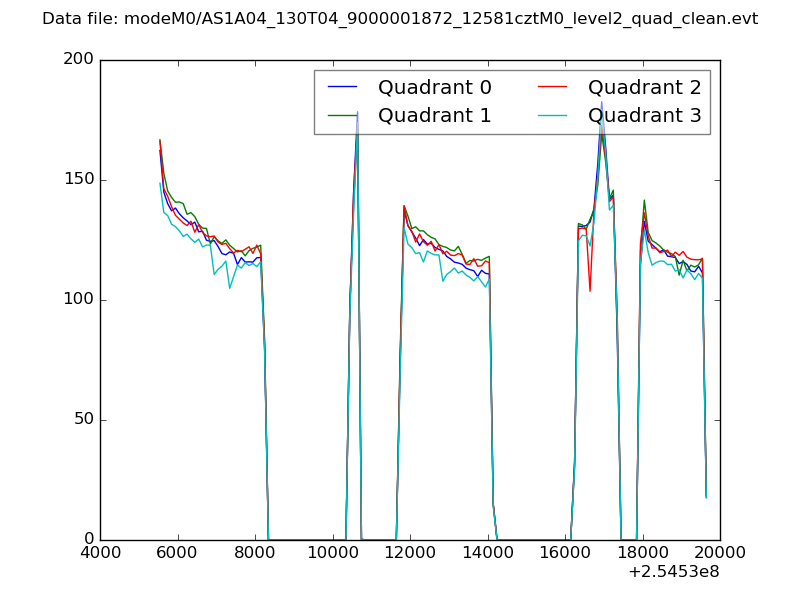
| Quadrant-wise count rates Data is divided into 100 sec bins |
 |
|
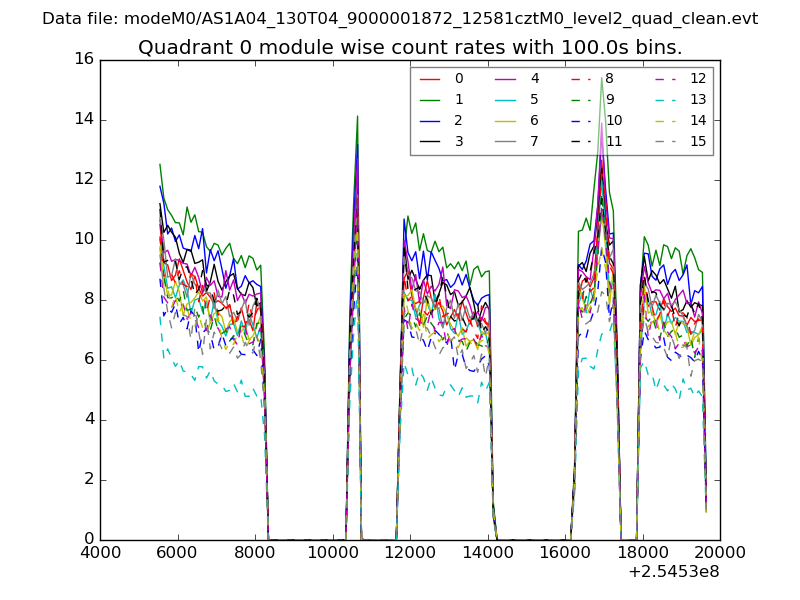
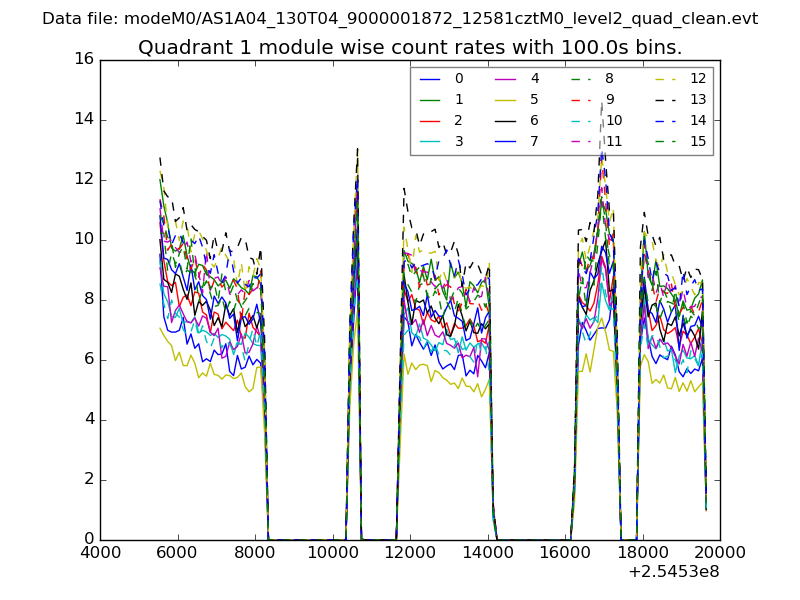
| Module-wise count rates for Quadrant A Data is divided into 100 sec bins |
 |
 |
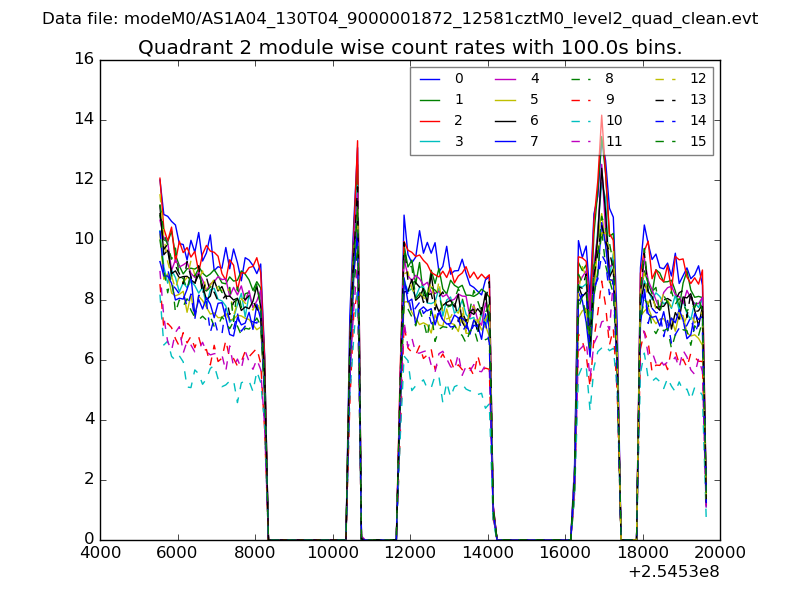
| Module-wise count rates for Quadrant B Data is divided into 100 sec bins |
 |
 |
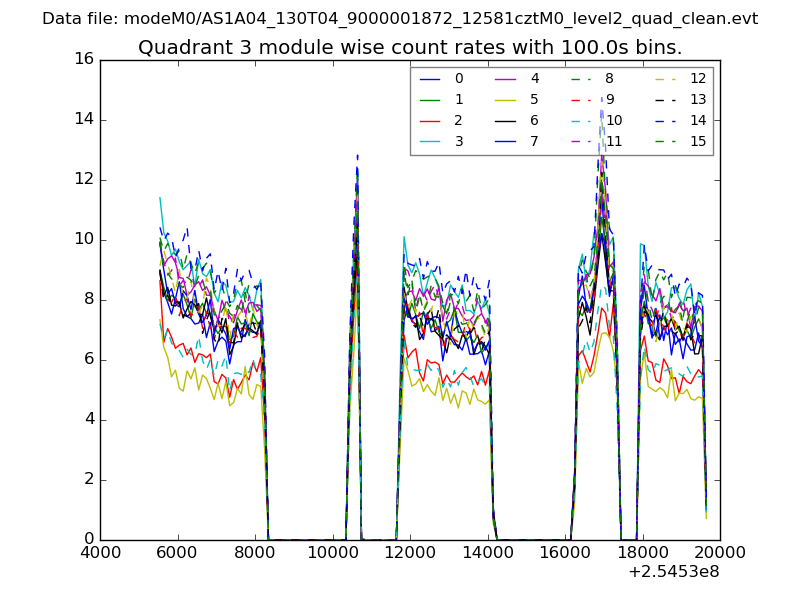
| Module-wise count rates for Quadrant C Data is divided into 100 sec bins |
 |
 |
| Module-wise count rates for Quadrant D Data is divided into 100 sec bins |
 |
 |
| Parameter | Plot |
|---|---|
| CZT HV Monitor | 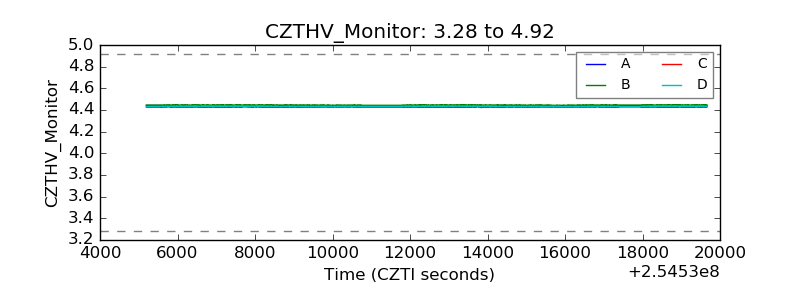 |
| D_VDD | 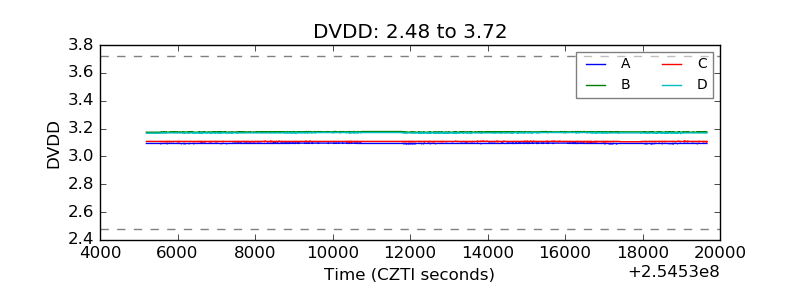 |
| Temperature 1 | 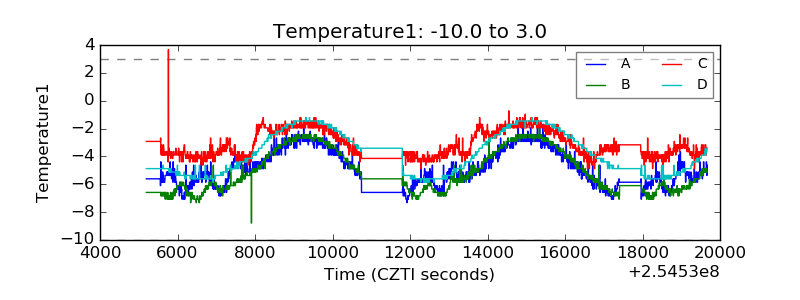 |
| Veto HV Monitor | 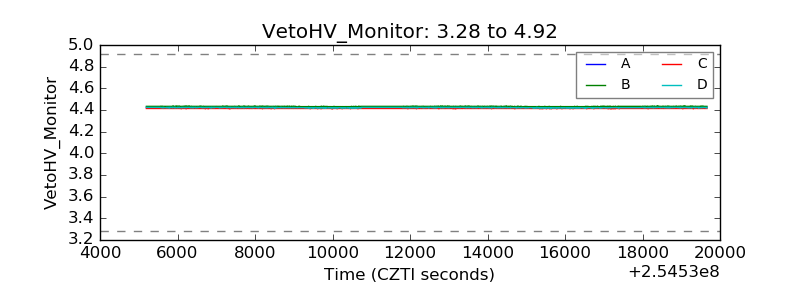 |
| Veto LLD |  |
| Alpha Counter | 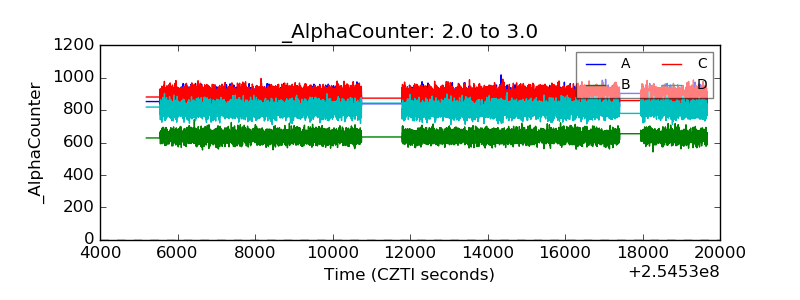 |
| _CPM_Rate | 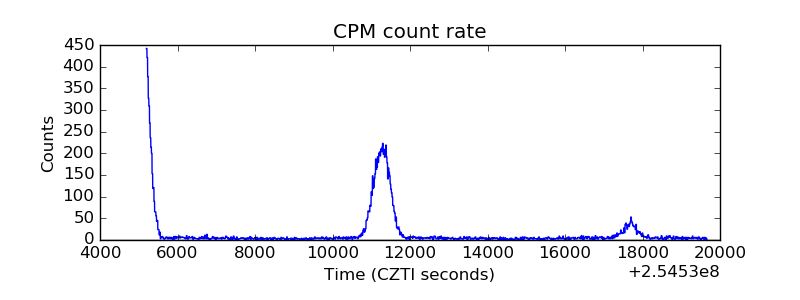 |
| CZT Counter | 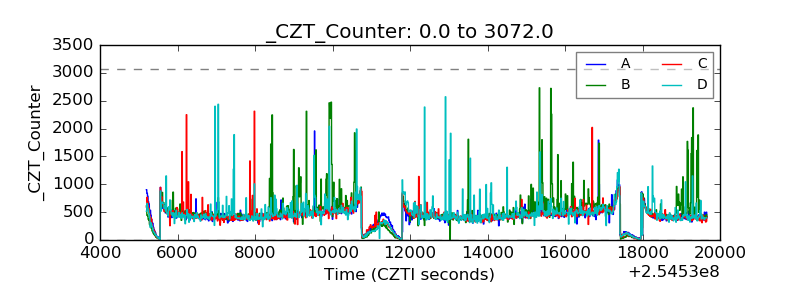 |
| +2.5 Volts monitor |  |
| +5 Volts monitor |  |
| _ROLL_ROT | 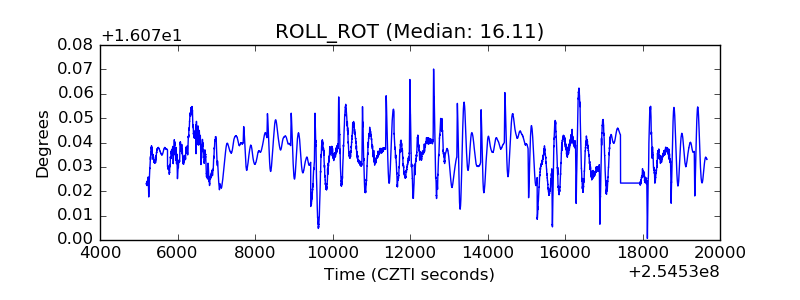 |
| _Roll_DEC |  |
| _Roll_RA | 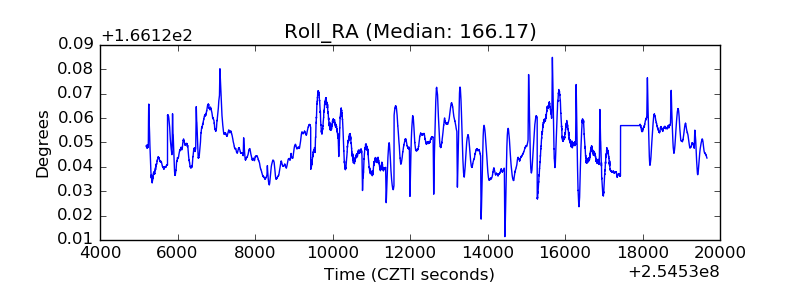 |
| Veto Counter | 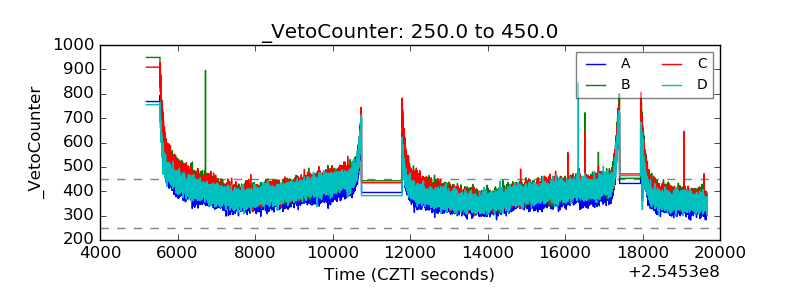 |