| Param | Original file | Final file |
|---|---|---|
| Filename | modeM0/AS1A04_130T04_9000001872_12582cztM0_level2.evt | modeM0/AS1A04_130T04_9000001872_12582cztM0_level2_quad_clean.evt |
| Size (bytes) | 519,770,880 | 108,584,640 |
| Size | 495.7 MB | 103.6 MB |
| Events in quadrant A | 3,587,782 | 683,626 |
| Events in quadrant B | 4,297,145 | 702,611 |
| Events in quadrant C | 3,585,175 | 697,215 |
| Events in quadrant D | 3,745,231 | 666,689 |
| Mode M0 | |||
|---|---|---|---|
| Quadrant | BADHDUFLAG | Total packets | Discarded packets |
| A | 0 | 16208 | 134 |
| B | 0 | 18056 | 128 |
| C | 0 | 16294 | 125 |
| D | 0 | 16804 | 118 |
| Mode SS | |||
|---|---|---|---|
| Quadrant | BADHDUFLAG | Total packets | Discarded packets |
| A | 0 | 156 | 0 |
| B | 0 | 156 | 0 |
| C | 0 | 156 | 2 |
| D | 0 | 156 | 0 |
| Mode M9 | |||
|---|---|---|---|
| Quadrant | BADHDUFLAG | Total packets | Discarded packets |
| A | 0 | 2 | 0 |
| B | 0 | 2 | 0 |
| C | 0 | 2 | 0 |
| D | 0 | 3 | 0 |
| Quadrant | Total seconds | Saturated seconds | Saturation percentage |
|---|---|---|---|
| A | 7736 | 303 | 3.916753% |
| B | 7739 | 371 | 4.793901% |
| C | 7739 | 166 | 2.144980% |
| D | 7743 | 224 | 2.892936% |
Noise dominated data is calculated using 1-second bins in cleaned event files. If a bin has >2000 counts, and if more than 50% of those come from <1% of pixels, then it is considered to be noise-dominated and hence unusable.
| Quadrant | # 1 sec bins | Bins with >0 counts | Bins with >2000 counts | High rate bins dominated by noise | Noise dominated (total time) | Noise dominated (detector-on time) | Marked lightcurve |
|---|---|---|---|---|---|---|---|
| A | 7817 | 7784 | 0 | 0 | 0.00% | 0.00% | 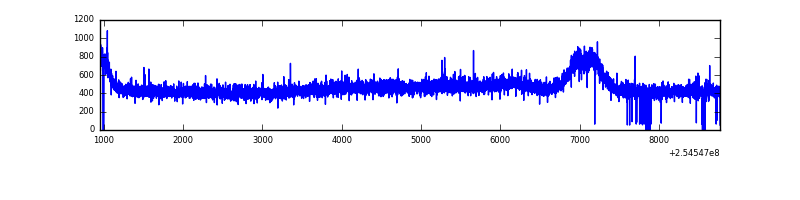 |
| B | 7817 | 7789 | 67 | 67 | 0.86% | 0.86% | 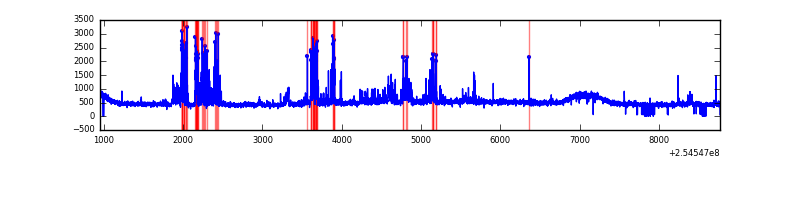 |
| C | 7817 | 7783 | 4 | 4 | 0.05% | 0.05% | 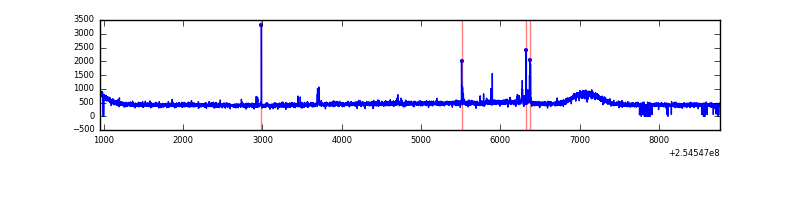 |
| D | 7817 | 7792 | 18 | 18 | 0.23% | 0.23% | 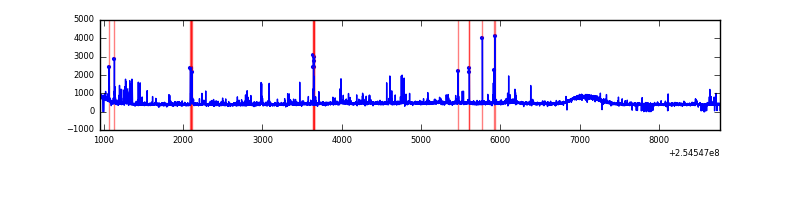 |
Top three noisy pixels from each quadrant. If the there are fewer than three noisy pixels in the level2.evt file, extra rows are filled as -1
| Pixel properties | Quadrant properties | ||||||
|---|---|---|---|---|---|---|---|
| Quadrant | DetID | PixID | Counts | Sigma | Mean | Median | Sigma |
| A | 12 | 189 | 22022 | 110.64 | 926 | 902 | 190.9 |
| A | 0 | 226 | 8152 | 37.98 | 926 | 902 | 190.9 |
| A | 12 | 194 | 7302 | 33.53 | 926 | 902 | 190.9 |
| B | 4 | 239 | 325399 | 1814.33 | 925 | 899 | 178.9 |
| B | 3 | 64 | 267442 | 1490.28 | 925 | 899 | 178.9 |
| B | 11 | 51 | 53894 | 296.3 | 925 | 899 | 178.9 |
| C | 15 | 208 | 56243 | 263.96 | 903 | 908 | 209.6 |
| C | 13 | 61 | 6514 | 26.74 | 903 | 908 | 209.6 |
| C | 14 | 234 | 5718 | 22.94 | 903 | 908 | 209.6 |
| D | 1 | 52 | 212931 | 975.85 | 898 | 870 | 217.3 |
| D | 13 | 249 | 72162 | 328.07 | 898 | 870 | 217.3 |
| D | 2 | 234 | 28111 | 125.36 | 898 | 870 | 217.3 |
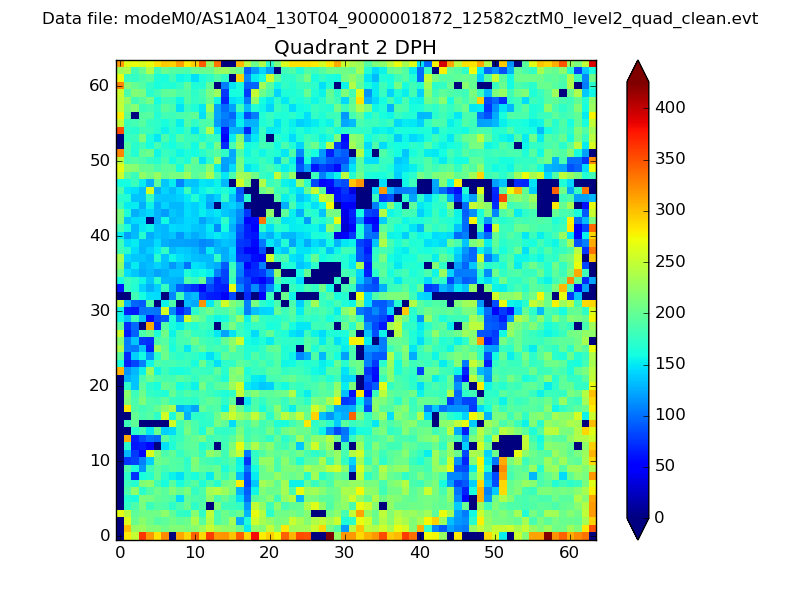
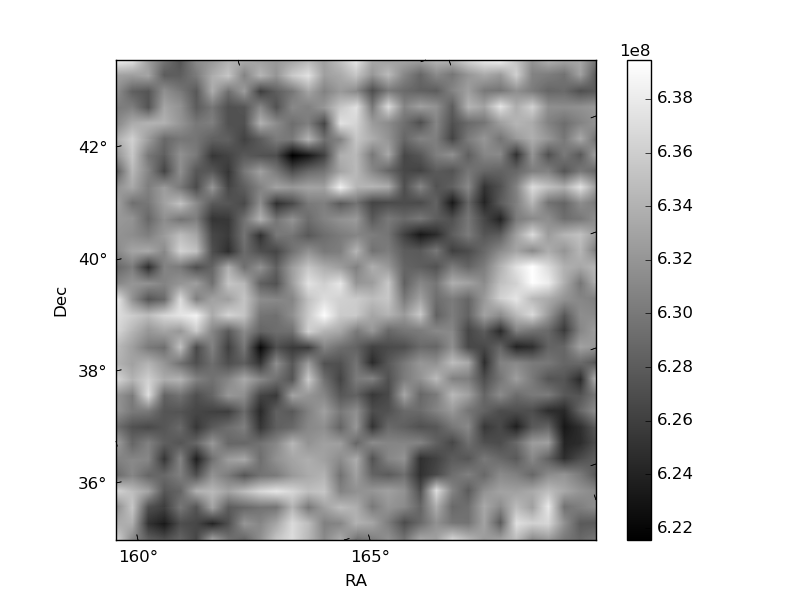
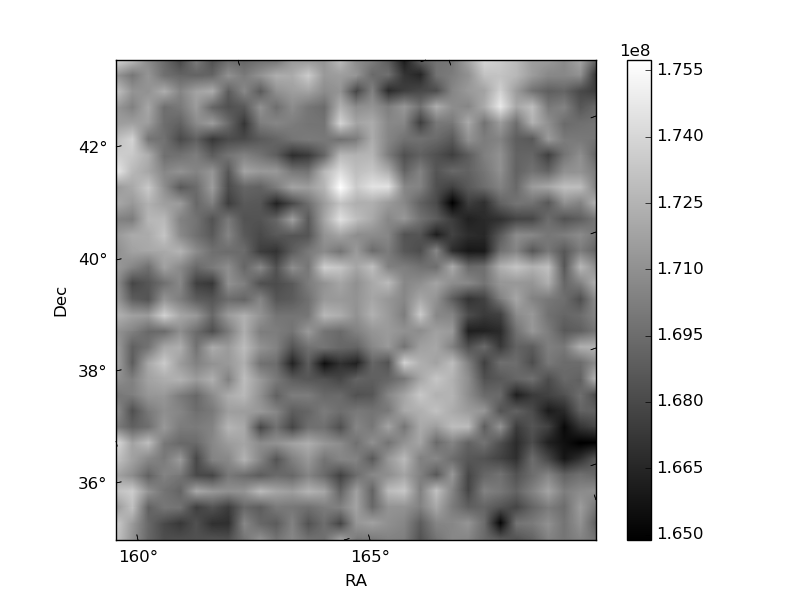
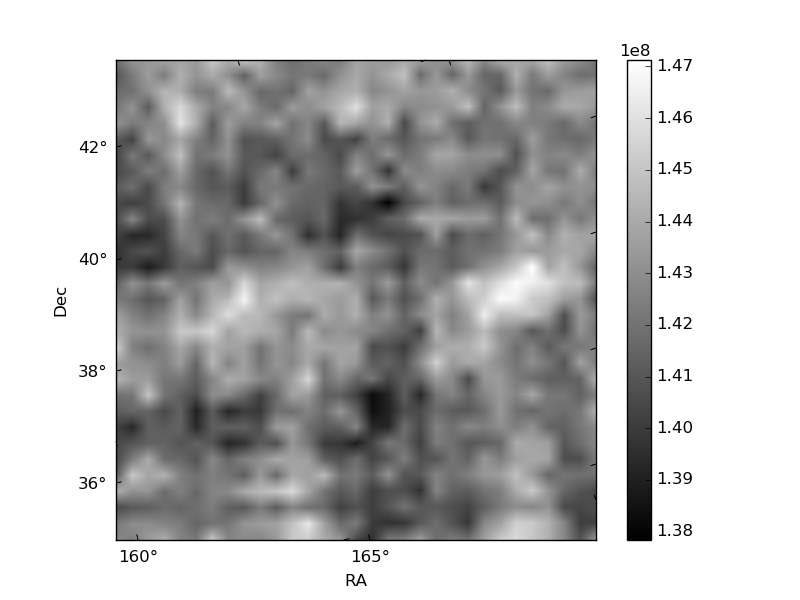
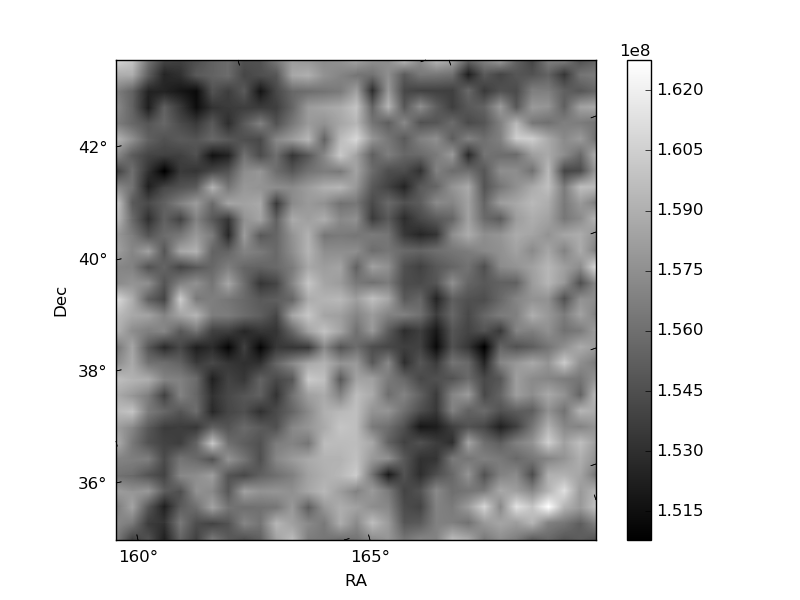
Histogram calculated using DETX and DETY for each event in the final _common_clean file
| Quadrant A | 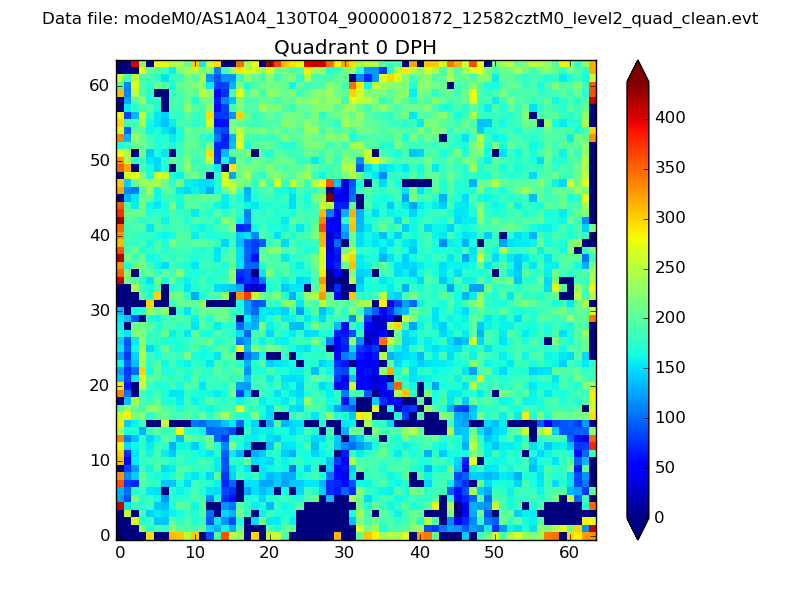 |
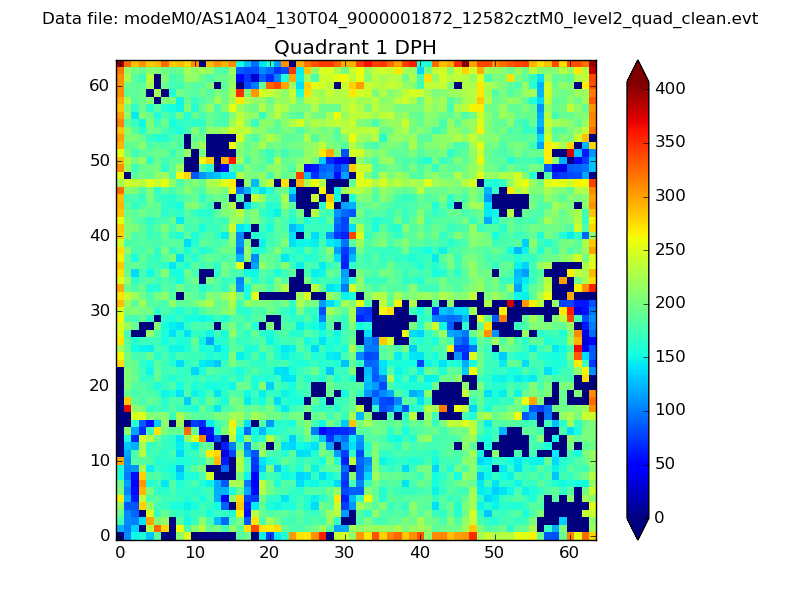 |
Quadrant B |
|---|---|---|---|
| Quadrant D | 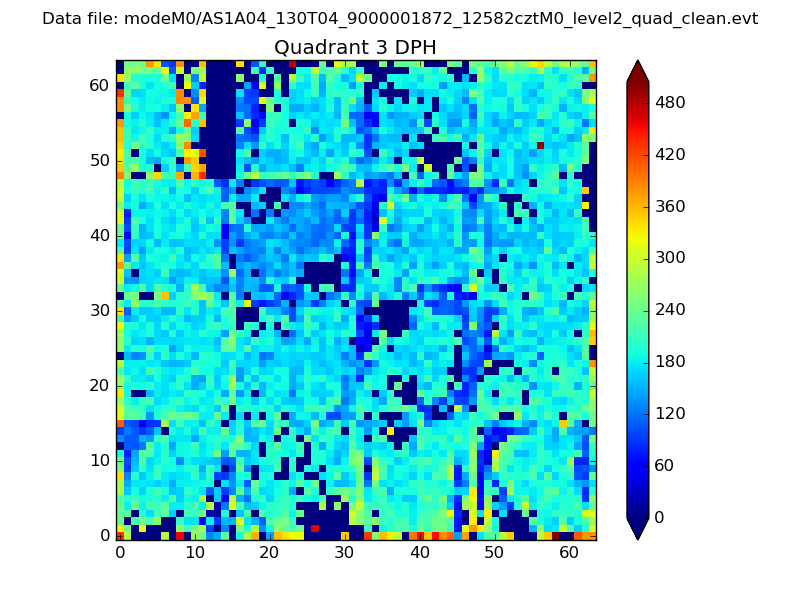 |
 |
Quadrant C |
| Plot type | Count rate plots | Images |
|---|---|---|
| Comparison with Poisson distribution Blue bars denote a histogram of data divided into 1 sec bins. Red curve is a Poisson curve with rate = median count rate of data. |
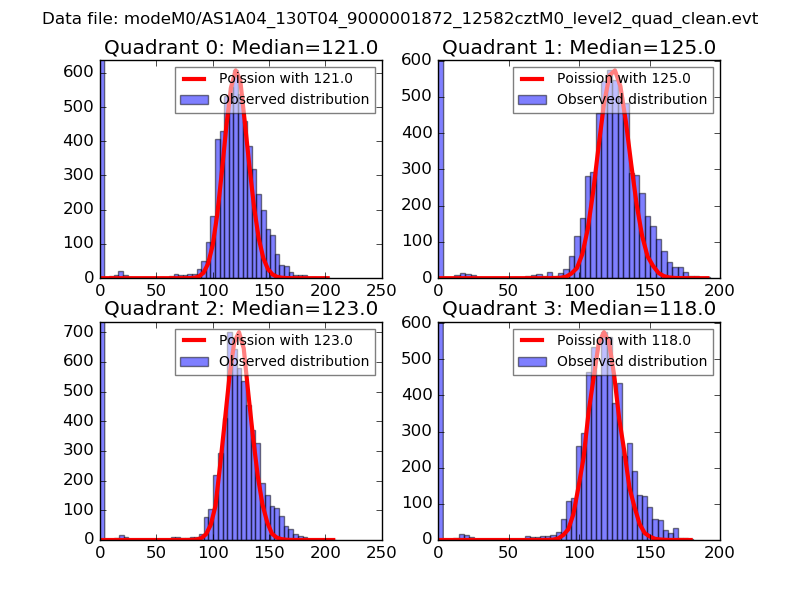 |
 |
| Quadrant-wise count rates Data is divided into 100 sec bins |
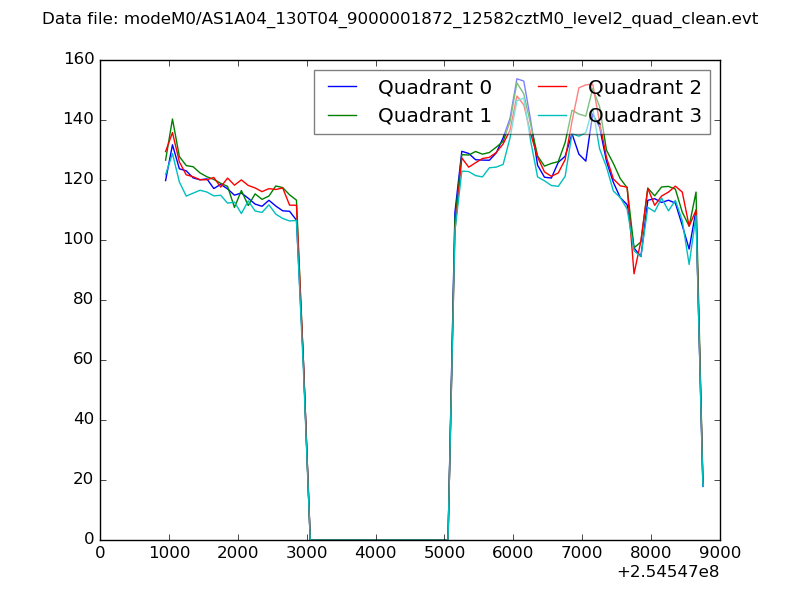 |
|
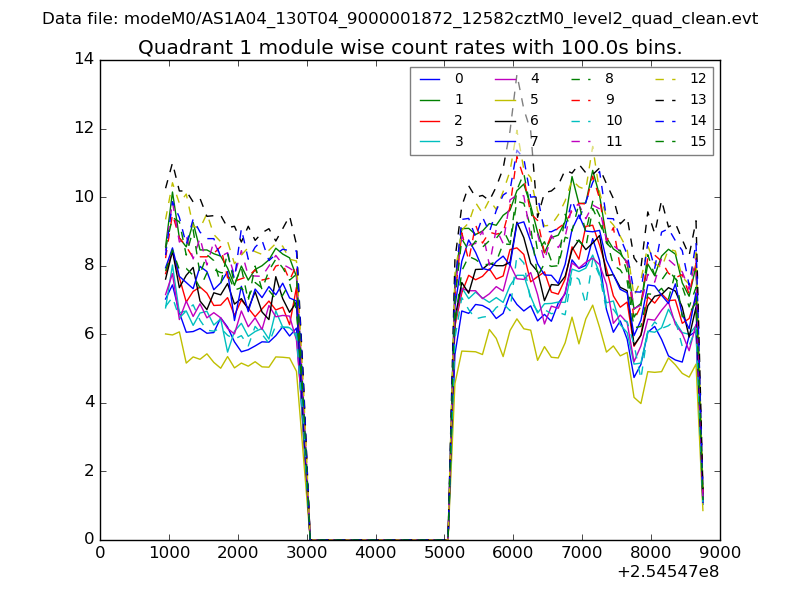
| Module-wise count rates for Quadrant A Data is divided into 100 sec bins |
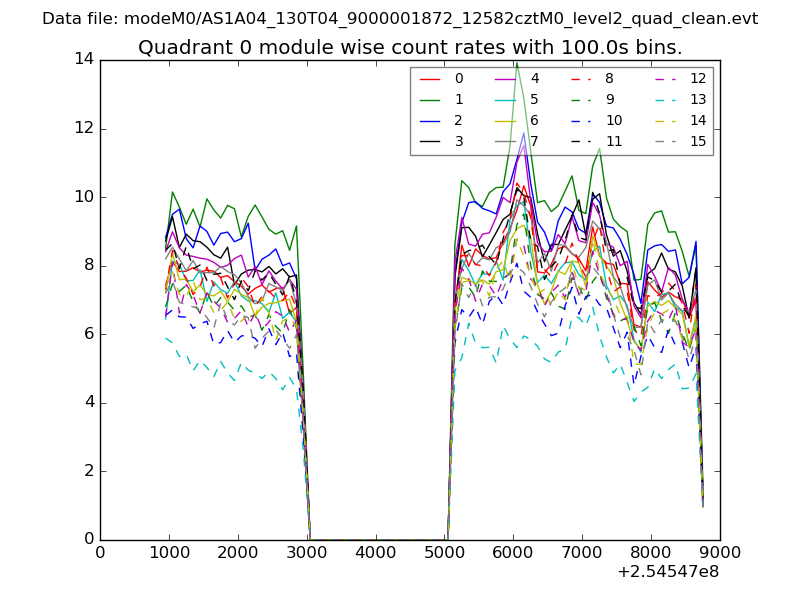 |
 |
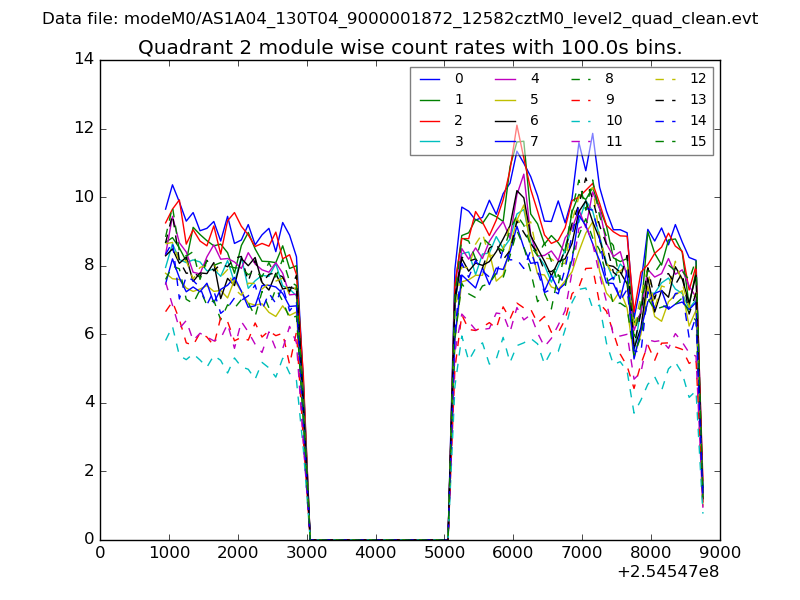
| Module-wise count rates for Quadrant B Data is divided into 100 sec bins |
 |
 |
| Module-wise count rates for Quadrant C Data is divided into 100 sec bins |
 |
 |
| Module-wise count rates for Quadrant D Data is divided into 100 sec bins |
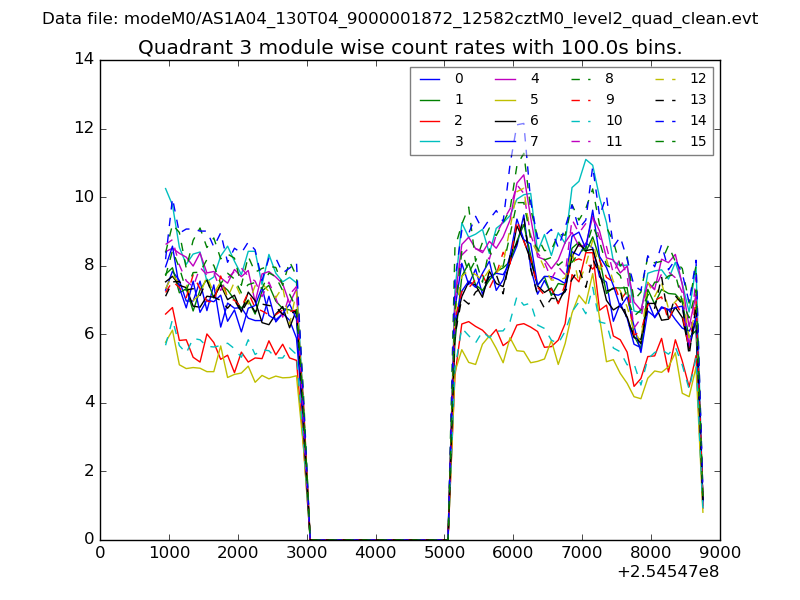 |
 |
| Parameter | Plot |
|---|---|
| CZT HV Monitor | 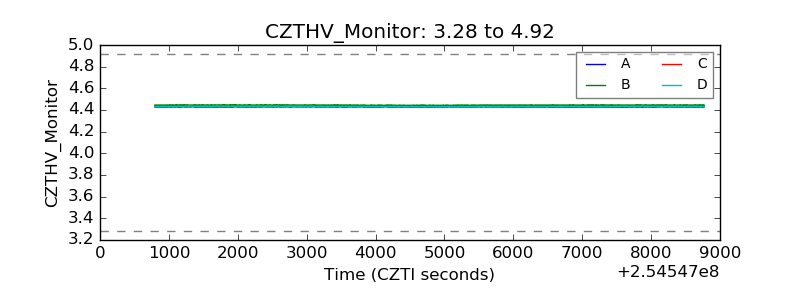 |
| D_VDD |  |
| Temperature 1 |  |
| Veto HV Monitor | 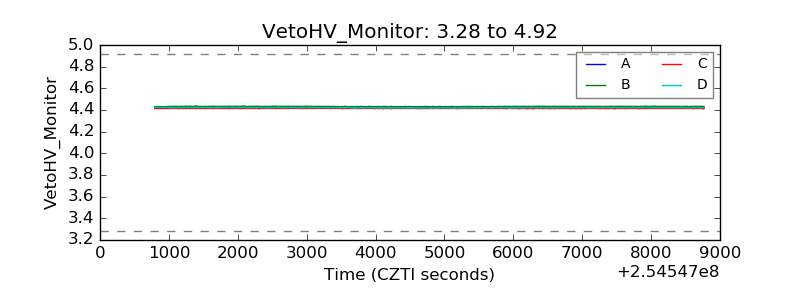 |
| Veto LLD |  |
| Alpha Counter | 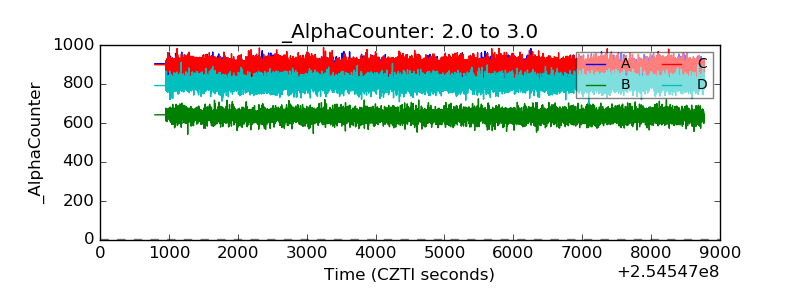 |
| _CPM_Rate | 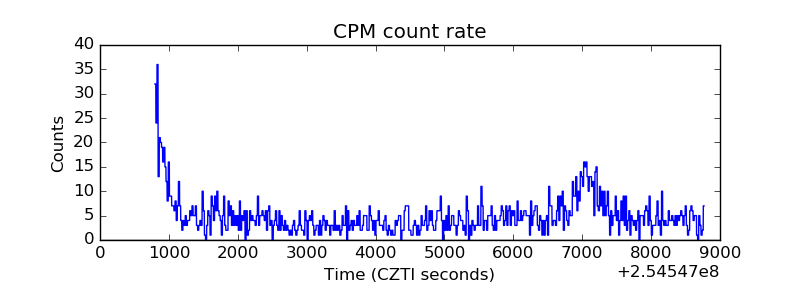 |
| CZT Counter | 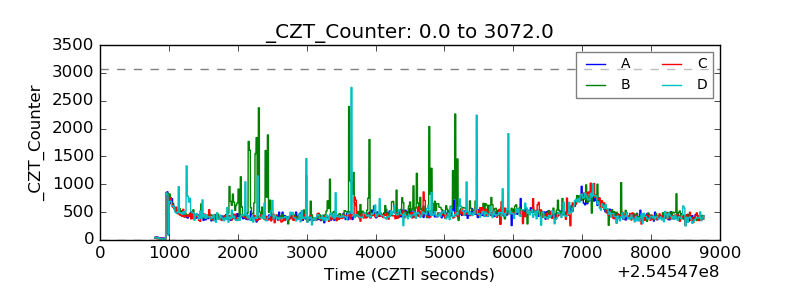 |
| +2.5 Volts monitor |  |
| +5 Volts monitor |  |
| _ROLL_ROT | 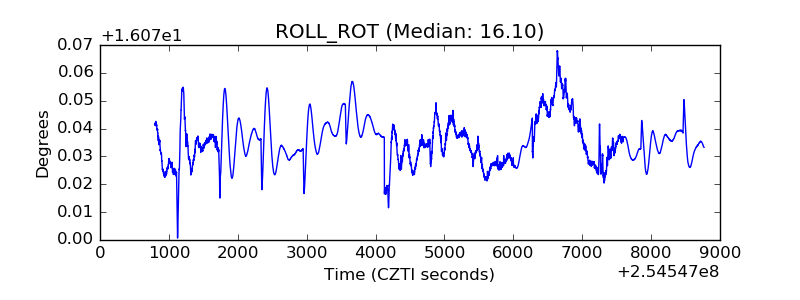 |
| _Roll_DEC | 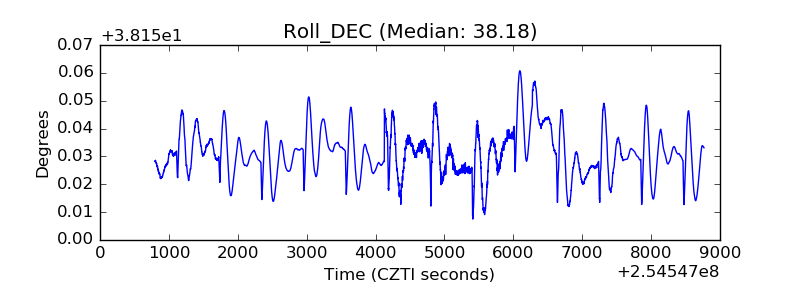 |
| _Roll_RA | 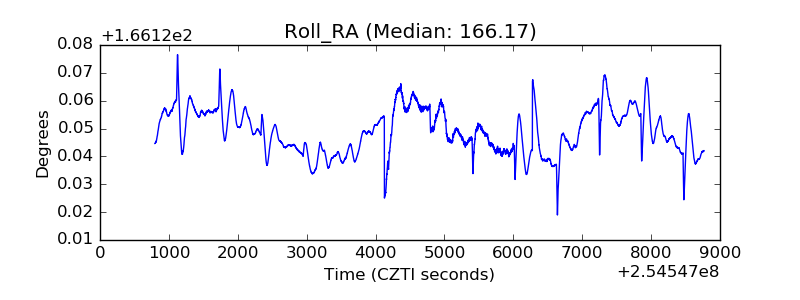 |
| Veto Counter | 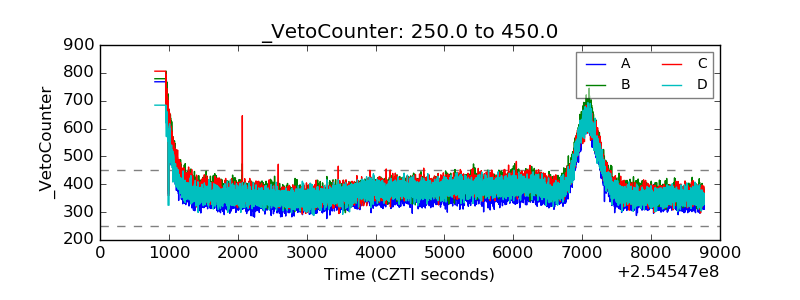 |