| Param | Original file | Final file |
|---|---|---|
| Filename | modeM0/AS1A04_130T04_9000001872_12583cztM0_level2.evt | modeM0/AS1A04_130T04_9000001872_12583cztM0_level2_quad_clean.evt |
| Size (bytes) | 498,214,080 | 93,778,560 |
| Size | 475.1 MB | 89.4 MB |
| Events in quadrant A | 3,363,548 | 583,095 |
| Events in quadrant B | 3,989,513 | 595,235 |
| Events in quadrant C | 3,307,027 | 591,379 |
| Events in quadrant D | 3,934,757 | 564,229 |
| Mode M0 | |||
|---|---|---|---|
| Quadrant | BADHDUFLAG | Total packets | Discarded packets |
| A | 0 | 15015 | 2 |
| B | 0 | 16584 | 1 |
| C | 0 | 15015 | 1 |
| D | 0 | 16855 | 1 |
| Mode SS | |||
|---|---|---|---|
| Quadrant | BADHDUFLAG | Total packets | Discarded packets |
| A | 0 | 146 | 0 |
| B | 0 | 146 | 0 |
| C | 0 | 146 | 0 |
| D | 0 | 146 | 0 |
| Mode M9 | |||
|---|---|---|---|
| Quadrant | BADHDUFLAG | Total packets | Discarded packets |
| A | 0 | 1 | 0 |
| B | 0 | 1 | 0 |
| C | 0 | 1 | 0 |
| D | 0 | 1 | 0 |
| Quadrant | Total seconds | Saturated seconds | Saturation percentage |
|---|---|---|---|
| A | 7265 | 259 | 3.565038% |
| B | 7265 | 348 | 4.790089% |
| C | 7265 | 191 | 2.629043% |
| D | 7265 | 285 | 3.922918% |
Noise dominated data is calculated using 1-second bins in cleaned event files. If a bin has >2000 counts, and if more than 50% of those come from <1% of pixels, then it is considered to be noise-dominated and hence unusable.
| Quadrant | # 1 sec bins | Bins with >0 counts | Bins with >2000 counts | High rate bins dominated by noise | Noise dominated (total time) | Noise dominated (detector-on time) | Marked lightcurve |
|---|---|---|---|---|---|---|---|
| A | 7281 | 7267 | 0 | 0 | 0.00% | 0.00% | 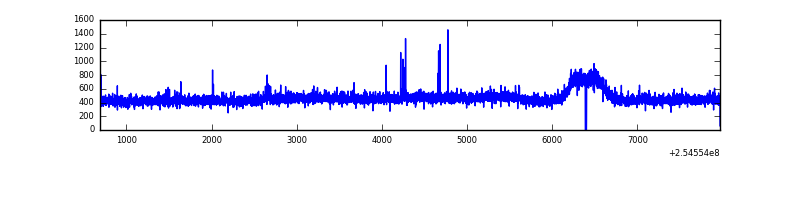 |
| B | 7281 | 7266 | 53 | 53 | 0.73% | 0.73% | 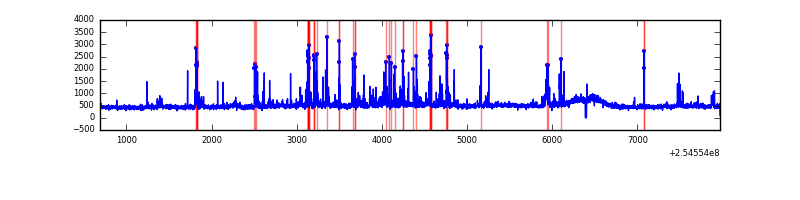 |
| C | 7281 | 7267 | 0 | 0 | 0.00% | 0.00% | 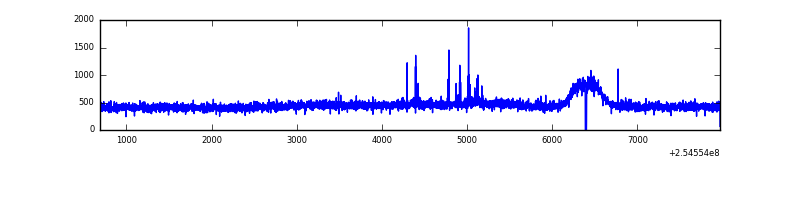 |
| D | 7281 | 7267 | 55 | 55 | 0.76% | 0.76% | 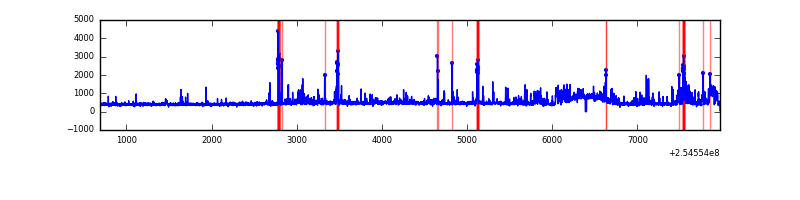 |
Top three noisy pixels from each quadrant. If the there are fewer than three noisy pixels in the level2.evt file, extra rows are filled as -1
| Pixel properties | Quadrant properties | ||||||
|---|---|---|---|---|---|---|---|
| Quadrant | DetID | PixID | Counts | Sigma | Mean | Median | Sigma |
| A | 12 | 189 | 27589 | 150.98 | 861 | 838 | 177.2 |
| A | 12 | 96 | 12493 | 65.78 | 861 | 838 | 177.2 |
| A | 0 | 226 | 7577 | 38.04 | 861 | 838 | 177.2 |
| B | 4 | 239 | 277196 | 1652.05 | 857 | 836 | 167.3 |
| B | 3 | 64 | 227185 | 1353.09 | 857 | 836 | 167.3 |
| B | 11 | 51 | 89627 | 530.78 | 857 | 836 | 167.3 |
| C | 15 | 208 | 25673 | 127.22 | 838 | 838 | 195.2 |
| C | 13 | 61 | 6221 | 27.57 | 838 | 838 | 195.2 |
| C | 12 | 4 | 4129 | 16.86 | 838 | 838 | 195.2 |
| D | 10 | 157 | 487237 | 2386.45 | 835 | 808 | 203.8 |
| D | 1 | 52 | 196973 | 962.4 | 835 | 808 | 203.8 |
| D | 13 | 249 | 49966 | 241.17 | 835 | 808 | 203.8 |
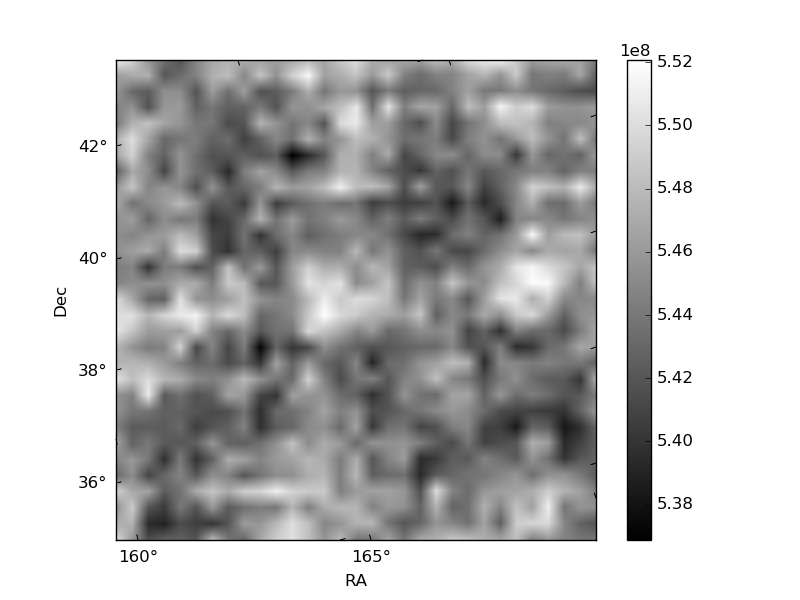
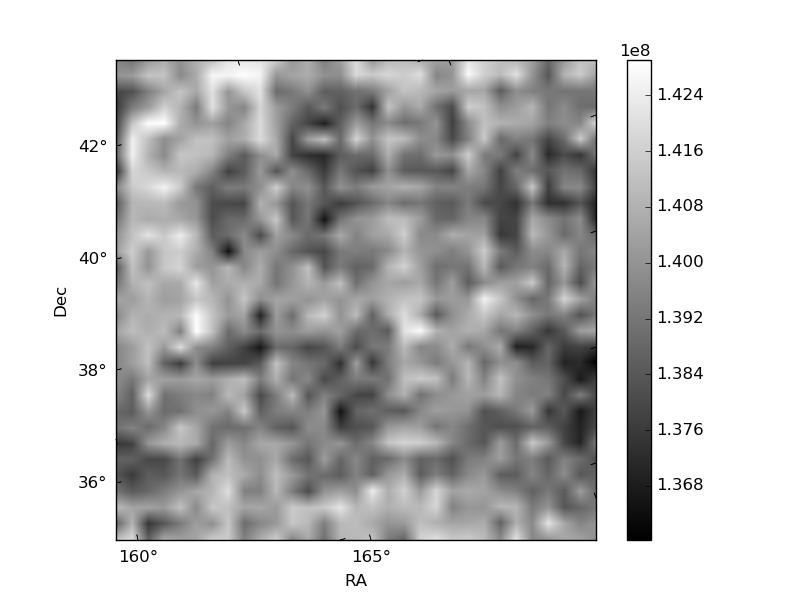
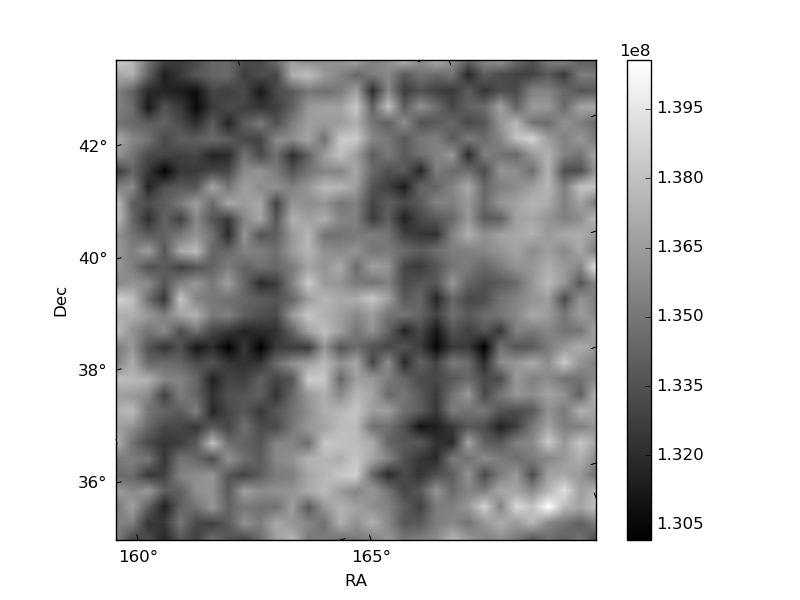
Histogram calculated using DETX and DETY for each event in the final _common_clean file
| Quadrant A | 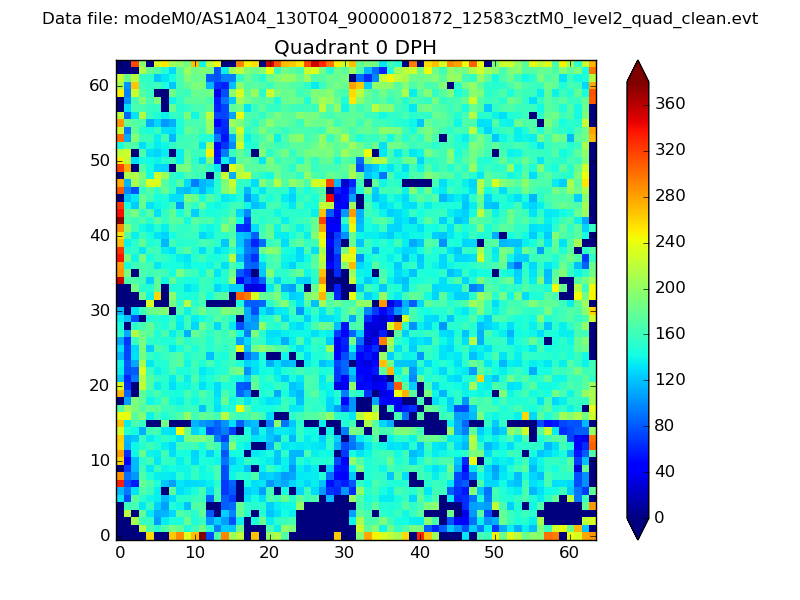 |
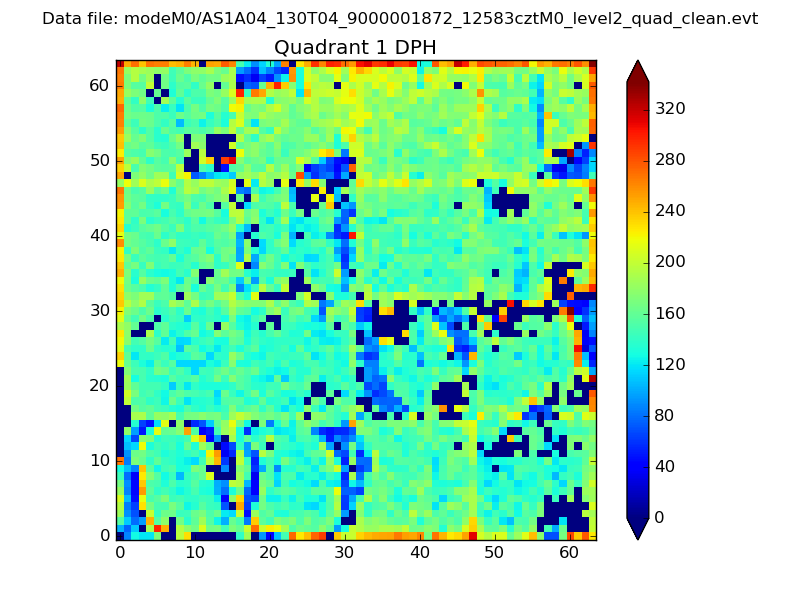 |
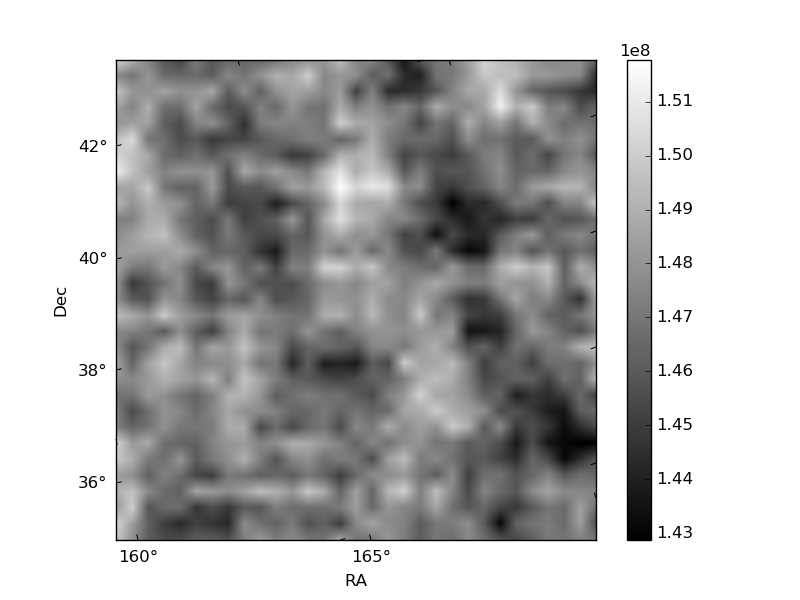
Quadrant B |
|---|---|---|---|
| Quadrant D | 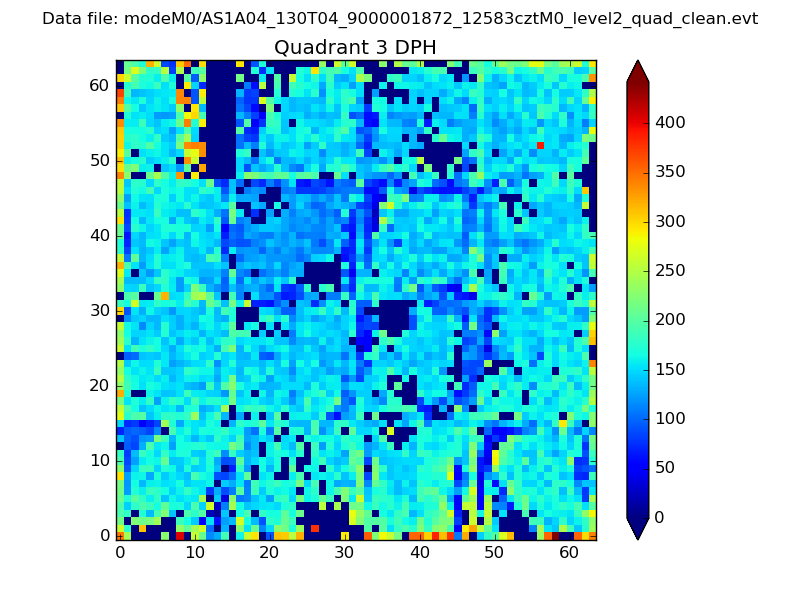 |
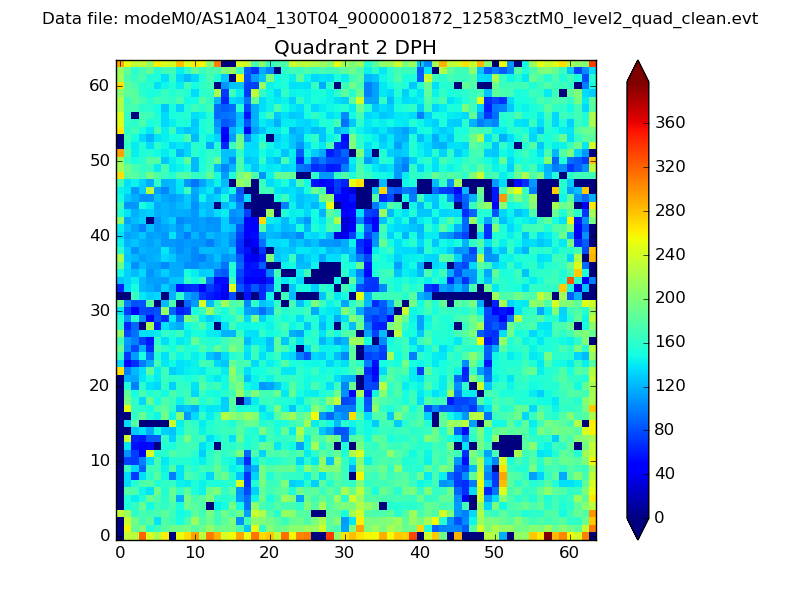 |
Quadrant C |
| Plot type | Count rate plots | Images |
|---|---|---|
| Comparison with Poisson distribution Blue bars denote a histogram of data divided into 1 sec bins. Red curve is a Poisson curve with rate = median count rate of data. |
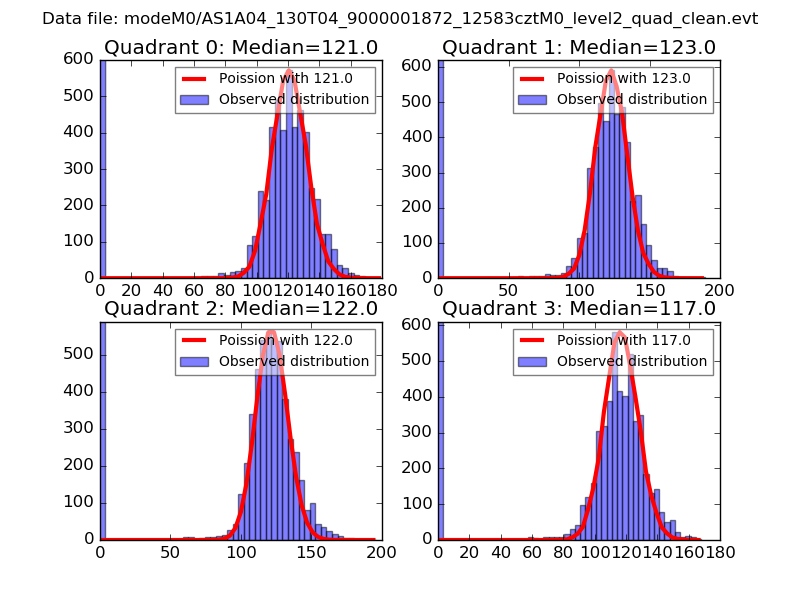 |
 |
| Quadrant-wise count rates Data is divided into 100 sec bins |
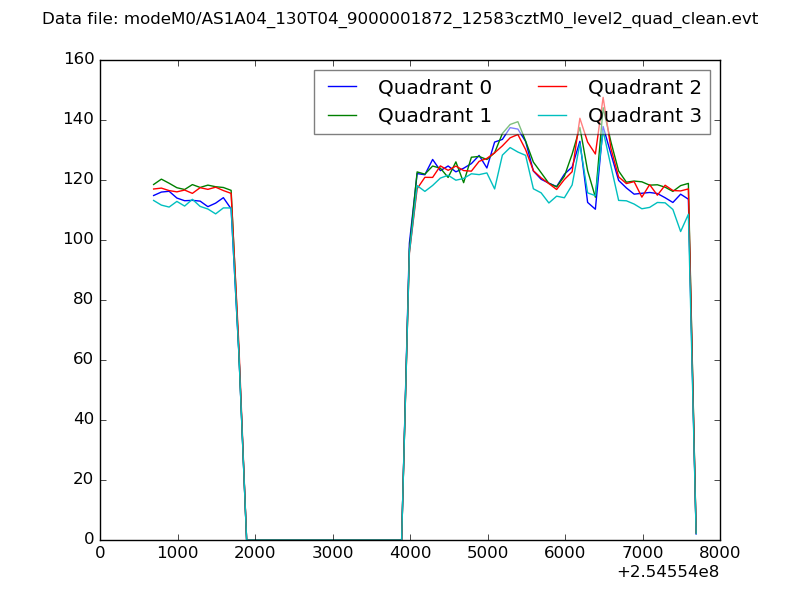 |
|
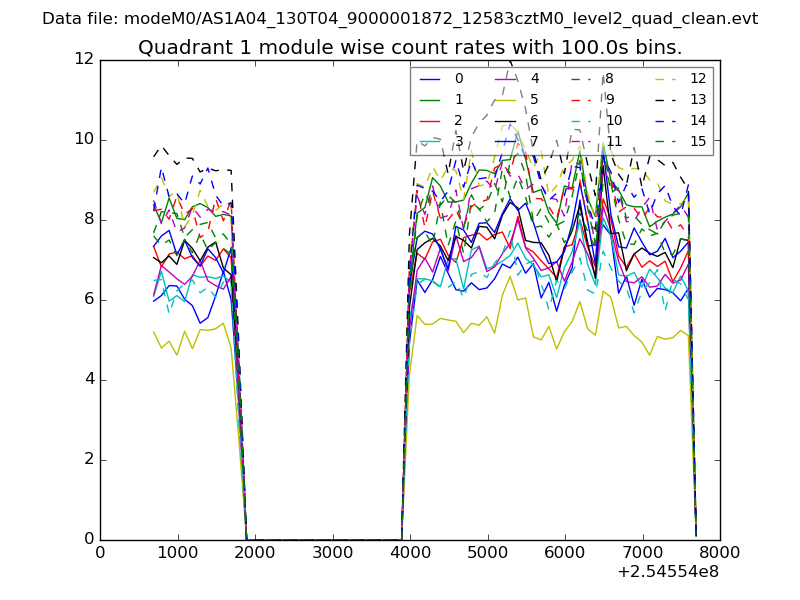
| Module-wise count rates for Quadrant A Data is divided into 100 sec bins |
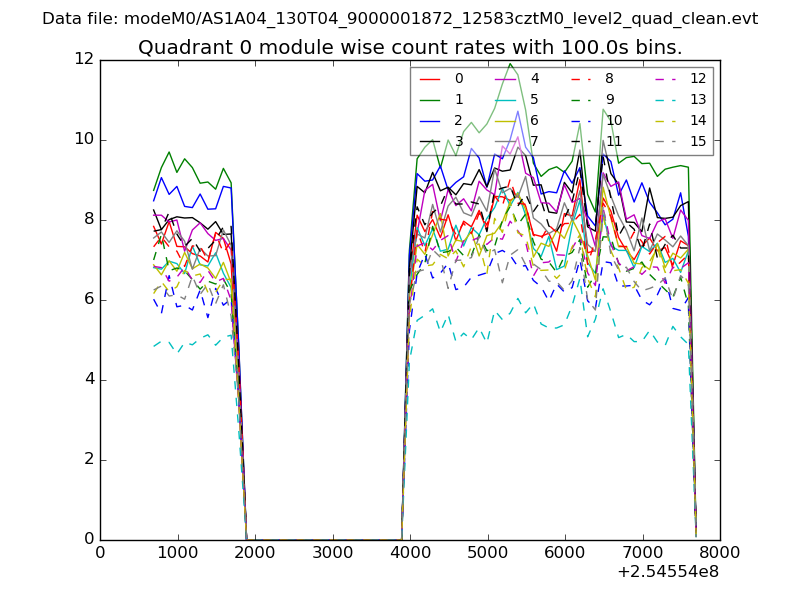 |
 |
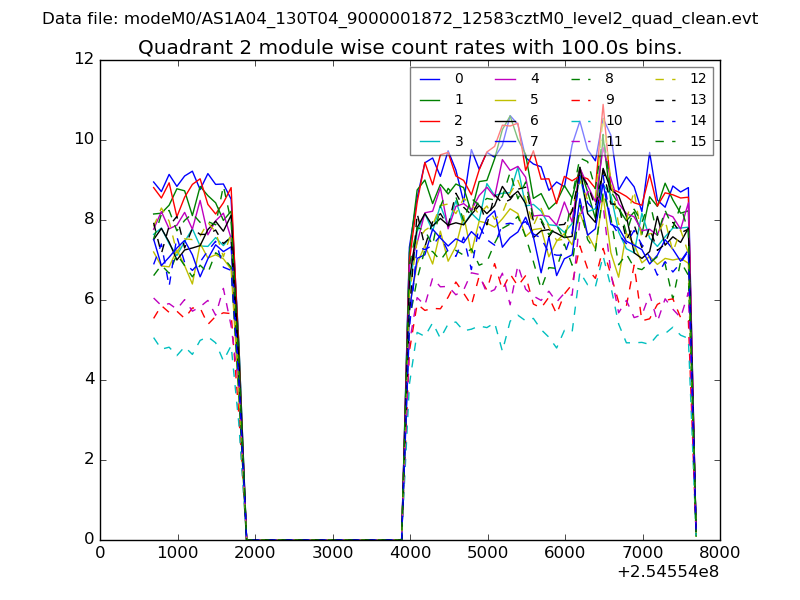
| Module-wise count rates for Quadrant B Data is divided into 100 sec bins |
 |
 |
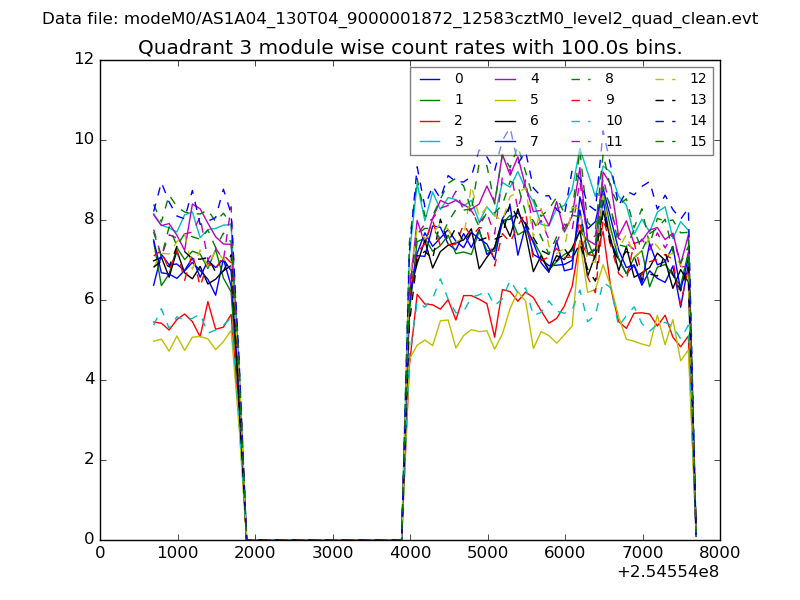
| Module-wise count rates for Quadrant C Data is divided into 100 sec bins |
 |
 |
| Module-wise count rates for Quadrant D Data is divided into 100 sec bins |
 |
 |
| Parameter | Plot |
|---|---|
| CZT HV Monitor | 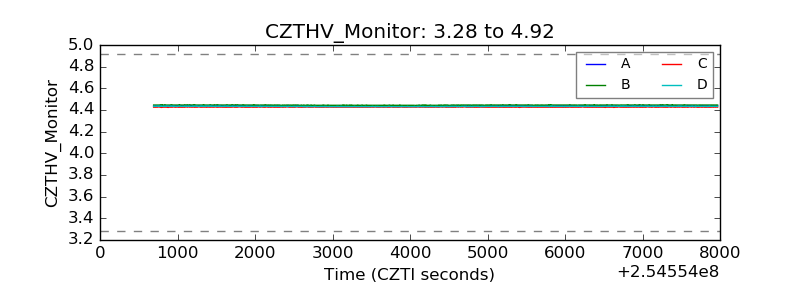 |
| D_VDD | 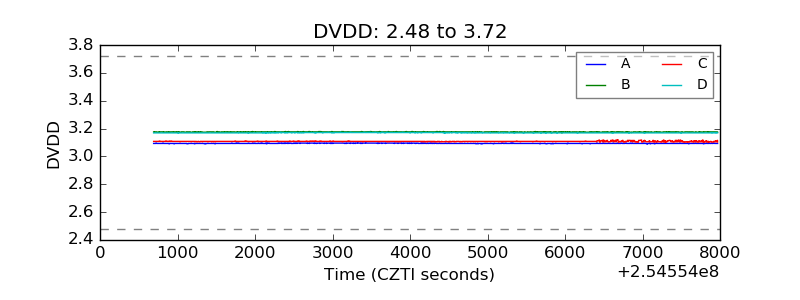 |
| Temperature 1 | 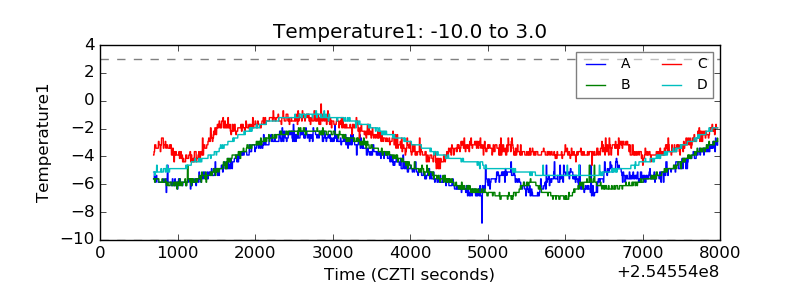 |
| Veto HV Monitor | 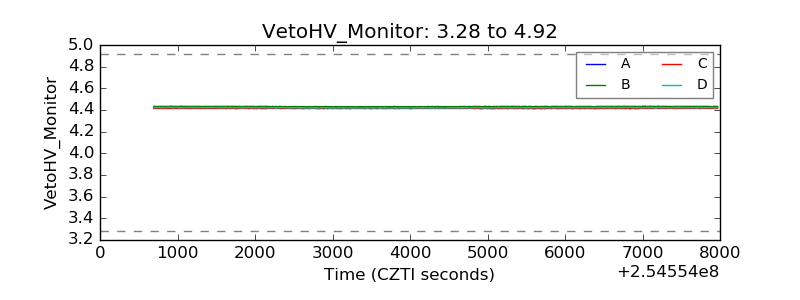 |
| Veto LLD |  |
| Alpha Counter | 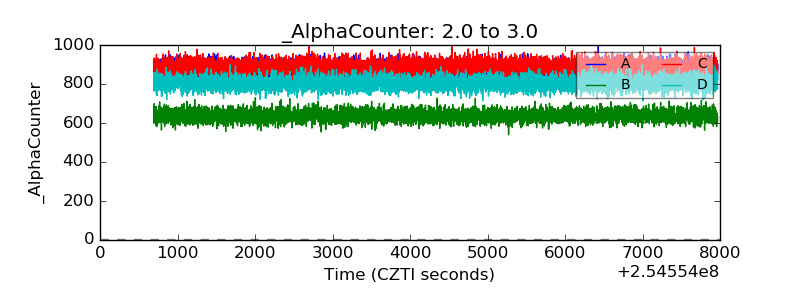 |
| _CPM_Rate | 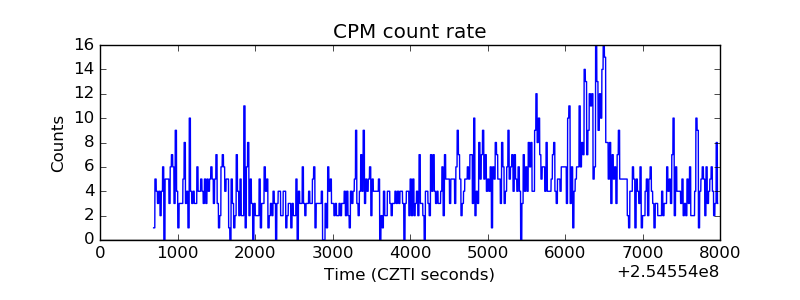 |
| CZT Counter | 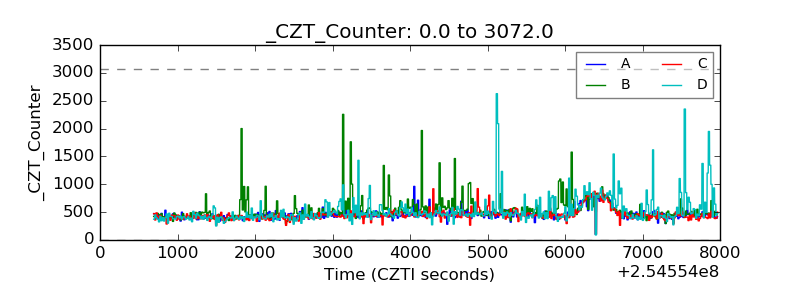 |
| +2.5 Volts monitor |  |
| +5 Volts monitor |  |
| _ROLL_ROT | 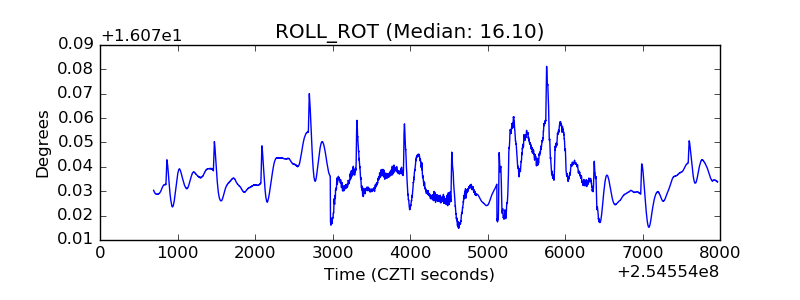 |
| _Roll_DEC | 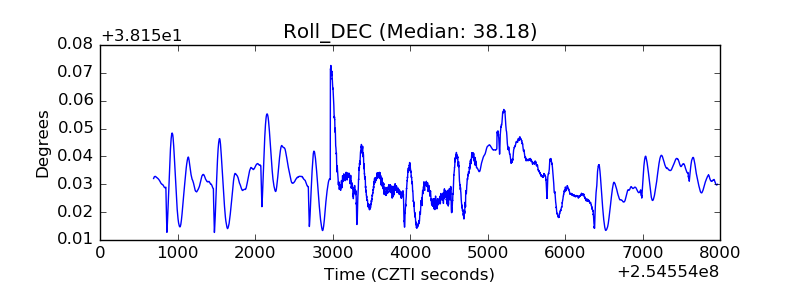 |
| _Roll_RA | 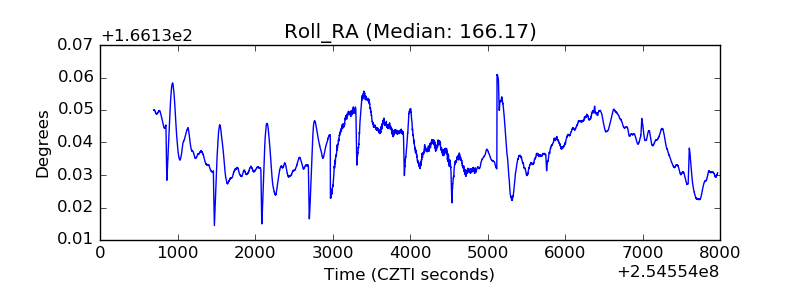 |
| Veto Counter | 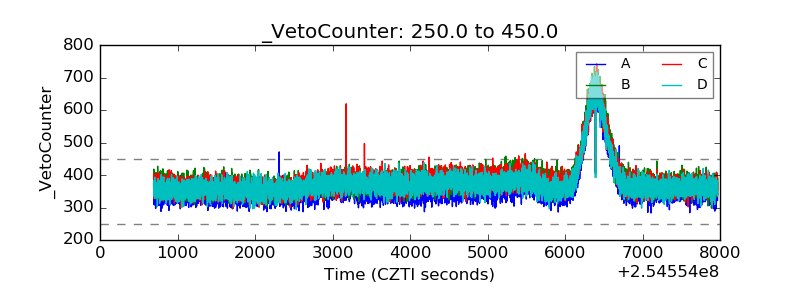 |