| Param | Original file | Final file |
|---|---|---|
| Filename | modeM0/AS1A04_130T04_9000001872_12586cztM0_level2.evt | modeM0/AS1A04_130T04_9000001872_12586cztM0_level2_quad_clean.evt |
| Size (bytes) | 312,520,320 | 39,286,080 |
| Size | 298.0 MB | 37.5 MB |
| Events in quadrant A | 1,822,151 | 229,062 |
| Events in quadrant B | 2,517,471 | 230,075 |
| Events in quadrant C | 1,776,404 | 229,408 |
| Events in quadrant D | 3,069,729 | 212,248 |
| Mode M0 | |||
|---|---|---|---|
| Quadrant | BADHDUFLAG | Total packets | Discarded packets |
| A | 0 | 8225 | 0 |
| B | 0 | 10073 | 0 |
| C | 0 | 8184 | 0 |
| D | 0 | 11982 | 0 |
| Mode SS | |||
|---|---|---|---|
| Quadrant | BADHDUFLAG | Total packets | Discarded packets |
| A | 0 | 82 | 0 |
| B | 0 | 82 | 0 |
| C | 0 | 82 | 0 |
| D | 0 | 82 | 0 |
| Quadrant | Total seconds | Saturated seconds | Saturation percentage |
|---|---|---|---|
| A | 4087 | 1 | 0.024468% |
| B | 4087 | 116 | 2.838268% |
| C | 4087 | 1 | 0.024468% |
| D | 4087 | 349 | 8.539271% |
Noise dominated data is calculated using 1-second bins in cleaned event files. If a bin has >2000 counts, and if more than 50% of those come from <1% of pixels, then it is considered to be noise-dominated and hence unusable.
| Quadrant | # 1 sec bins | Bins with >0 counts | Bins with >2000 counts | High rate bins dominated by noise | Noise dominated (total time) | Noise dominated (detector-on time) | Marked lightcurve |
|---|---|---|---|---|---|---|---|
| A | 4088 | 4088 | 1 | 1 | 0.02% | 0.02% | 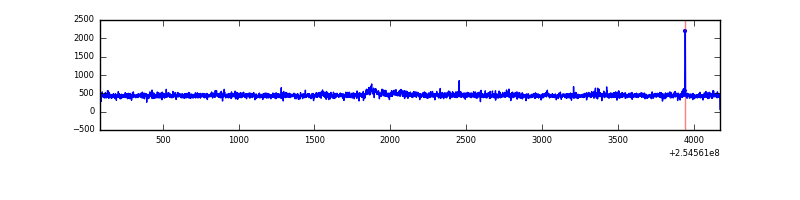 |
| B | 4088 | 4088 | 85 | 85 | 2.08% | 2.08% | 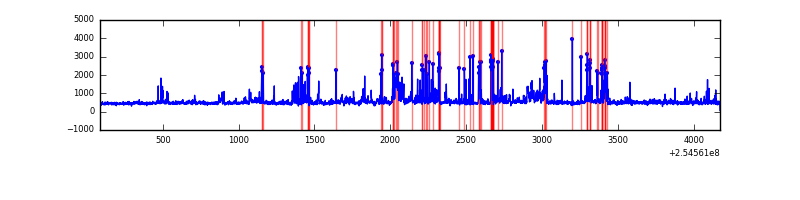 |
| C | 4088 | 4088 | 0 | 0 | 0.00% | 0.00% | 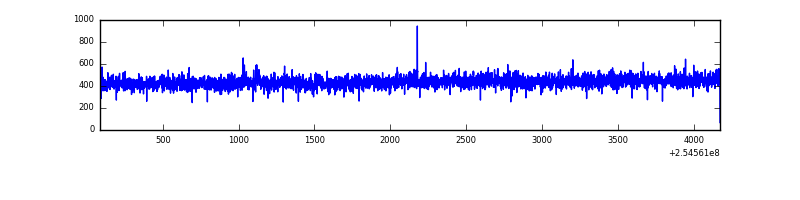 |
| D | 4088 | 4088 | 310 | 310 | 7.58% | 7.58% | 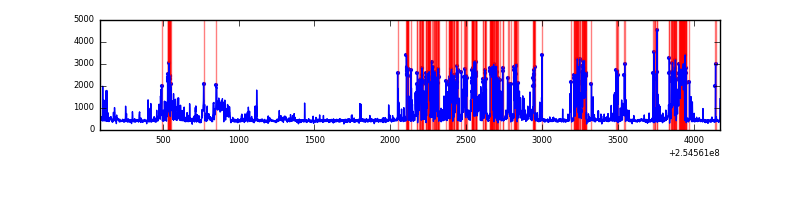 |
Top three noisy pixels from each quadrant. If the there are fewer than three noisy pixels in the level2.evt file, extra rows are filled as -1
| Pixel properties | Quadrant properties | ||||||
|---|---|---|---|---|---|---|---|
| Quadrant | DetID | PixID | Counts | Sigma | Mean | Median | Sigma |
| A | 12 | 189 | 26751 | 271.8 | 464 | 453 | 96.8 |
| A | 12 | 96 | 8796 | 86.23 | 464 | 453 | 96.8 |
| A | 0 | 226 | 4102 | 37.71 | 464 | 453 | 96.8 |
| B | 3 | 64 | 295867 | 3256.95 | 458 | 446 | 90.7 |
| B | 4 | 239 | 285839 | 3146.39 | 458 | 446 | 90.7 |
| B | 11 | 51 | 95197 | 1044.61 | 458 | 446 | 90.7 |
| C | 8 | 128 | 7838 | 69.86 | 450 | 451 | 105.7 |
| C | 15 | 208 | 6823 | 60.26 | 450 | 451 | 105.7 |
| C | 8 | 112 | 4036 | 33.9 | 450 | 451 | 105.7 |
| D | 10 | 157 | 532603 | 5028.88 | 433 | 421 | 105.8 |
| D | 13 | 249 | 511879 | 4833.05 | 433 | 421 | 105.8 |
| D | 1 | 52 | 354043 | 3341.57 | 433 | 421 | 105.8 |
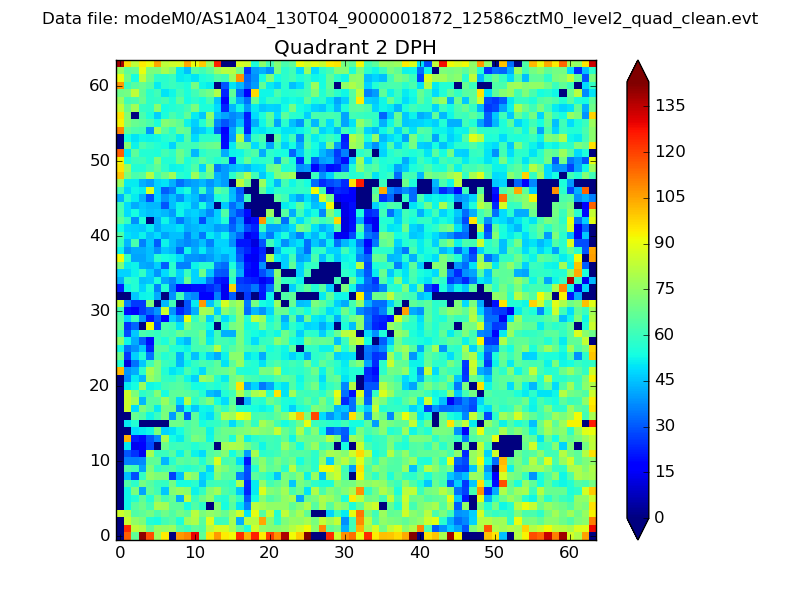
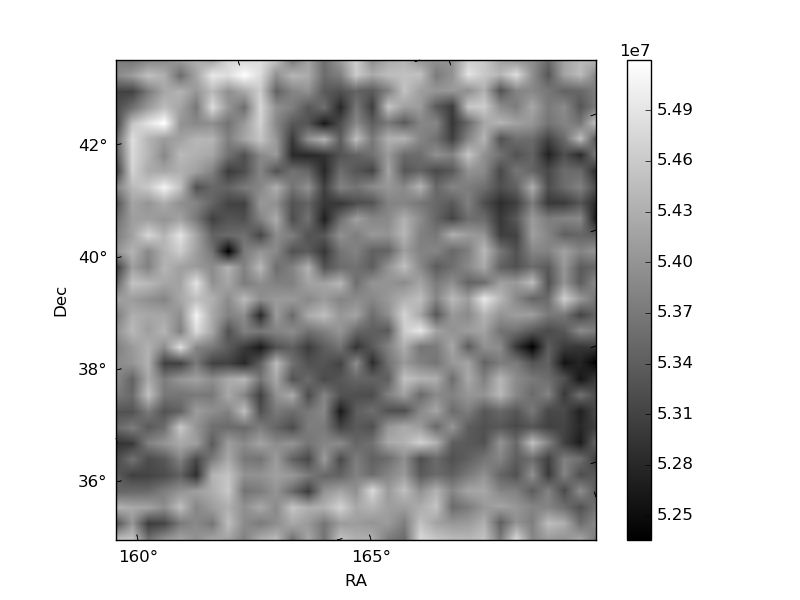
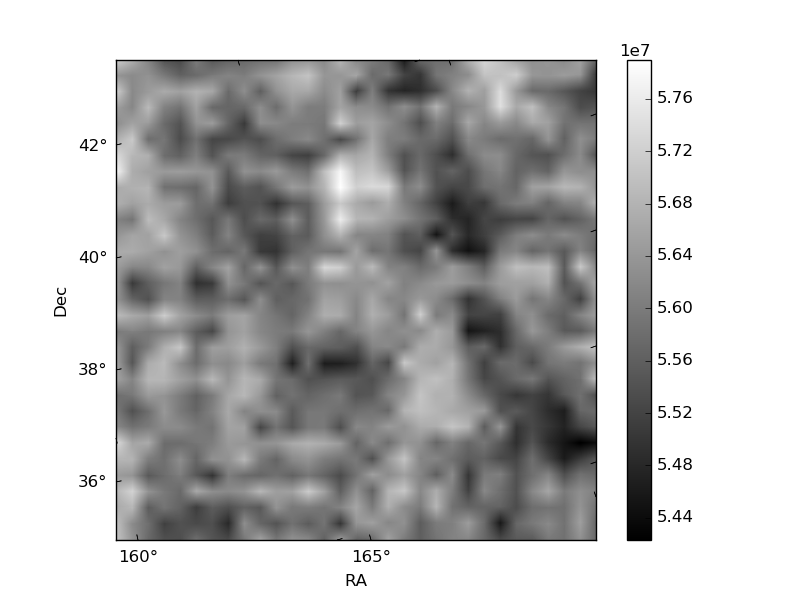
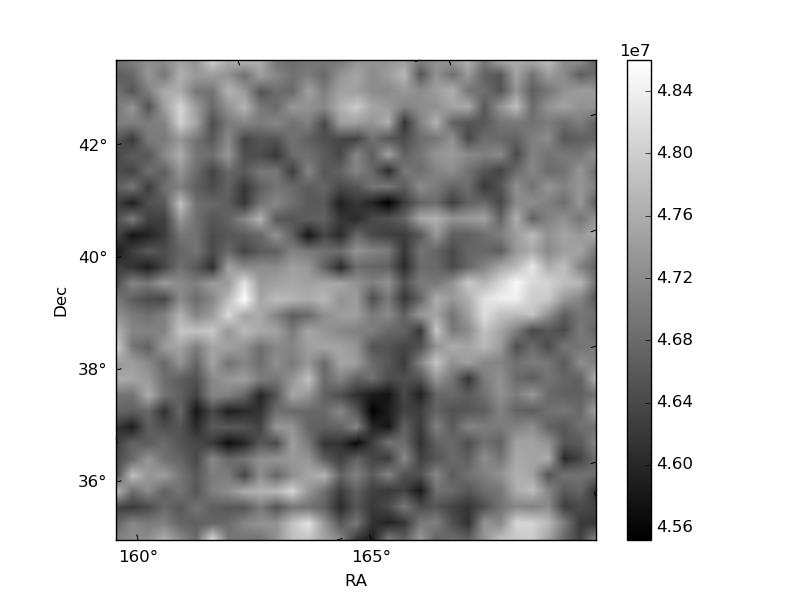
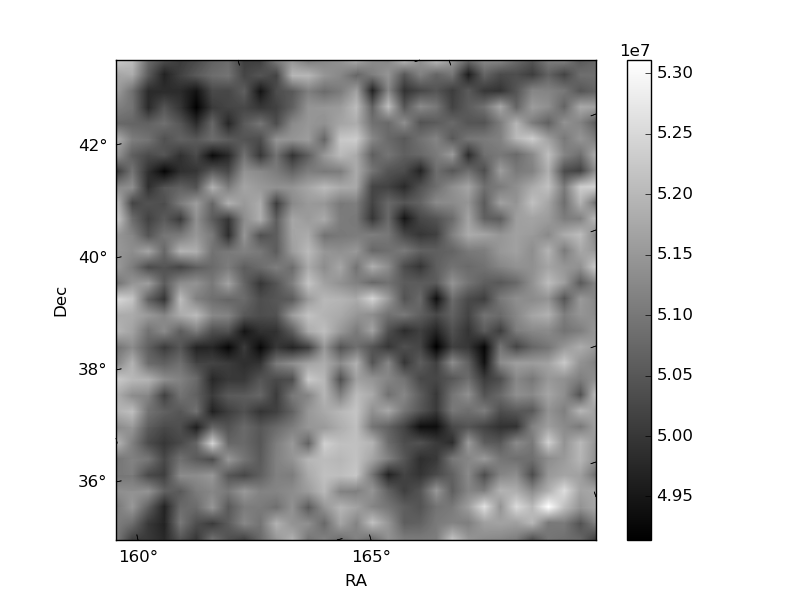
Histogram calculated using DETX and DETY for each event in the final _common_clean file
| Quadrant A |  |
 |
Quadrant B |
|---|---|---|---|
| Quadrant D | 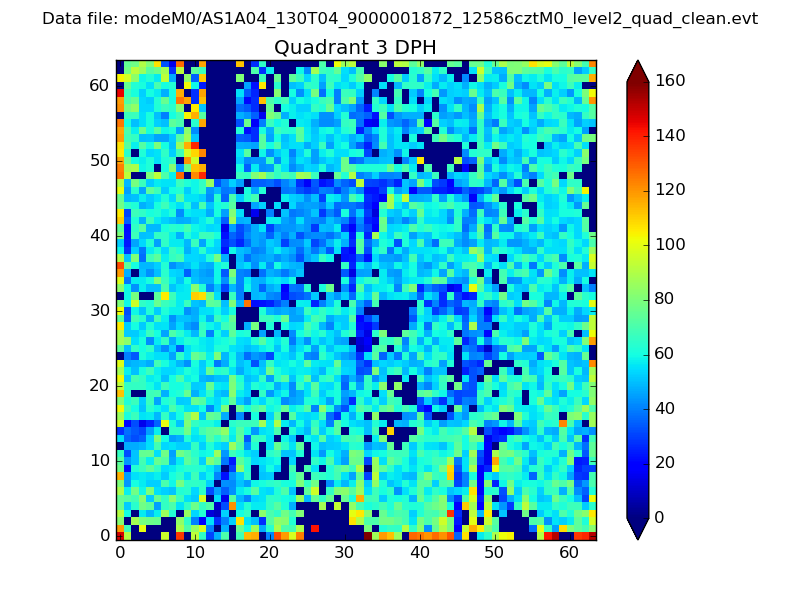 |
 |
Quadrant C |
| Plot type | Count rate plots | Images |
|---|---|---|
| Comparison with Poisson distribution Blue bars denote a histogram of data divided into 1 sec bins. Red curve is a Poisson curve with rate = median count rate of data. |
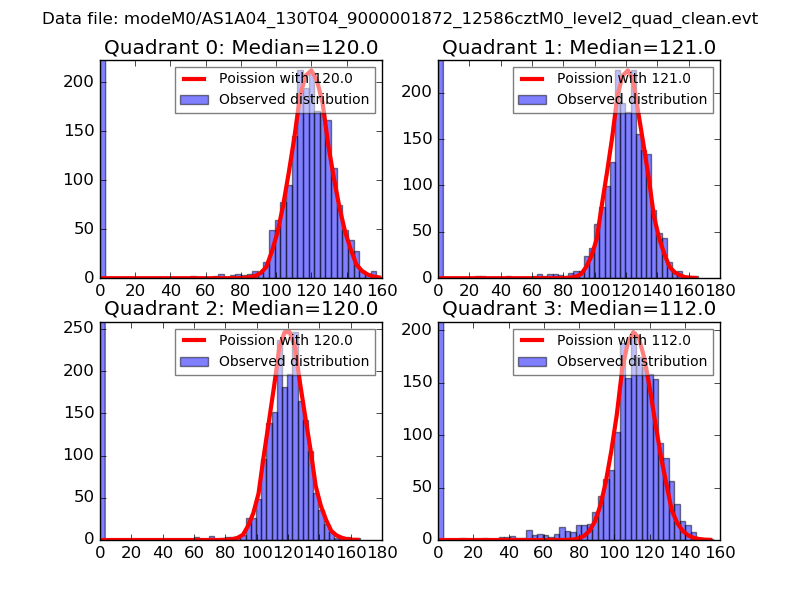 |
 |
| Quadrant-wise count rates Data is divided into 100 sec bins |
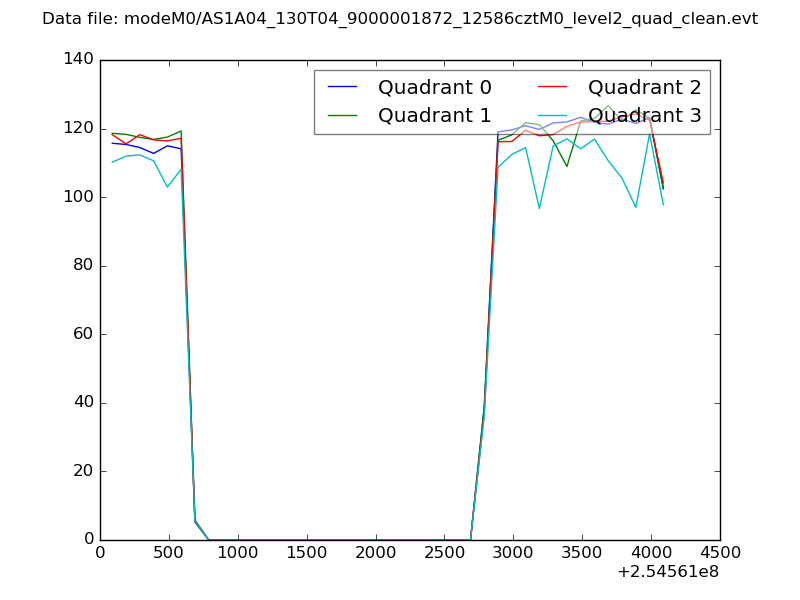 |
|
| Module-wise count rates for Quadrant A Data is divided into 100 sec bins |
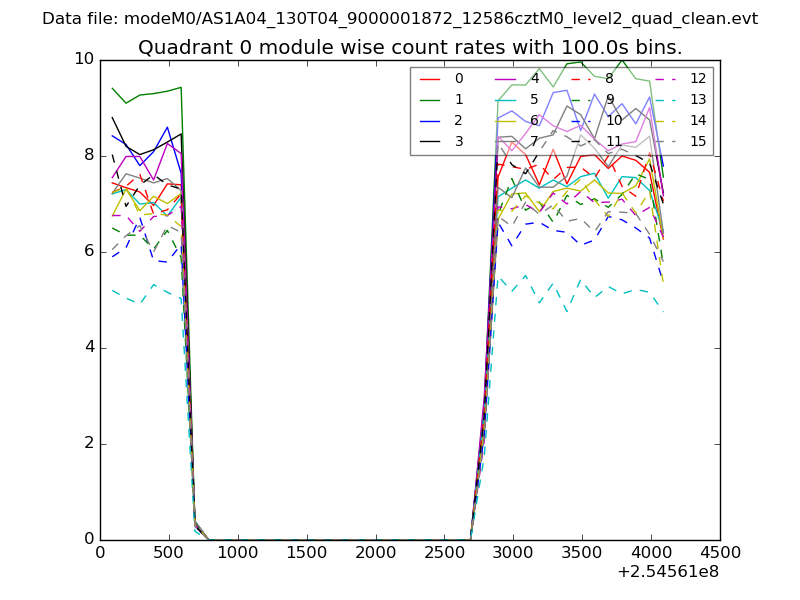 |
 |
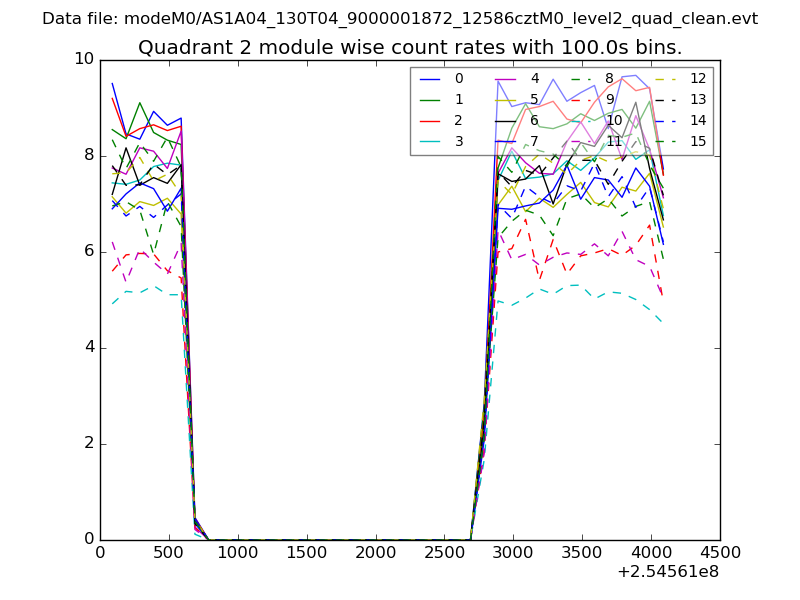
| Module-wise count rates for Quadrant B Data is divided into 100 sec bins |
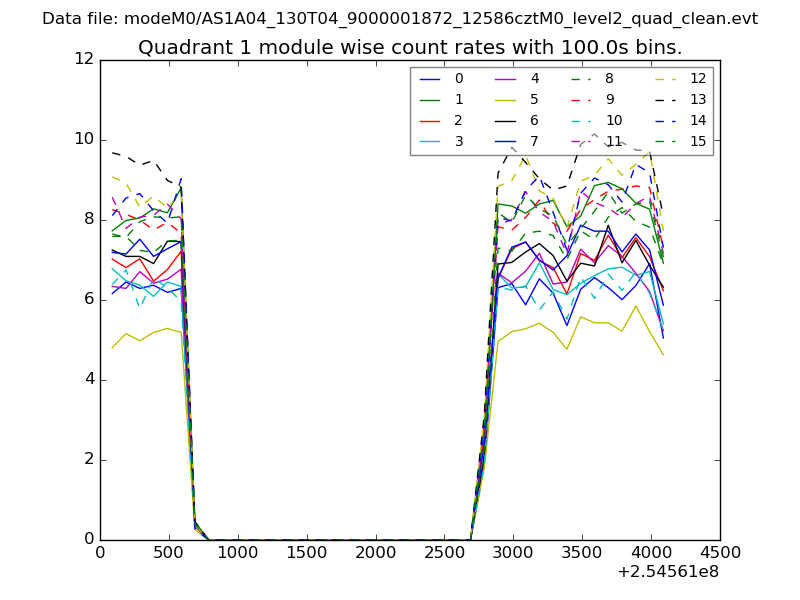 |
 |
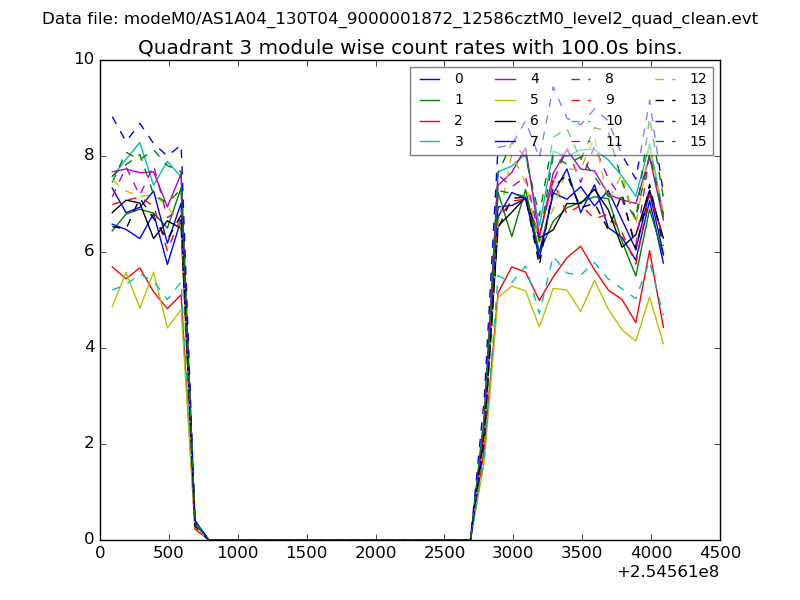
| Module-wise count rates for Quadrant C Data is divided into 100 sec bins |
 |
 |
| Module-wise count rates for Quadrant D Data is divided into 100 sec bins |
 |
 |
| Parameter | Plot |
|---|---|
| CZT HV Monitor | 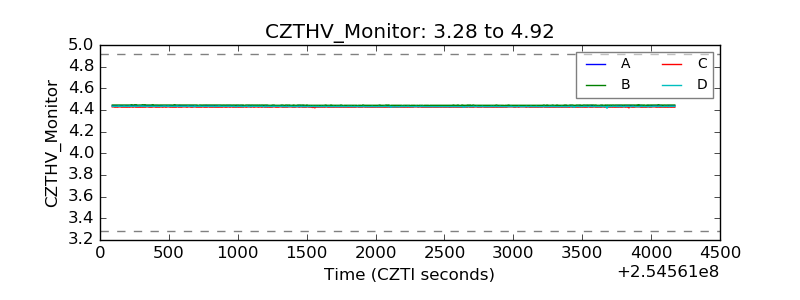 |
| D_VDD | 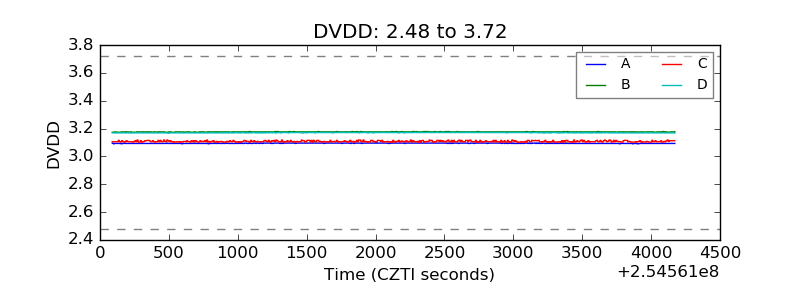 |
| Temperature 1 | 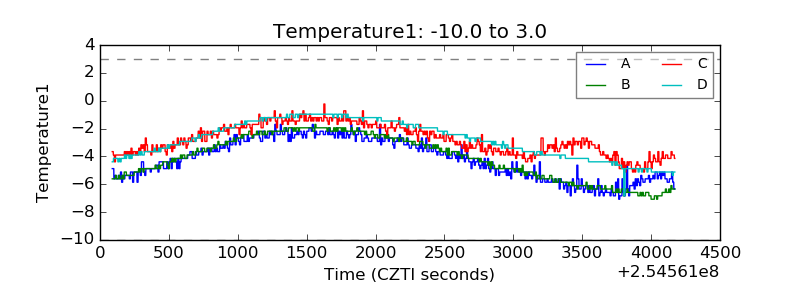 |
| Veto HV Monitor | 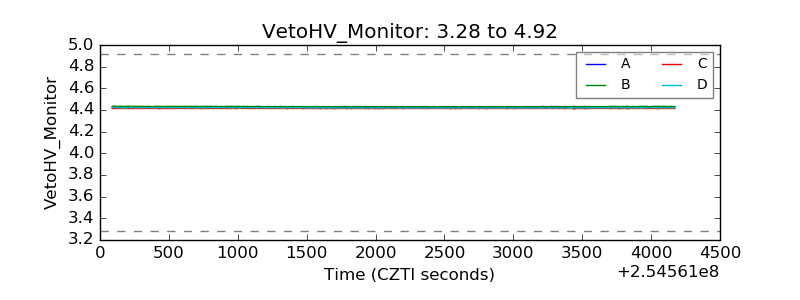 |
| Veto LLD | 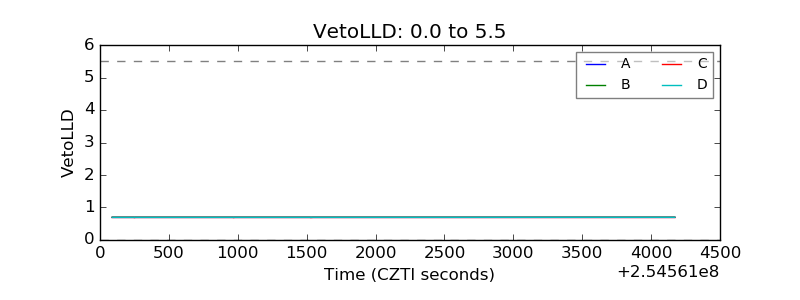 |
| Alpha Counter | 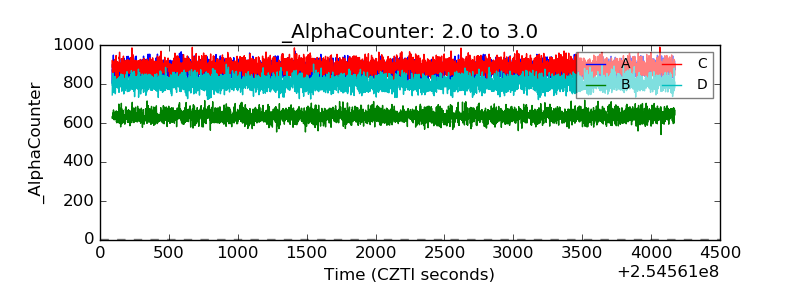 |
| _CPM_Rate | 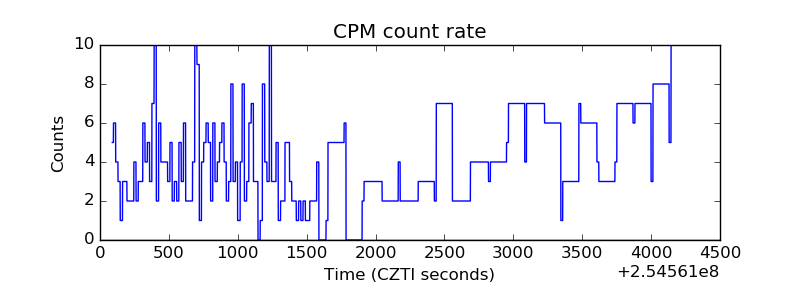 |
| CZT Counter | 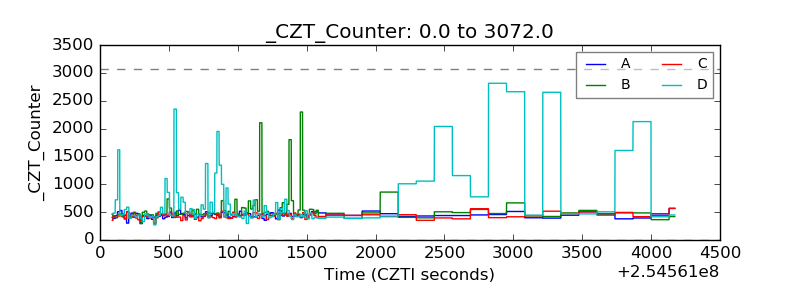 |
| +2.5 Volts monitor |  |
| +5 Volts monitor |  |
| _ROLL_ROT | 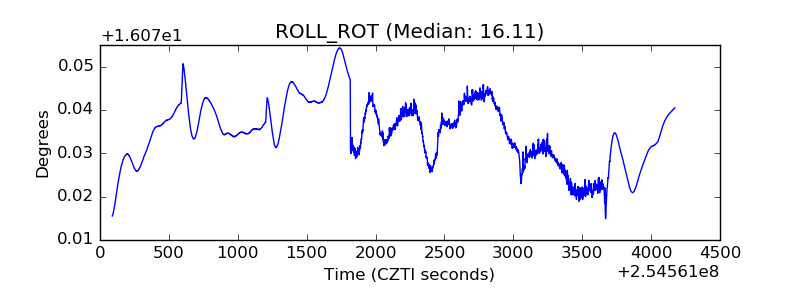 |
| _Roll_DEC | 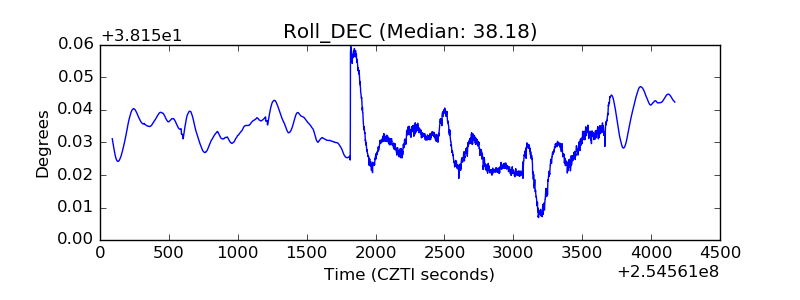 |
| _Roll_RA | 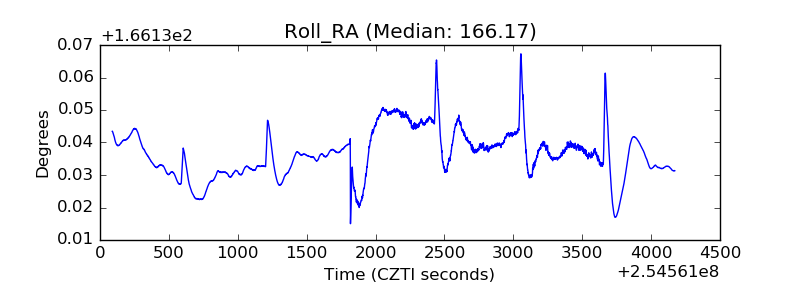 |
| Veto Counter | 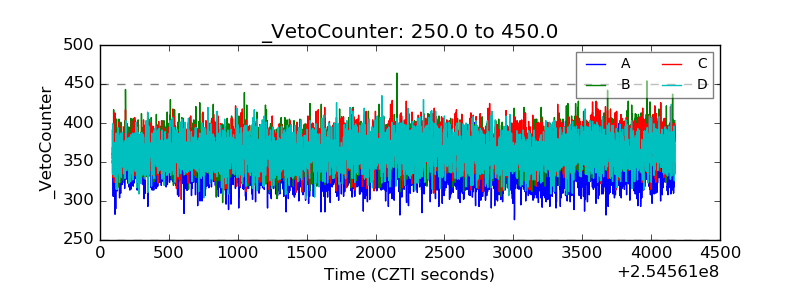 |