| Param | Original file | Final file |
|---|---|---|
| Filename | modeM0/AS1A04_212T03_9000001866_12571cztM0_level2.evt | modeM0/AS1A04_212T03_9000001866_12571cztM0_level2_quad_clean.evt |
| Size (bytes) | 720,529,920 | 129,395,520 |
| Size | 687.2 MB | 123.4 MB |
| Events in quadrant A | 5,162,141 | 793,796 |
| Events in quadrant B | 5,360,104 | 805,372 |
| Events in quadrant C | 5,062,870 | 789,891 |
| Events in quadrant D | 5,478,951 | 756,804 |
| Mode M0 | |||
|---|---|---|---|
| Quadrant | BADHDUFLAG | Total packets | Discarded packets |
| A | 0 | 22805 | 3 |
| B | 0 | 23062 | 2 |
| C | 0 | 22854 | 2 |
| D | 0 | 24012 | 2 |
| Mode SS | |||
|---|---|---|---|
| Quadrant | BADHDUFLAG | Total packets | Discarded packets |
| A | 0 | 228 | 0 |
| B | 0 | 228 | 0 |
| C | 0 | 228 | 0 |
| D | 0 | 228 | 0 |
| Mode M9 | |||
|---|---|---|---|
| Quadrant | BADHDUFLAG | Total packets | Discarded packets |
| A | 0 | 11 | 0 |
| B | 0 | 11 | 0 |
| C | 0 | 11 | 0 |
| D | 0 | 11 | 0 |
| Quadrant | Total seconds | Saturated seconds | Saturation percentage |
|---|---|---|---|
| A | 11164 | 98 | 0.877822% |
| B | 11164 | 92 | 0.824077% |
| C | 11164 | 78 | 0.698674% |
| D | 11164 | 147 | 1.316732% |
Noise dominated data is calculated using 1-second bins in cleaned event files. If a bin has >2000 counts, and if more than 50% of those come from <1% of pixels, then it is considered to be noise-dominated and hence unusable.
| Quadrant | # 1 sec bins | Bins with >0 counts | Bins with >2000 counts | High rate bins dominated by noise | Noise dominated (total time) | Noise dominated (detector-on time) | Marked lightcurve |
|---|---|---|---|---|---|---|---|
| A | 12315 | 11166 | 19 | 19 | 0.15% | 0.17% | 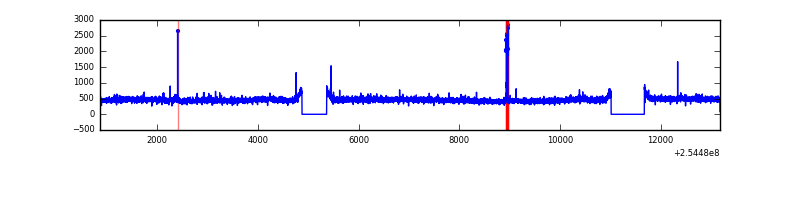 |
| B | 12315 | 11165 | 1 | 1 | 0.01% | 0.01% | 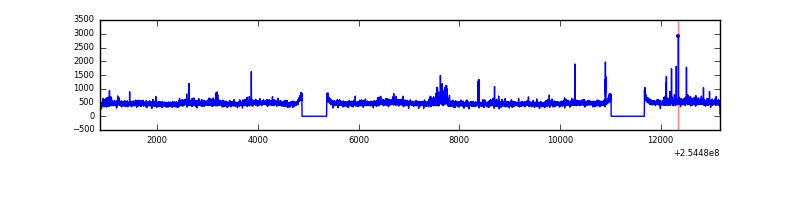 |
| C | 12315 | 11166 | 10 | 10 | 0.08% | 0.09% | 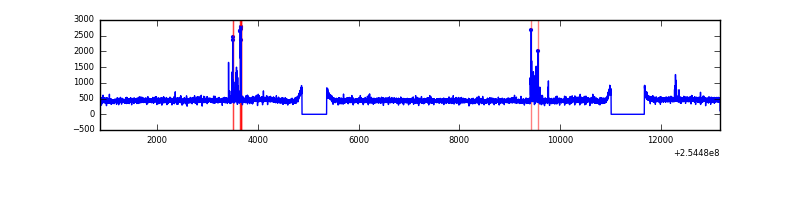 |
| D | 12315 | 11166 | 79 | 79 | 0.64% | 0.71% | 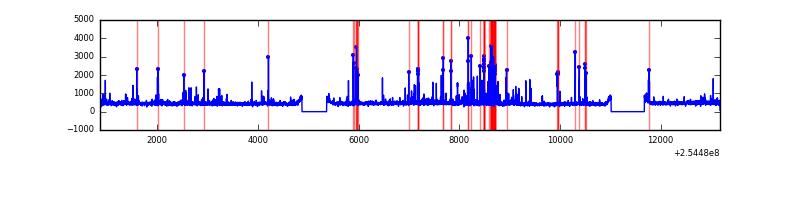 |
Top three noisy pixels from each quadrant. If the there are fewer than three noisy pixels in the level2.evt file, extra rows are filled as -1
| Pixel properties | Quadrant properties | ||||||
|---|---|---|---|---|---|---|---|
| Quadrant | DetID | PixID | Counts | Sigma | Mean | Median | Sigma |
| A | 13 | 248 | 50054 | 180.5 | 1309 | 1280 | 270.2 |
| A | 12 | 189 | 49865 | 179.8 | 1309 | 1280 | 270.2 |
| A | 3 | 1 | 15977 | 54.39 | 1309 | 1280 | 270.2 |
| B | 11 | 51 | 84209 | 330.79 | 1309 | 1275 | 250.7 |
| B | 0 | 214 | 67018 | 262.22 | 1309 | 1275 | 250.7 |
| B | 0 | 230 | 57335 | 223.6 | 1309 | 1275 | 250.7 |
| C | 15 | 208 | 104867 | 353.28 | 1265 | 1270 | 293.2 |
| C | 14 | 234 | 9868 | 29.32 | 1265 | 1270 | 293.2 |
| C | 13 | 61 | 9204 | 27.06 | 1265 | 1270 | 293.2 |
| D | 1 | 52 | 499791 | 1648.22 | 1255 | 1215 | 302.5 |
| D | 13 | 249 | 75019 | 243.99 | 1255 | 1215 | 302.5 |
| D | 2 | 234 | 42624 | 136.89 | 1255 | 1215 | 302.5 |
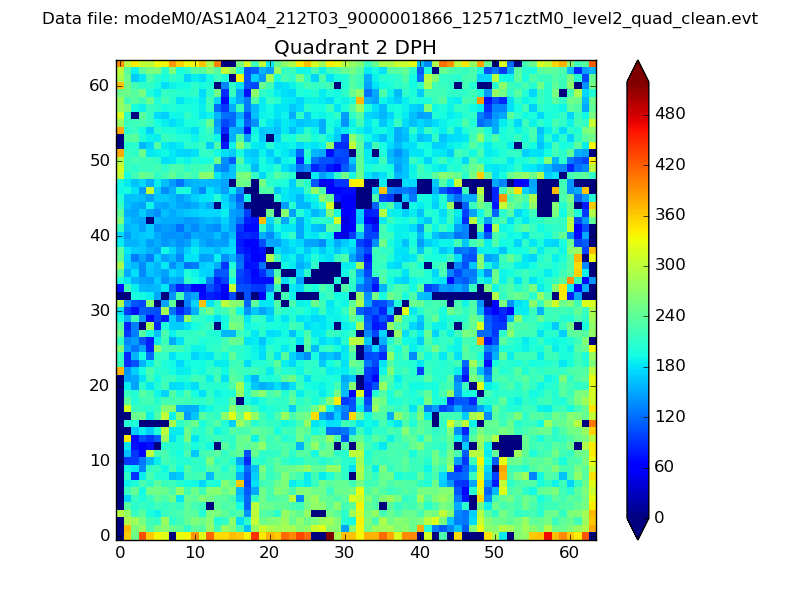
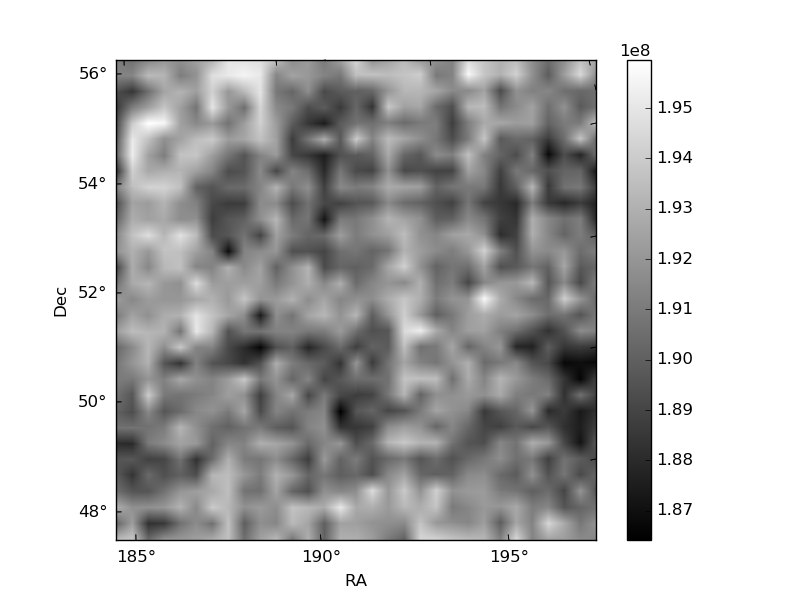
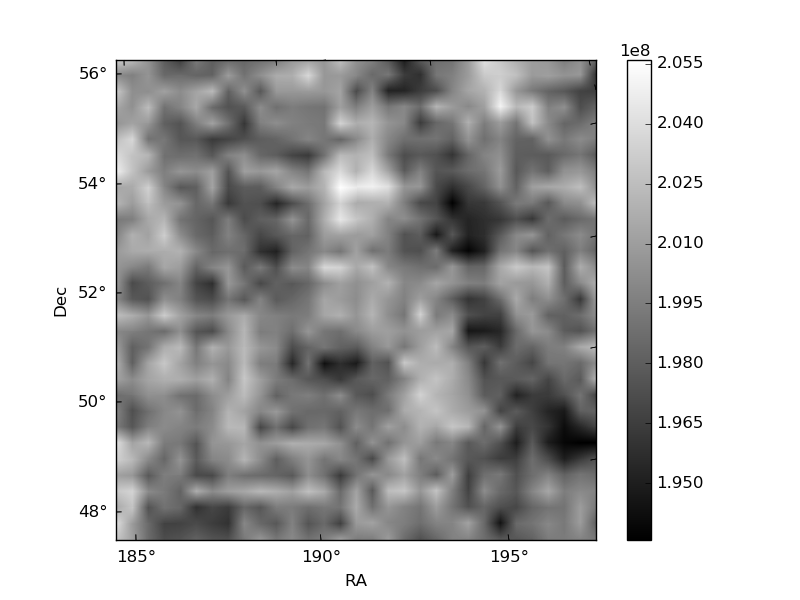
Histogram calculated using DETX and DETY for each event in the final _common_clean file
| Quadrant A | 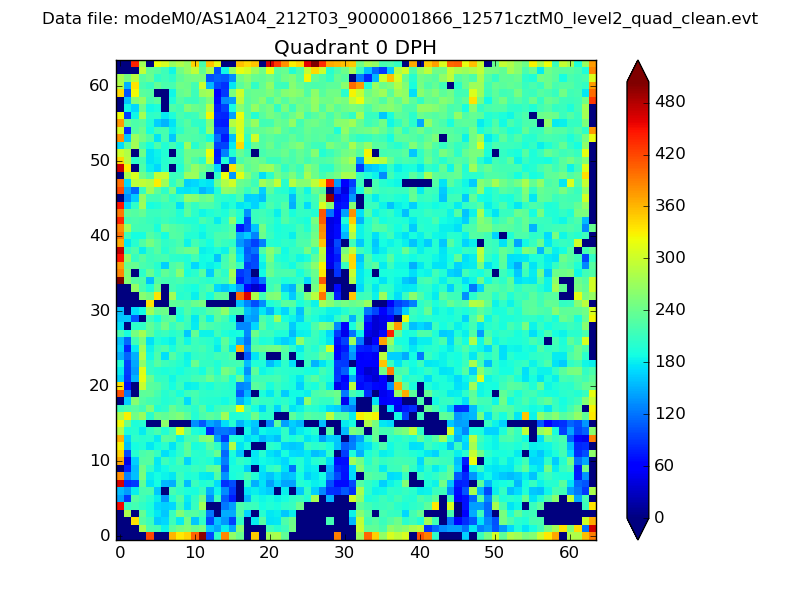 |
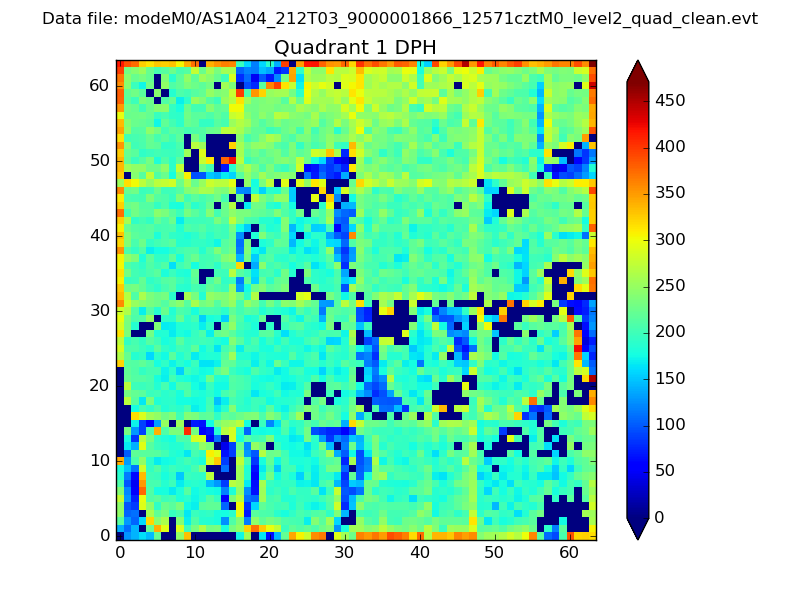 |
Quadrant B |
|---|---|---|---|
| Quadrant D | 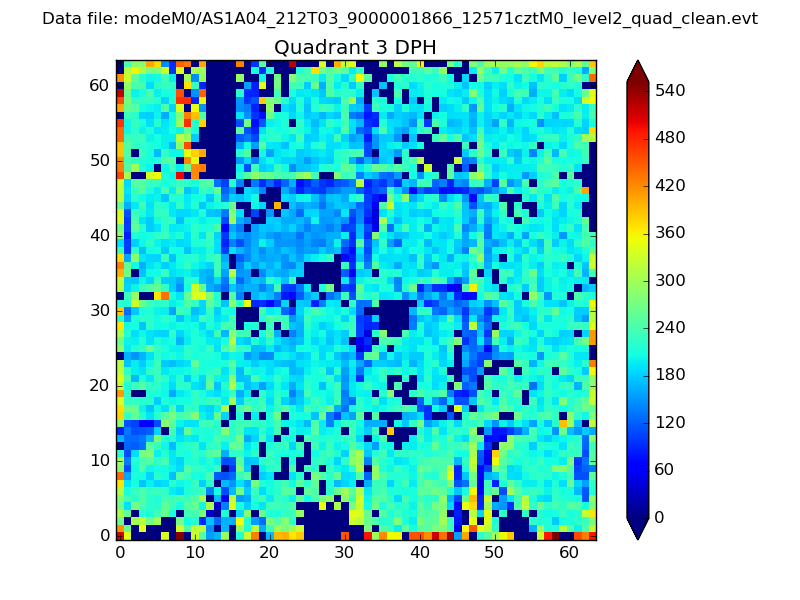 |
 |
Quadrant C |
| Plot type | Count rate plots | Images |
|---|---|---|
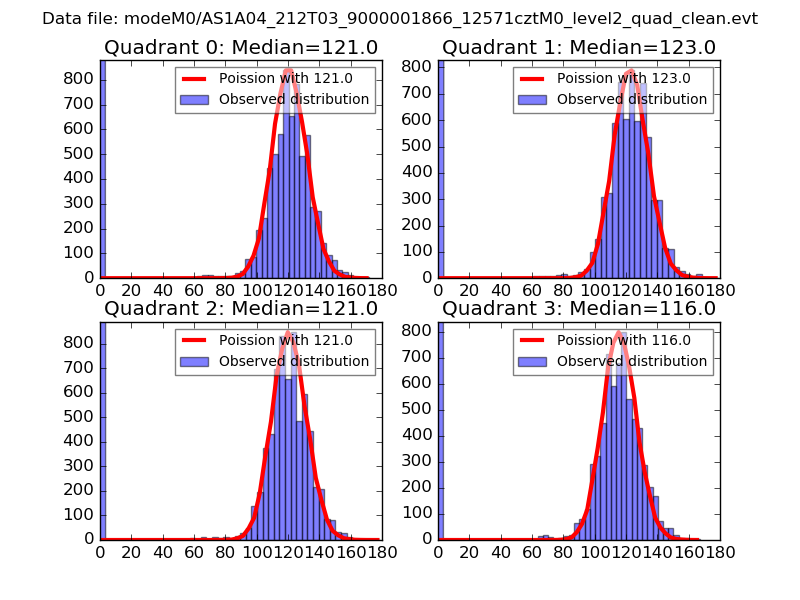
| Comparison with Poisson distribution Blue bars denote a histogram of data divided into 1 sec bins. Red curve is a Poisson curve with rate = median count rate of data. |
 |
 |
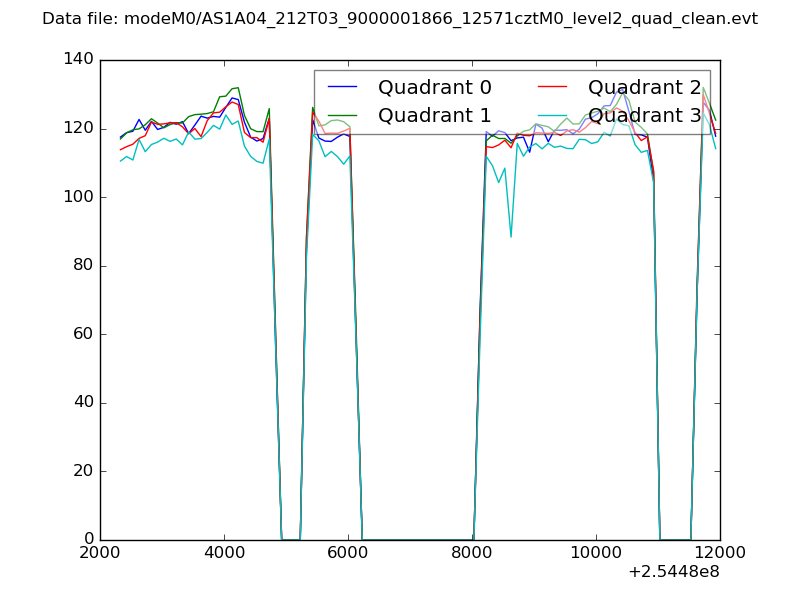
| Quadrant-wise count rates Data is divided into 100 sec bins |
 |
|
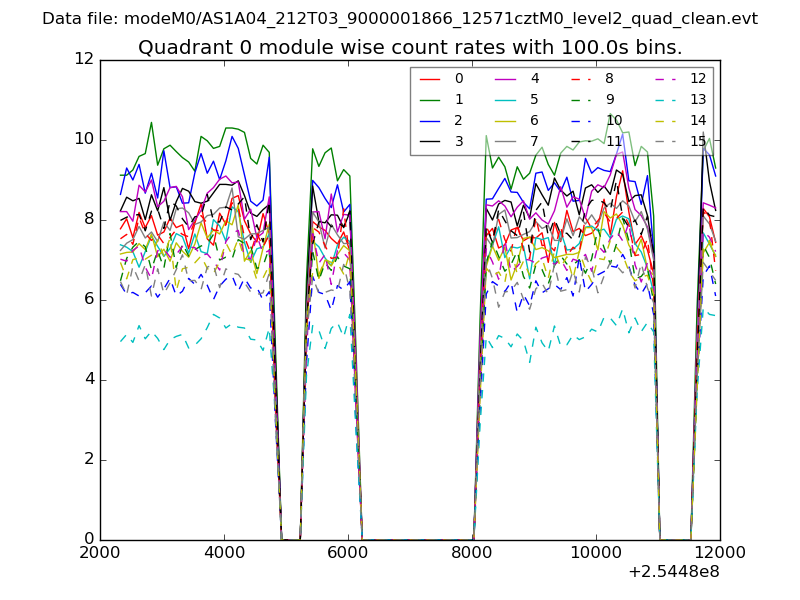
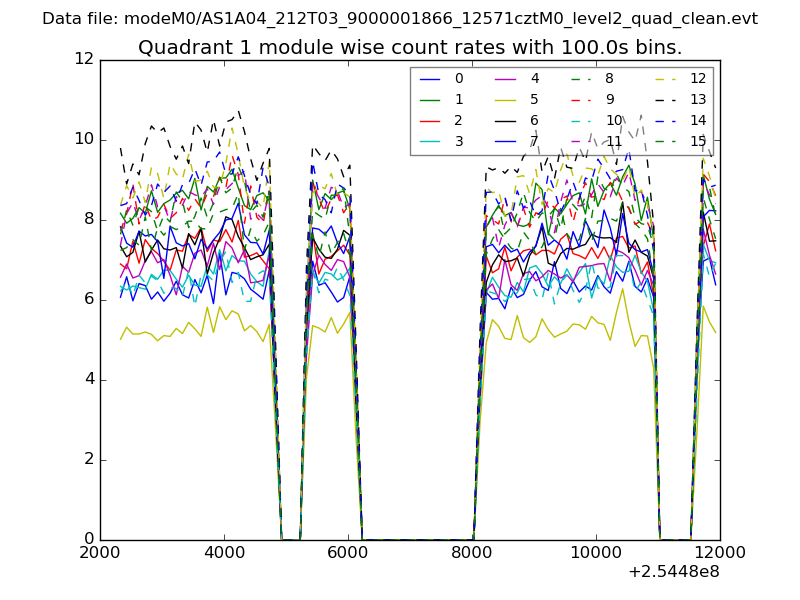
| Module-wise count rates for Quadrant A Data is divided into 100 sec bins |
 |
 |
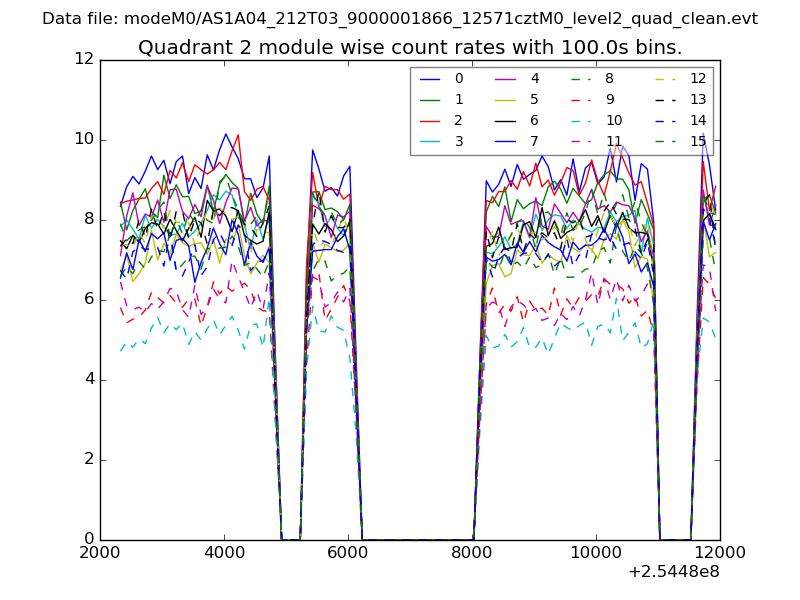
| Module-wise count rates for Quadrant B Data is divided into 100 sec bins |
 |
 |
| Module-wise count rates for Quadrant C Data is divided into 100 sec bins |
 |
 |
| Module-wise count rates for Quadrant D Data is divided into 100 sec bins |
 |
 |
| Parameter | Plot |
|---|---|
| CZT HV Monitor | 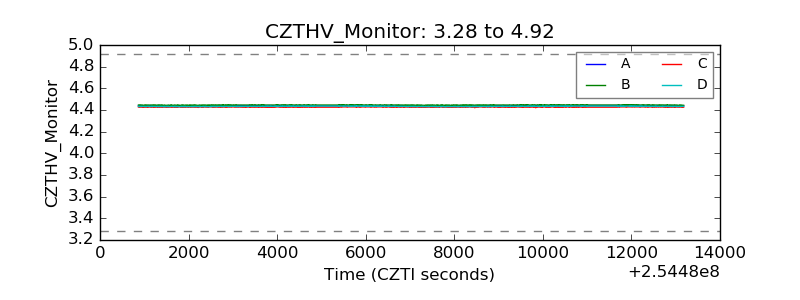 |
| D_VDD | 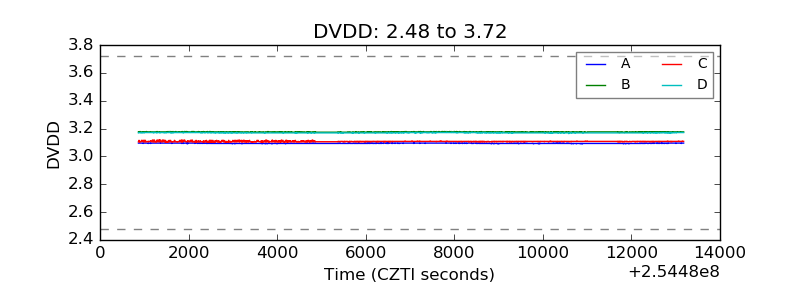 |
| Temperature 1 | 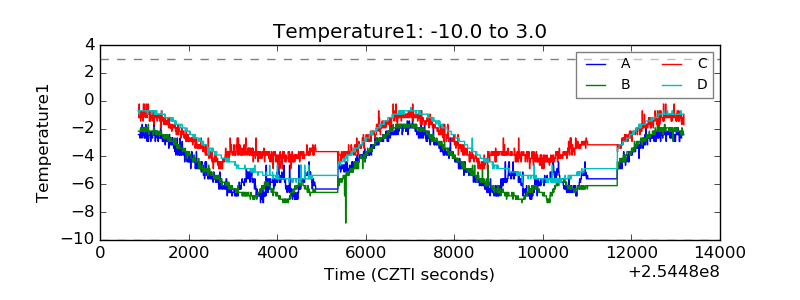 |
| Veto HV Monitor | 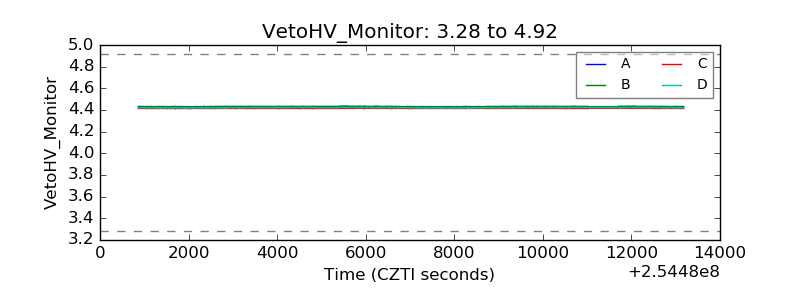 |
| Veto LLD | 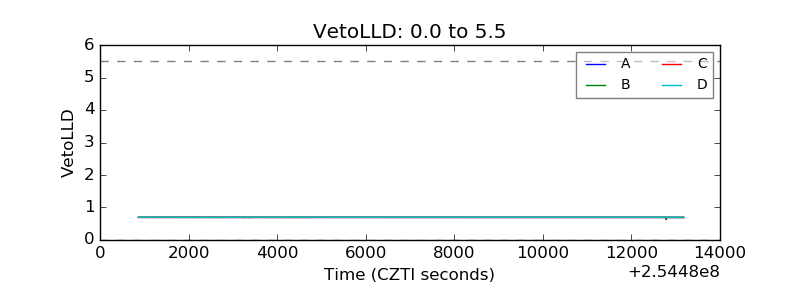 |
| Alpha Counter | 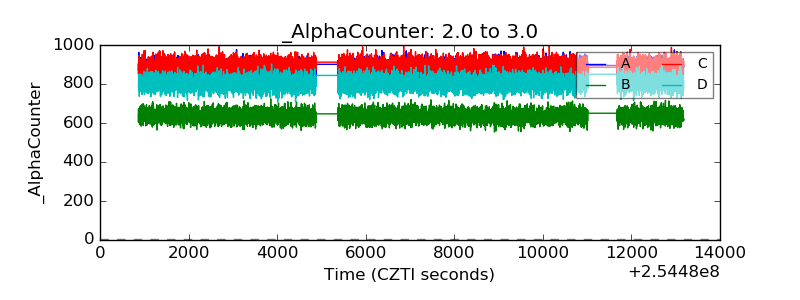 |
| _CPM_Rate | 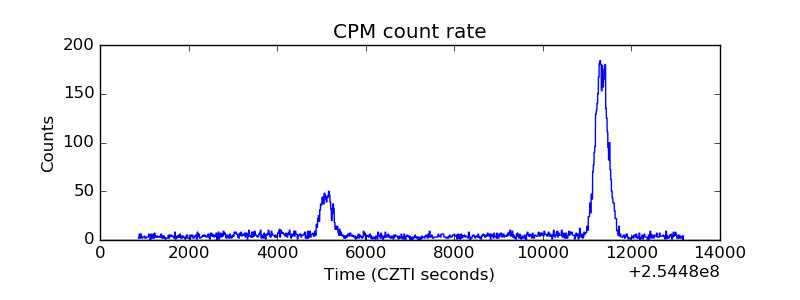 |
| CZT Counter | 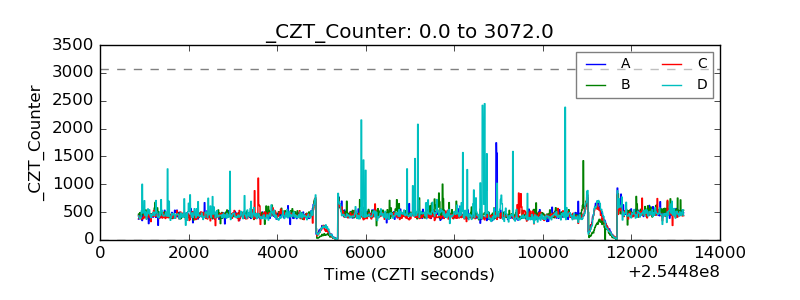 |
| +2.5 Volts monitor |  |
| +5 Volts monitor | 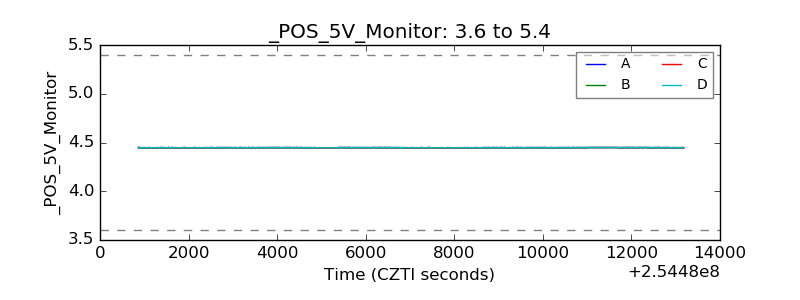 |
| _ROLL_ROT | 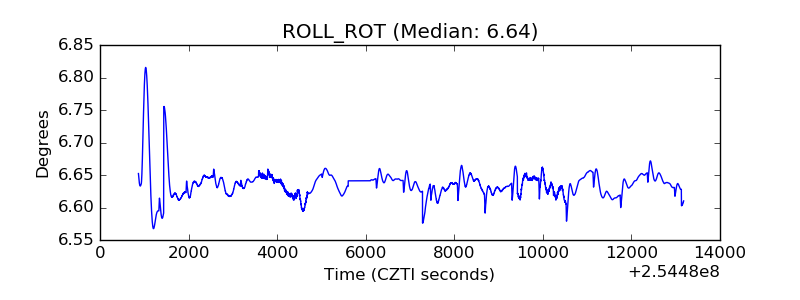 |
| _Roll_DEC | 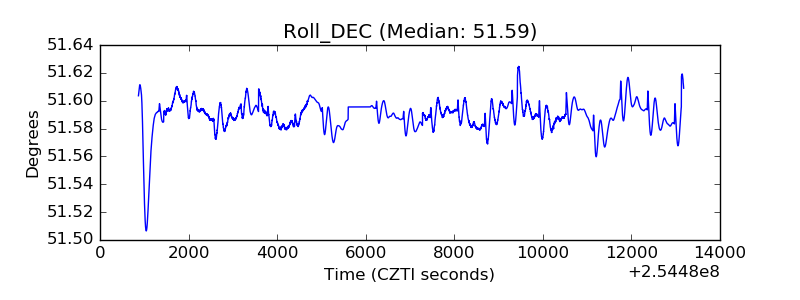 |
| _Roll_RA | 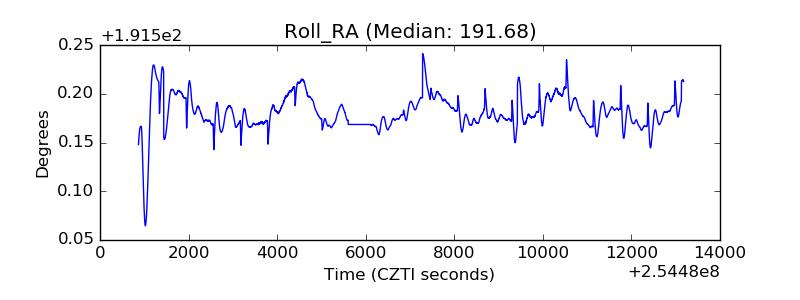 |
| Veto Counter | 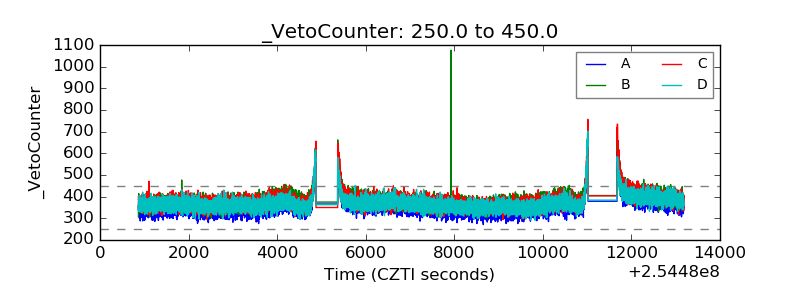 |