| Param | Original file | Final file |
|---|---|---|
| Filename | modeM0/AS1G08_071T01_9000001874_12586cztM0_level2.evt | modeM0/AS1G08_071T01_9000001874_12586cztM0_level2_quad_clean.evt |
| Size (bytes) | 1,156,780,800 | 158,549,760 |
| Size | 1.1 GB | 151.2 MB |
| Events in quadrant A | 6,429,650 | 977,715 |
| Events in quadrant B | 9,526,819 | 975,478 |
| Events in quadrant C | 6,299,479 | 984,341 |
| Events in quadrant D | 11,839,662 | 905,266 |
| Mode SS | |||
|---|---|---|---|
| Quadrant | BADHDUFLAG | Total packets | Discarded packets |
| A | 0 | 286 | 0 |
| B | 0 | 286 | 0 |
| C | 0 | 286 | 0 |
| D | 0 | 286 | 0 |
| Mode M0 | |||
|---|---|---|---|
| Quadrant | BADHDUFLAG | Total packets | Discarded packets |
| A | 0 | 28384 | 4 |
| B | 0 | 37292 | 3 |
| C | 0 | 28362 | 3 |
| D | 0 | 44500 | 3 |
| Mode M9 | |||
|---|---|---|---|
| Quadrant | BADHDUFLAG | Total packets | Discarded packets |
| A | 0 | 15 | 0 |
| B | 0 | 15 | 0 |
| C | 0 | 15 | 0 |
| D | 0 | 15 | 0 |
| Quadrant | Total seconds | Saturated seconds | Saturation percentage |
|---|---|---|---|
| A | 13867 | 298 | 2.148987% |
| B | 13867 | 950 | 6.850797% |
| C | 13867 | 245 | 1.766784% |
| D | 13867 | 1697 | 12.237687% |
Noise dominated data is calculated using 1-second bins in cleaned event files. If a bin has >2000 counts, and if more than 50% of those come from <1% of pixels, then it is considered to be noise-dominated and hence unusable.
| Quadrant | # 1 sec bins | Bins with >0 counts | Bins with >2000 counts | High rate bins dominated by noise | Noise dominated (total time) | Noise dominated (detector-on time) | Marked lightcurve |
|---|---|---|---|---|---|---|---|
| A | 15428 | 13868 | 0 | 0 | 0.00% | 0.00% | 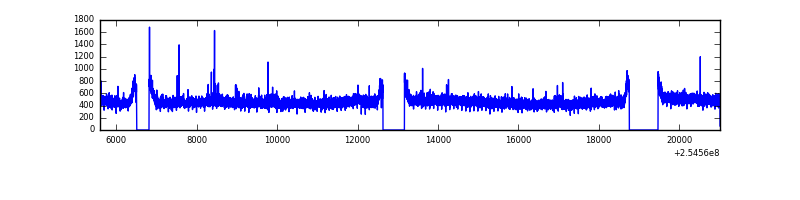 |
| B | 15428 | 13868 | 483 | 483 | 3.13% | 3.48% | 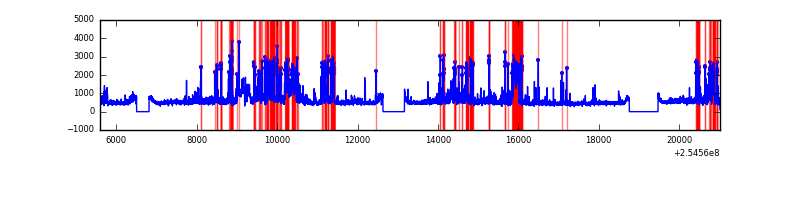 |
| C | 15428 | 13868 | 5 | 5 | 0.03% | 0.04% | 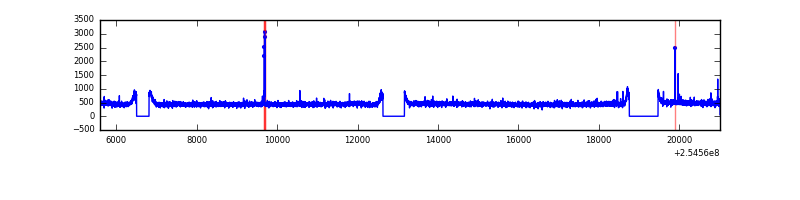 |
| D | 15428 | 13868 | 1312 | 1312 | 8.50% | 9.46% | 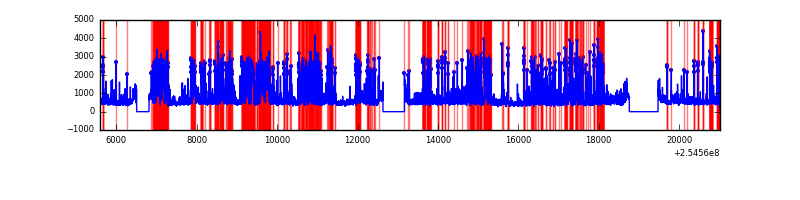 |
Top three noisy pixels from each quadrant. If the there are fewer than three noisy pixels in the level2.evt file, extra rows are filled as -1
| Pixel properties | Quadrant properties | ||||||
|---|---|---|---|---|---|---|---|
| Quadrant | DetID | PixID | Counts | Sigma | Mean | Median | Sigma |
| A | 12 | 189 | 65297 | 188.34 | 1652 | 1610 | 338.1 |
| A | 12 | 96 | 16258 | 43.32 | 1652 | 1610 | 338.1 |
| A | 0 | 226 | 14678 | 38.65 | 1652 | 1610 | 338.1 |
| B | 3 | 64 | 1832815 | 5887.08 | 1627 | 1583 | 311.1 |
| B | 4 | 239 | 912281 | 2927.73 | 1627 | 1583 | 311.1 |
| B | 11 | 51 | 222601 | 710.53 | 1627 | 1583 | 311.1 |
| C | 14 | 234 | 21830 | 54.3 | 1604 | 1609 | 372.4 |
| C | 15 | 208 | 20628 | 51.08 | 1604 | 1609 | 372.4 |
| C | 13 | 61 | 11826 | 27.44 | 1604 | 1609 | 372.4 |
| D | 1 | 52 | 4436118 | 12049.09 | 1521 | 1473 | 368.0 |
| D | 10 | 157 | 1304275 | 3539.76 | 1521 | 1473 | 368.0 |
| D | 10 | 199 | 124767 | 334.99 | 1521 | 1473 | 368.0 |
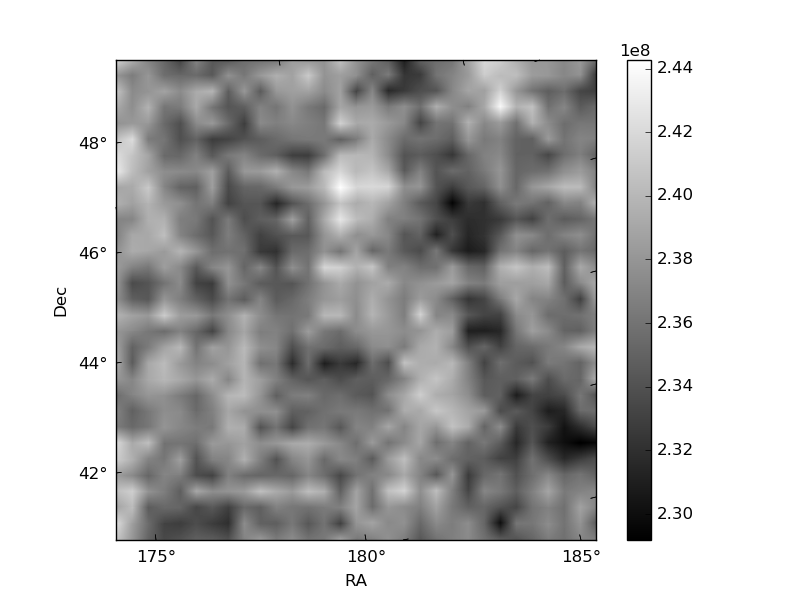
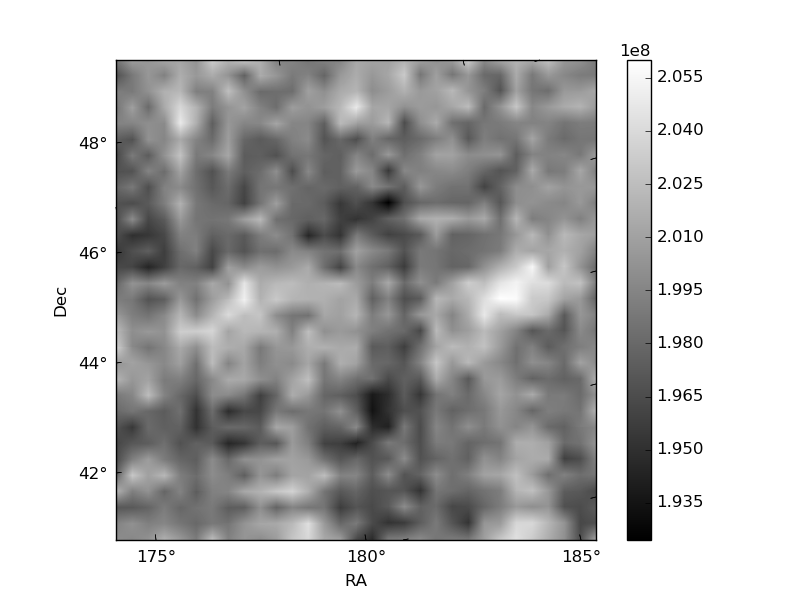
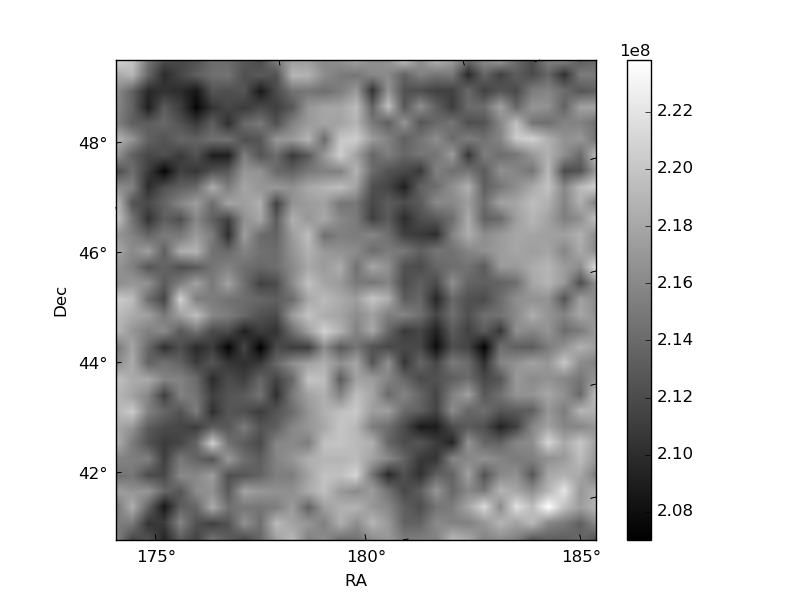
Histogram calculated using DETX and DETY for each event in the final _common_clean file
| Quadrant A | 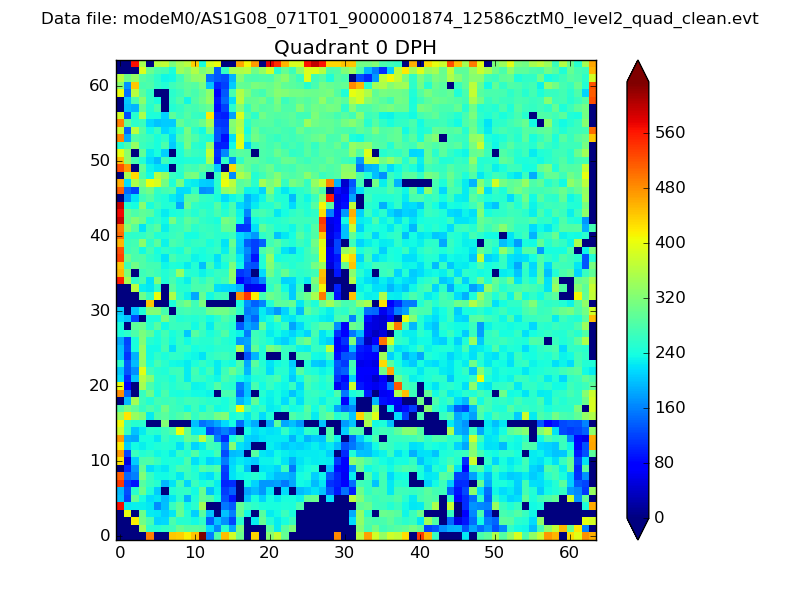 |
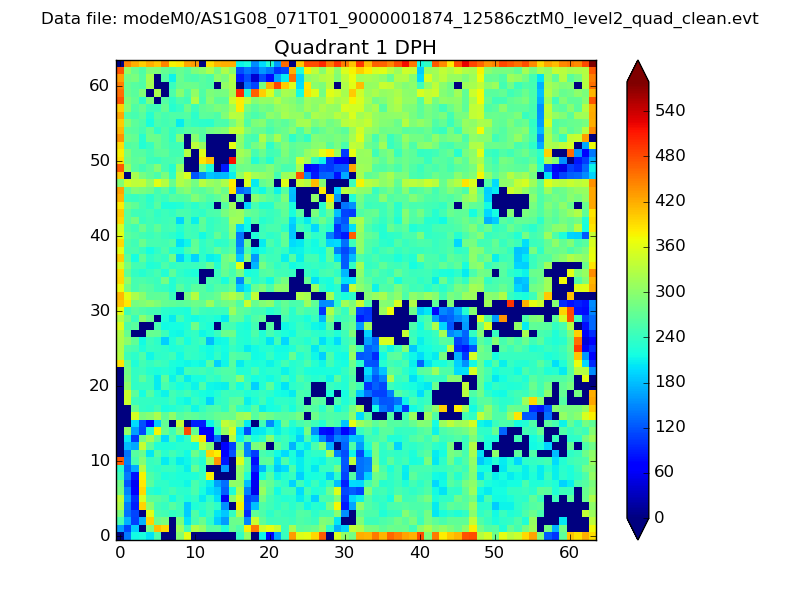 |
Quadrant B |
|---|---|---|---|
| Quadrant D | 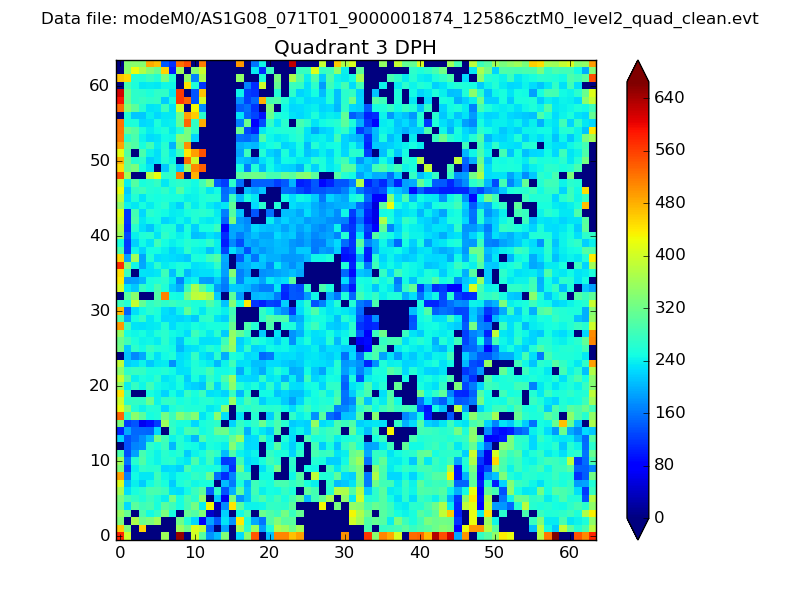 |
 |
Quadrant C |
| Plot type | Count rate plots | Images |
|---|---|---|
| Comparison with Poisson distribution Blue bars denote a histogram of data divided into 1 sec bins. Red curve is a Poisson curve with rate = median count rate of data. |
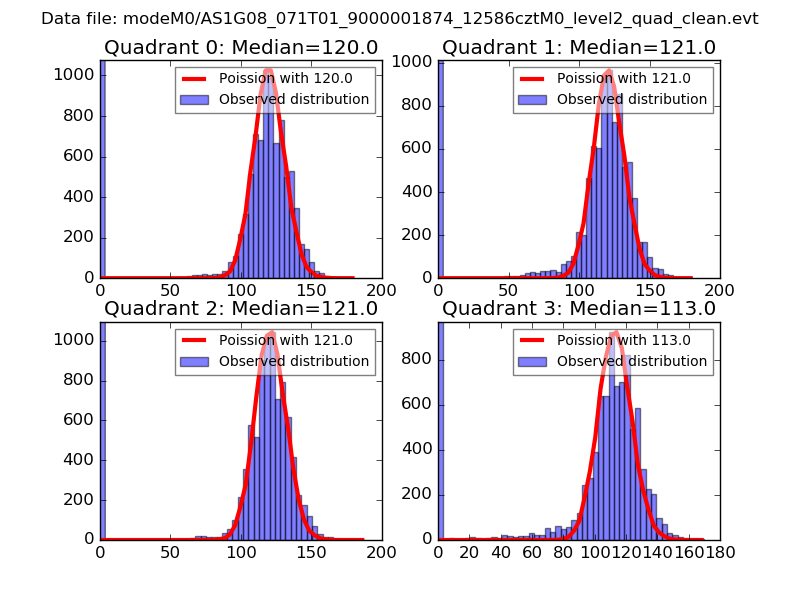 |
 |
| Quadrant-wise count rates Data is divided into 100 sec bins |
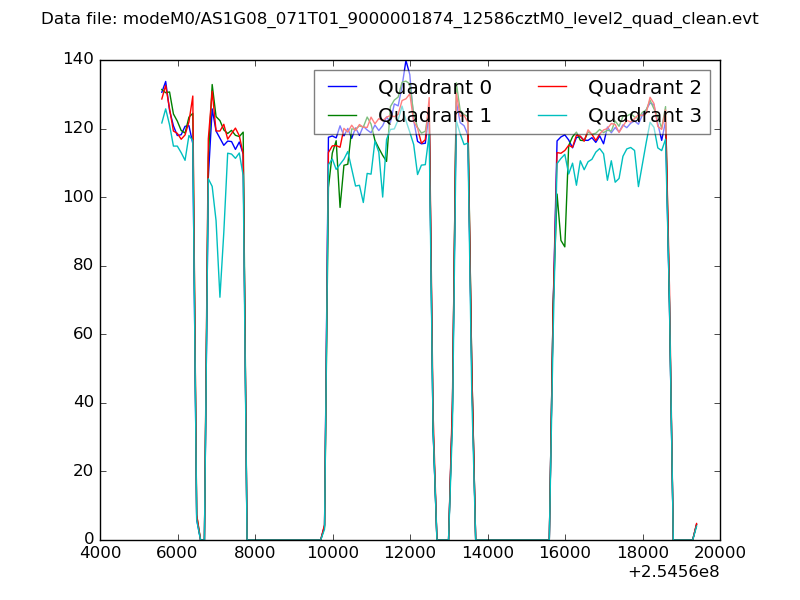 |
|
| Module-wise count rates for Quadrant A Data is divided into 100 sec bins |
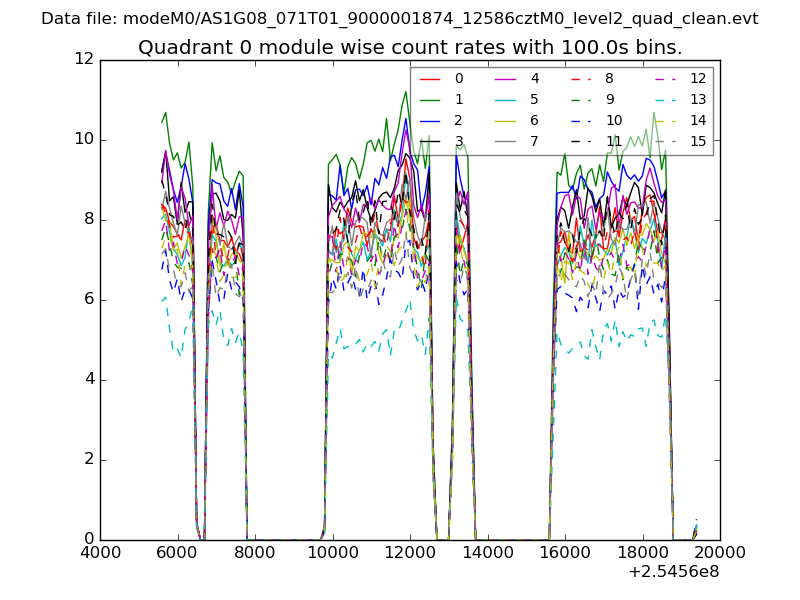 |
 |
| Module-wise count rates for Quadrant B Data is divided into 100 sec bins |
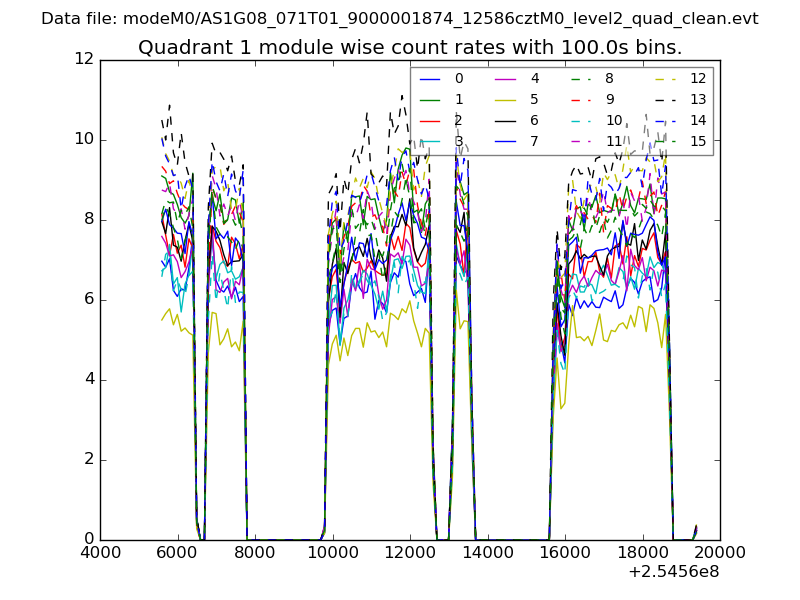 |
 |
| Module-wise count rates for Quadrant C Data is divided into 100 sec bins |
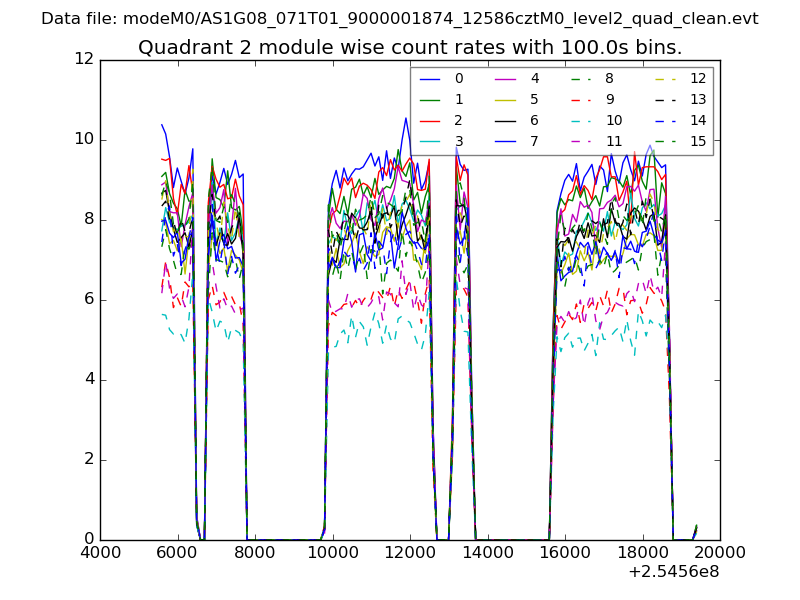 |
 |
| Module-wise count rates for Quadrant D Data is divided into 100 sec bins |
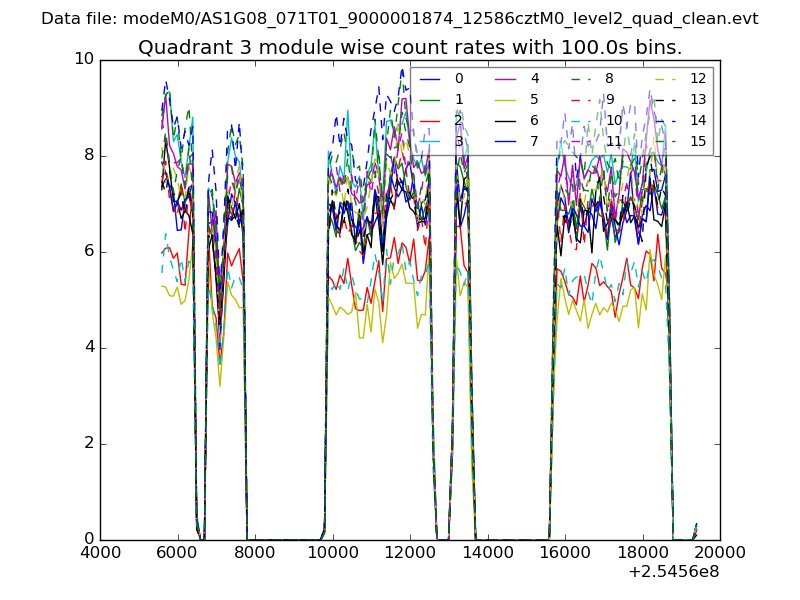 |
 |
| Parameter | Plot |
|---|---|
| CZT HV Monitor | 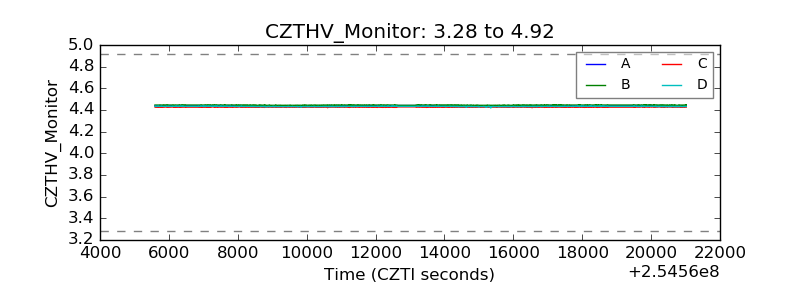 |
| D_VDD | 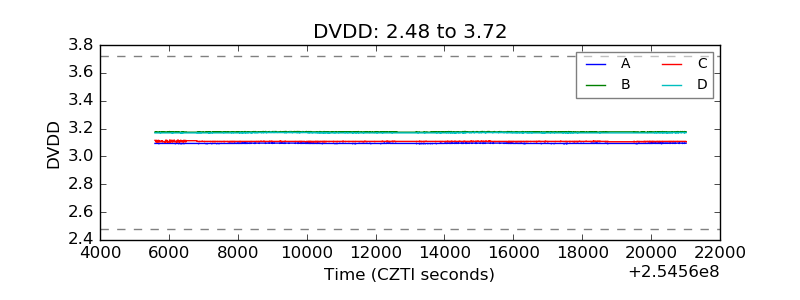 |
| Temperature 1 | 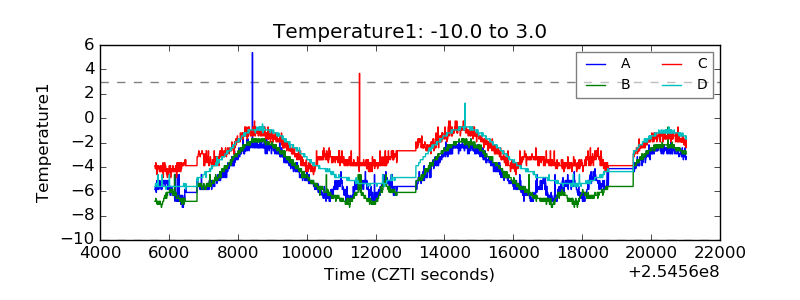 |
| Veto HV Monitor | 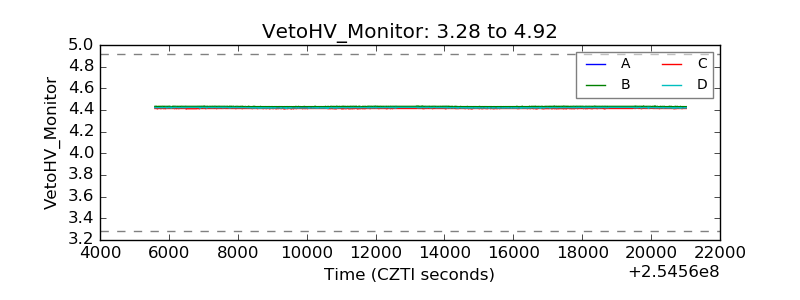 |
| Veto LLD | 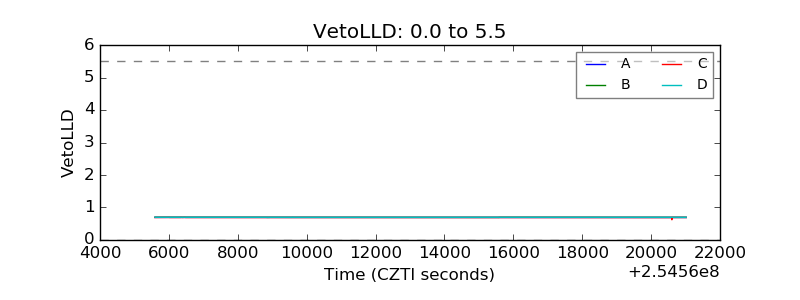 |
| Alpha Counter | 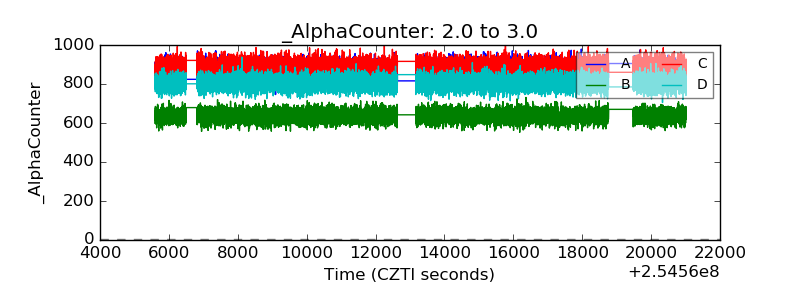 |
| _CPM_Rate | 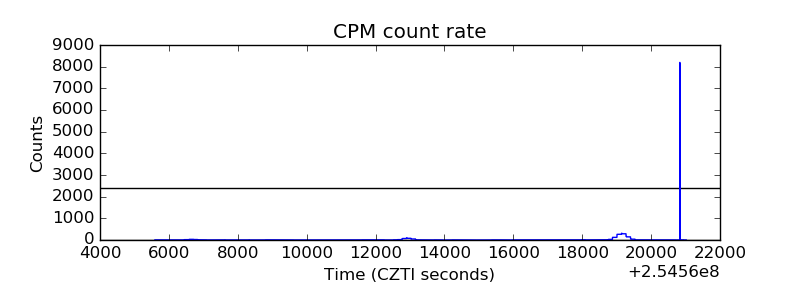 |
| CZT Counter |  |
| +2.5 Volts monitor |  |
| +5 Volts monitor |  |
| _ROLL_ROT |  |
| _Roll_DEC | 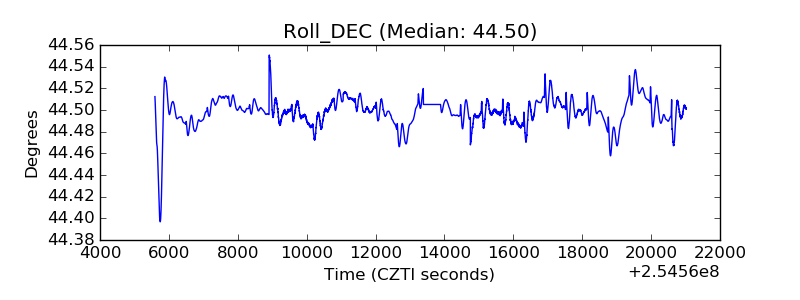 |
| _Roll_RA |  |
| Veto Counter | 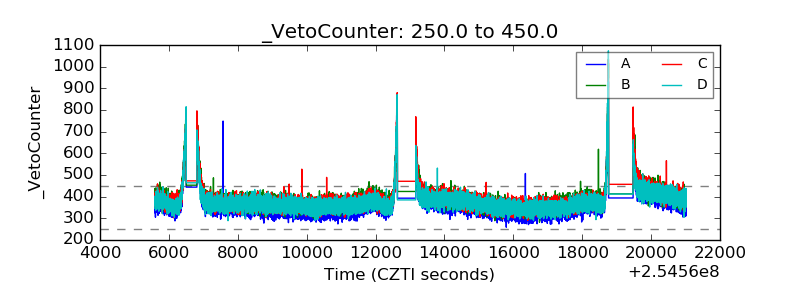 |