| Param | Original file | Final file |
|---|---|---|
| Filename | modeM0/AS1G08_071T01_9000001874_12587cztM0_level2.evt | modeM0/AS1G08_071T01_9000001874_12587cztM0_level2_quad_clean.evt |
| Size (bytes) | 536,820,480 | 67,838,400 |
| Size | 512.0 MB | 64.7 MB |
| Events in quadrant A | 3,379,145 | 398,656 |
| Events in quadrant B | 4,327,725 | 398,210 |
| Events in quadrant C | 3,267,684 | 399,433 |
| Events in quadrant D | 4,818,076 | 380,327 |
| Mode SS | |||
|---|---|---|---|
| Quadrant | BADHDUFLAG | Total packets | Discarded packets |
| A | 0 | 140 | 0 |
| B | 0 | 140 | 0 |
| C | 0 | 140 | 0 |
| D | 0 | 140 | 0 |
| Mode M0 | |||
|---|---|---|---|
| Quadrant | BADHDUFLAG | Total packets | Discarded packets |
| A | 0 | 14540 | 3 |
| B | 0 | 17469 | 2 |
| C | 0 | 14244 | 2 |
| D | 0 | 19021 | 2 |
| Mode M9 | |||
|---|---|---|---|
| Quadrant | BADHDUFLAG | Total packets | Discarded packets |
| A | 0 | 17 | 0 |
| B | 0 | 17 | 0 |
| C | 0 | 17 | 0 |
| D | 0 | 17 | 0 |
| Quadrant | Total seconds | Saturated seconds | Saturation percentage |
|---|---|---|---|
| A | 6852 | 132 | 1.926445% |
| B | 6852 | 398 | 5.808523% |
| C | 6852 | 111 | 1.619965% |
| D | 6852 | 598 | 8.727379% |
Noise dominated data is calculated using 1-second bins in cleaned event files. If a bin has >2000 counts, and if more than 50% of those come from <1% of pixels, then it is considered to be noise-dominated and hence unusable.
| Quadrant | # 1 sec bins | Bins with >0 counts | Bins with >2000 counts | High rate bins dominated by noise | Noise dominated (total time) | Noise dominated (detector-on time) | Marked lightcurve |
|---|---|---|---|---|---|---|---|
| A | 8513 | 6853 | 5 | 5 | 0.06% | 0.07% | 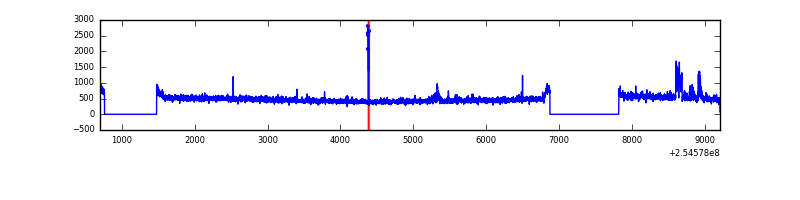 |
| B | 8513 | 6853 | 196 | 196 | 2.30% | 2.86% | 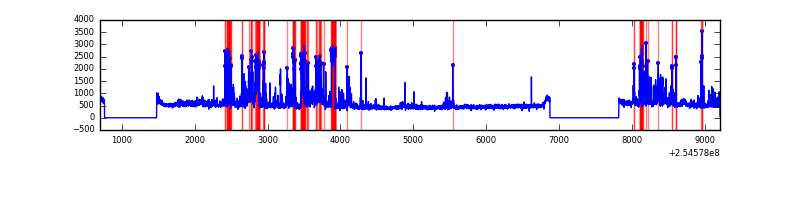 |
| C | 8513 | 6853 | 6 | 6 | 0.07% | 0.09% | 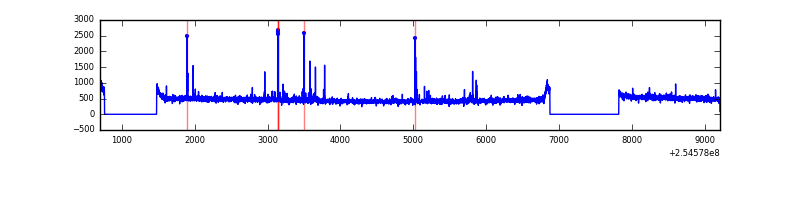 |
| D | 8513 | 6853 | 432 | 432 | 5.07% | 6.30% | 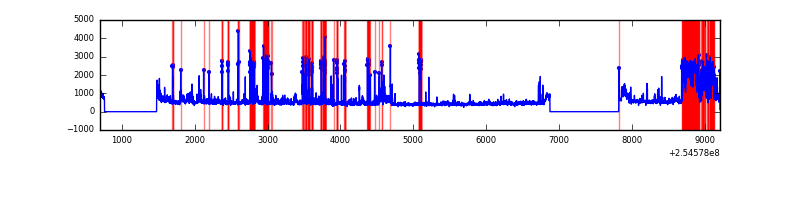 |
Top three noisy pixels from each quadrant. If the there are fewer than three noisy pixels in the level2.evt file, extra rows are filled as -1
| Pixel properties | Quadrant properties | ||||||
|---|---|---|---|---|---|---|---|
| Quadrant | DetID | PixID | Counts | Sigma | Mean | Median | Sigma |
| A | 5 | 112 | 118598 | 691.12 | 836 | 817 | 170.4 |
| A | 12 | 189 | 23546 | 133.37 | 836 | 817 | 170.4 |
| A | 15 | 69 | 14405 | 79.73 | 836 | 817 | 170.4 |
| B | 4 | 239 | 540432 | 3374.32 | 822 | 801 | 159.9 |
| B | 3 | 64 | 401610 | 2506.27 | 822 | 801 | 159.9 |
| B | 11 | 51 | 90402 | 560.28 | 822 | 801 | 159.9 |
| C | 15 | 208 | 87375 | 457.53 | 813 | 816 | 189.2 |
| C | 13 | 61 | 5852 | 26.62 | 813 | 816 | 189.2 |
| C | 3 | 233 | 4746 | 20.77 | 813 | 816 | 189.2 |
| D | 1 | 52 | 1268533 | 6692.97 | 787 | 763 | 189.4 |
| D | 10 | 157 | 406813 | 2143.67 | 787 | 763 | 189.4 |
| D | 13 | 104 | 60919 | 317.58 | 787 | 763 | 189.4 |
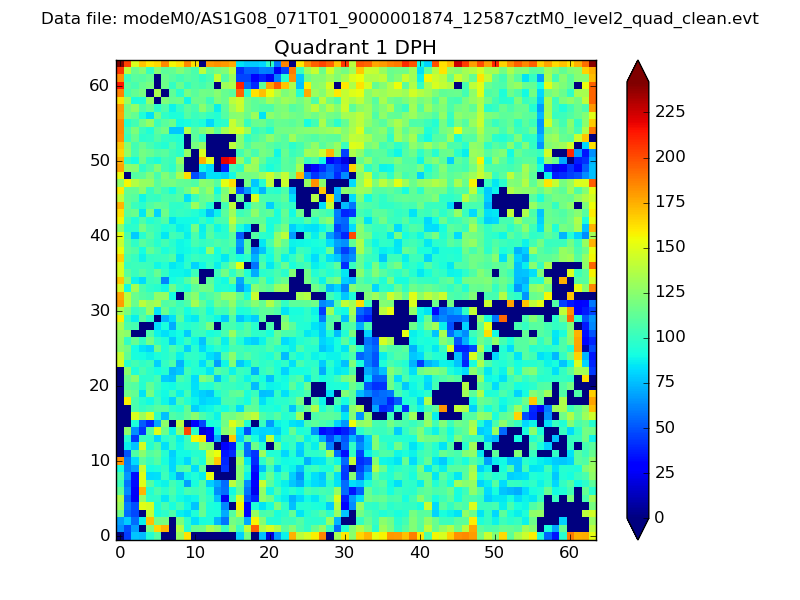
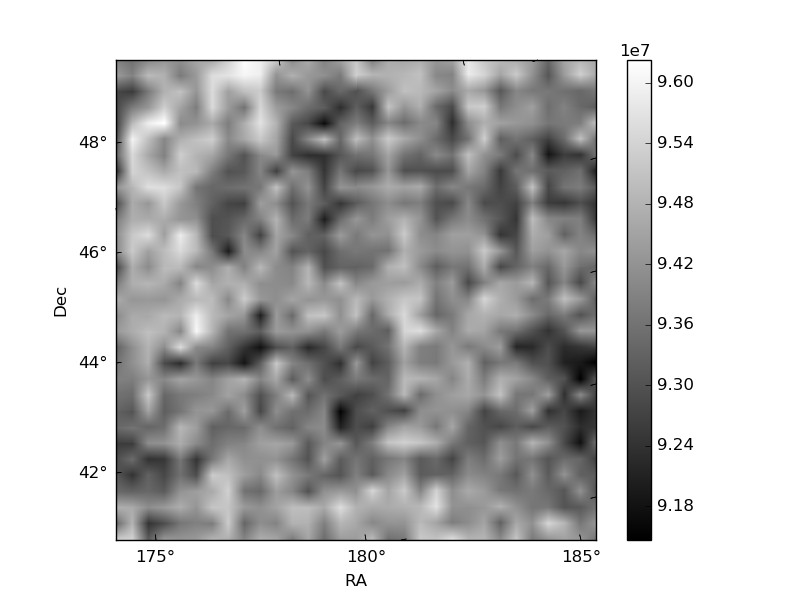
Histogram calculated using DETX and DETY for each event in the final _common_clean file
| Quadrant A |  |
 |
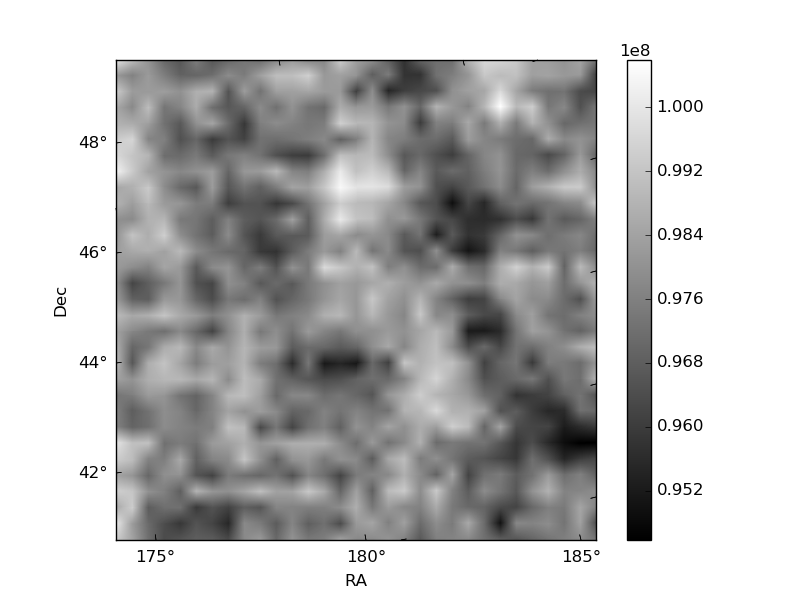
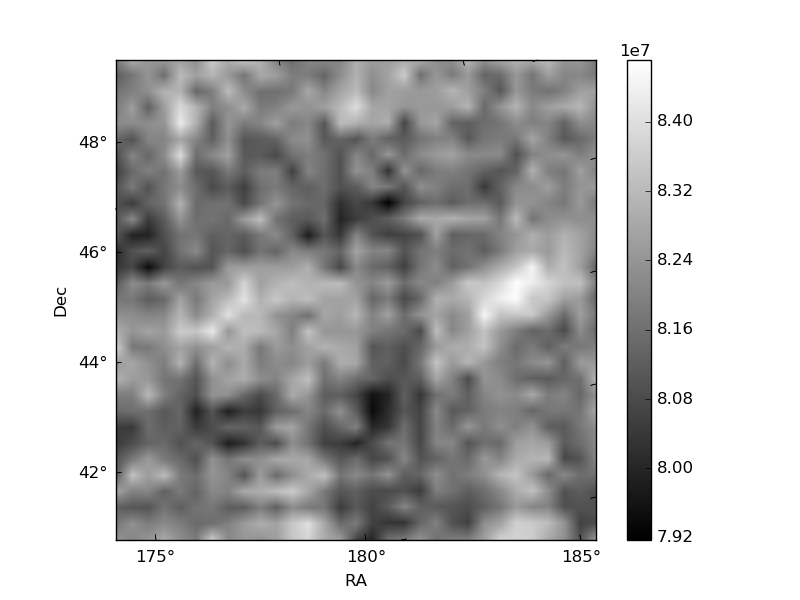
Quadrant B |
|---|---|---|---|
| Quadrant D | 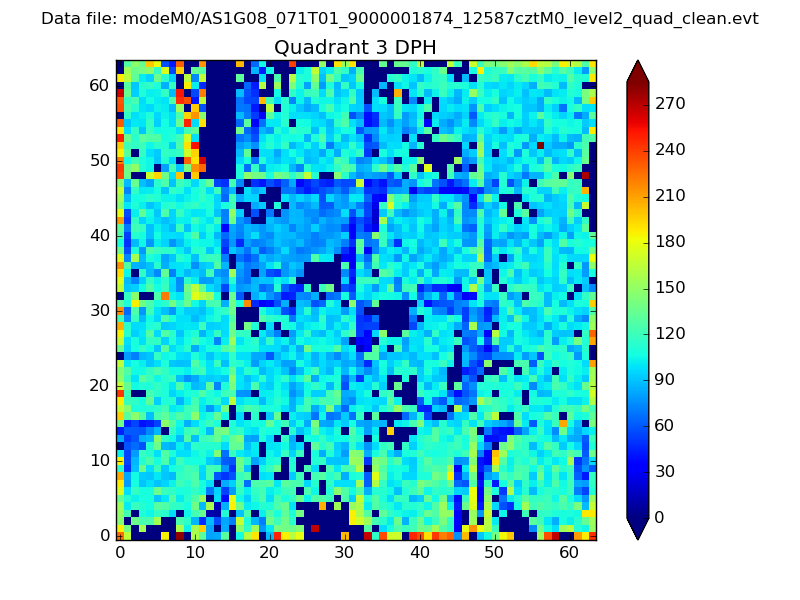 |
 |
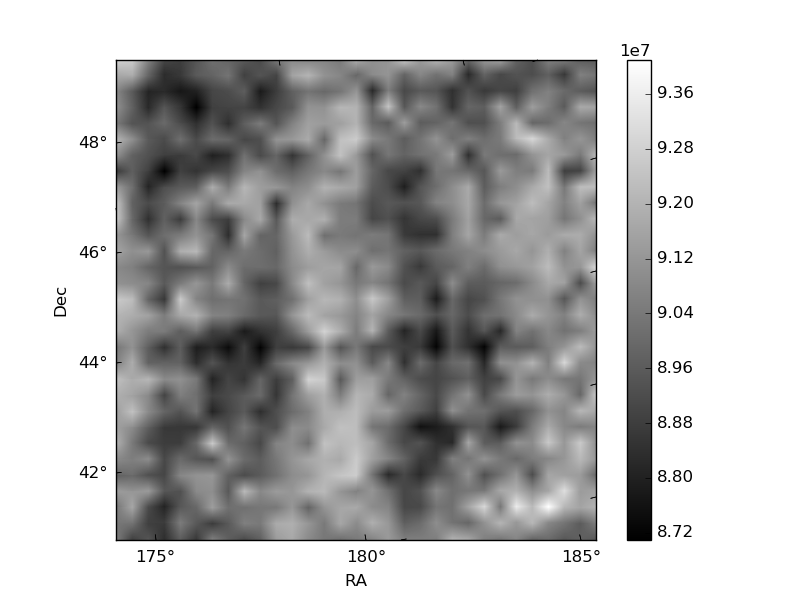
Quadrant C |
| Plot type | Count rate plots | Images |
|---|---|---|
| Comparison with Poisson distribution Blue bars denote a histogram of data divided into 1 sec bins. Red curve is a Poisson curve with rate = median count rate of data. |
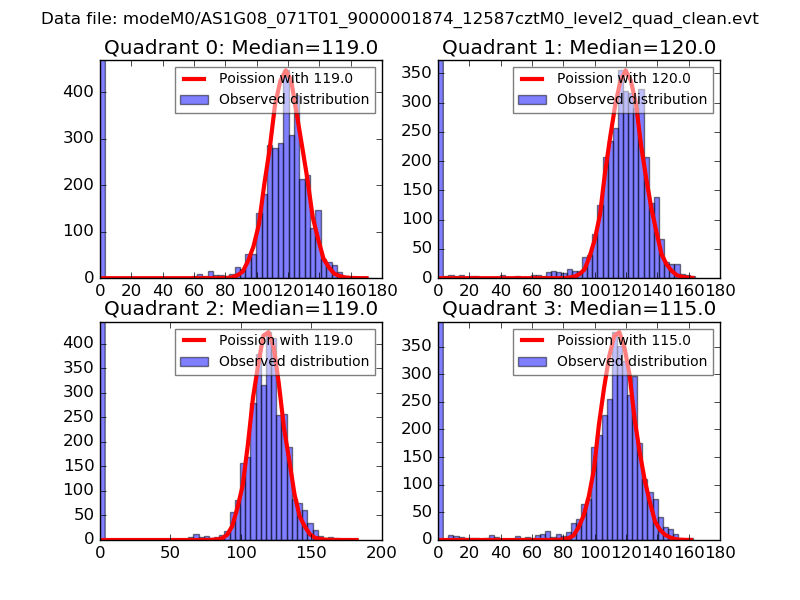 |
 |
| Quadrant-wise count rates Data is divided into 100 sec bins |
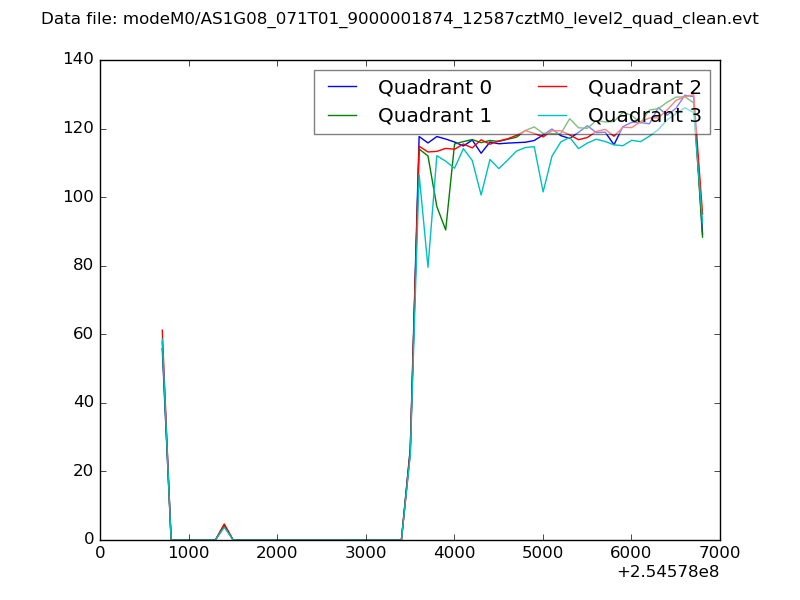 |
|
| Module-wise count rates for Quadrant A Data is divided into 100 sec bins |
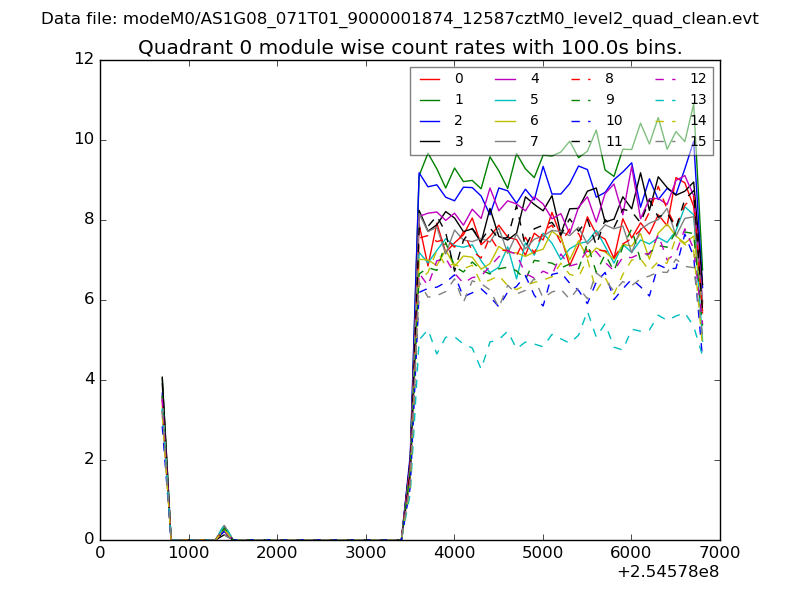 |
 |
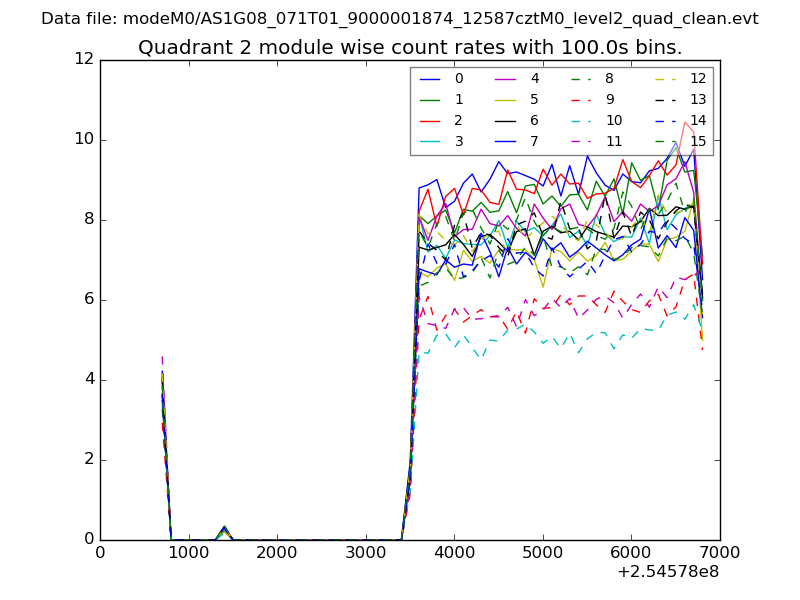
| Module-wise count rates for Quadrant B Data is divided into 100 sec bins |
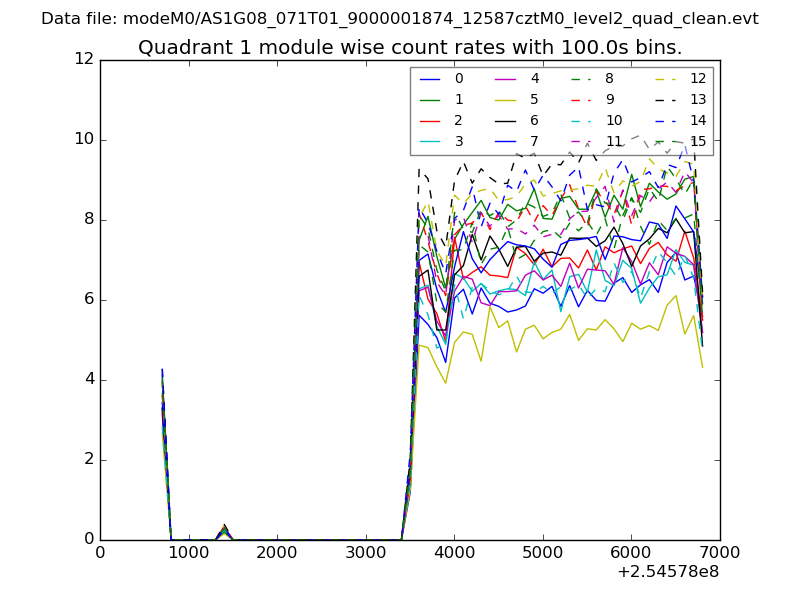 |
 |
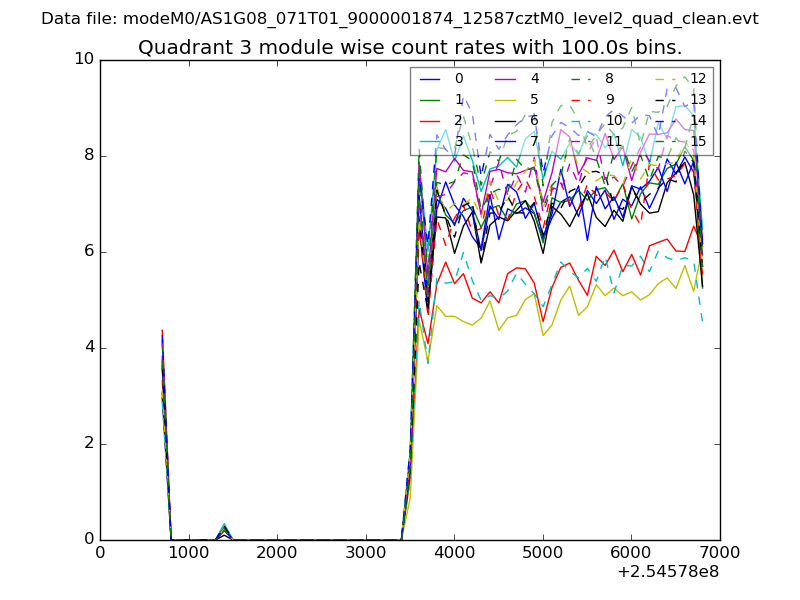
| Module-wise count rates for Quadrant C Data is divided into 100 sec bins |
 |
 |
| Module-wise count rates for Quadrant D Data is divided into 100 sec bins |
 |
 |
| Parameter | Plot |
|---|---|
| CZT HV Monitor | 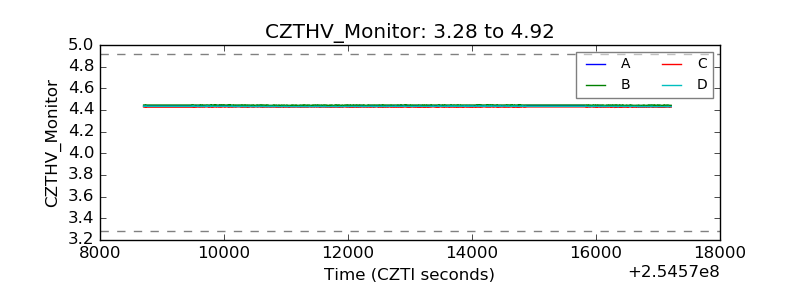 |
| D_VDD | 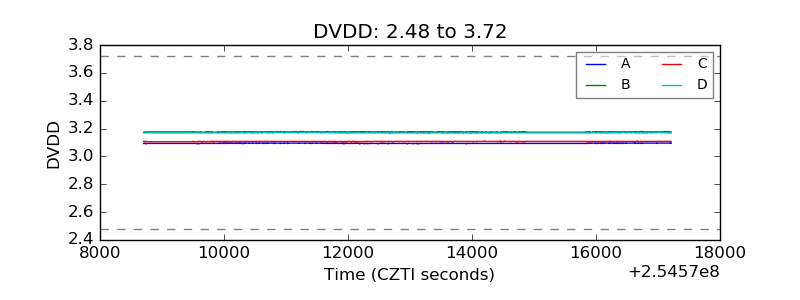 |
| Temperature 1 | 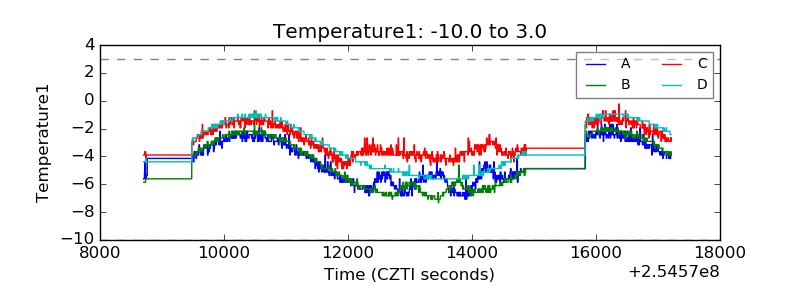 |
| Veto HV Monitor | 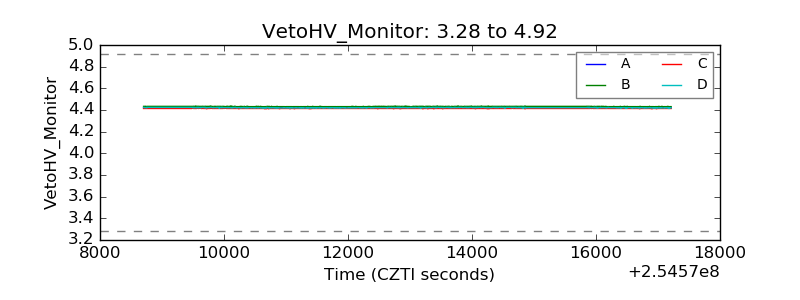 |
| Veto LLD | 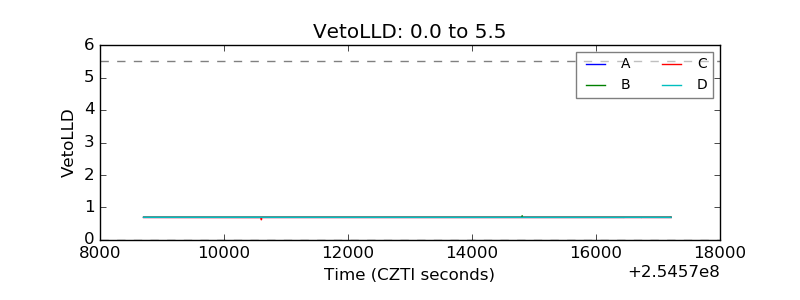 |
| Alpha Counter | 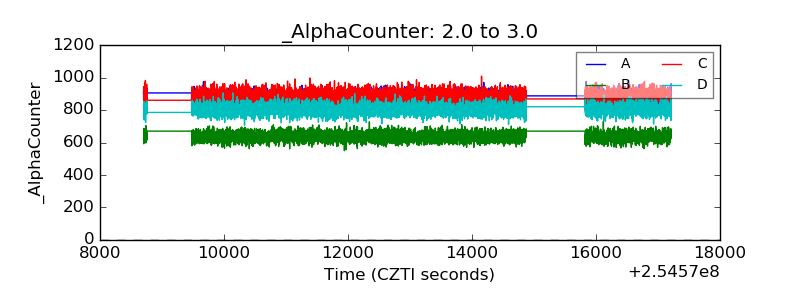 |
| _CPM_Rate | 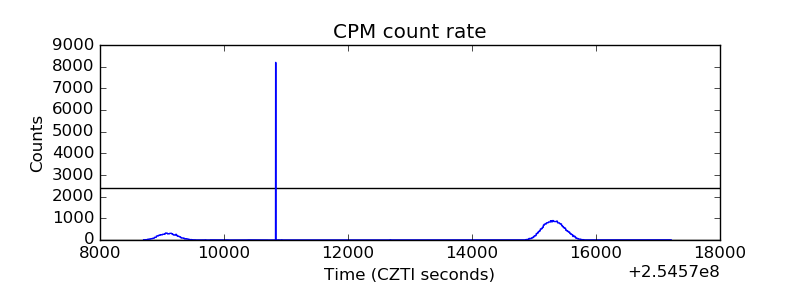 |
| CZT Counter |  |
| +2.5 Volts monitor |  |
| +5 Volts monitor |  |
| _ROLL_ROT | 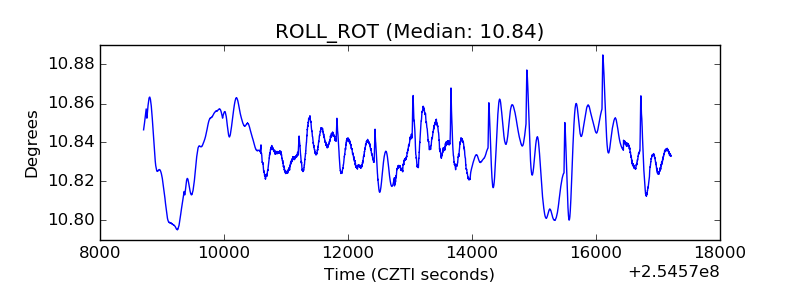 |
| _Roll_DEC | 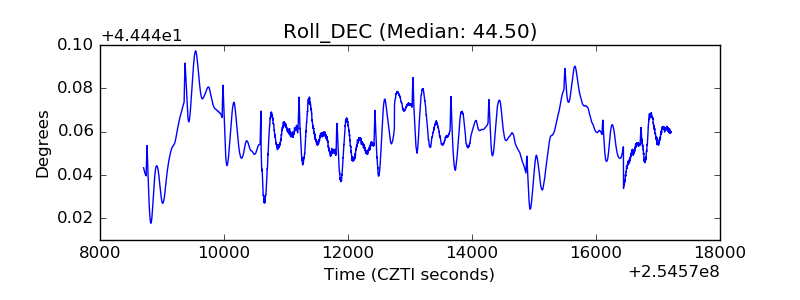 |
| _Roll_RA |  |
| Veto Counter | 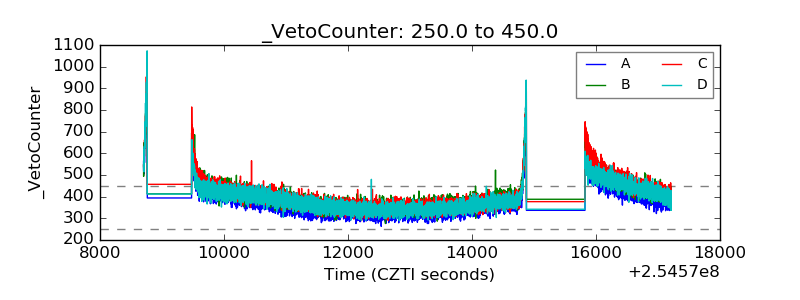 |